Microbial Protein Production In The Rumen Of Steers Fed Low
Quality Forage Supplemented With Various Levelsof
Palm Kernel Or Copra Meal
M
Maarrsseettyyoo
Jurusan Peternakan Fakultas Pertanian, Universitas Tadulako, Palu, Sulawesi Tengah
Ringkasan
Tujuan penelitian adalah untuk menguji pengaruh peningkatan konsumsi bungkil kelapa sawit (BKS) atau bungkil kelapa (BK) terhadap produksi protein mikroba, efisiensi produksi protein mikroba dalam rumen, parameter di dalam rumen pada pedet Brahman jantan dengan pakan dasar rumput berkualitas rendah. Sebanyak 10 ekor pedet Brahman jantan dialokasikan pada dua jenis suplemen yang dicobakan. Pedet diberikan pakan dasar berupa rumput benggala secara ad libitum. Sebagai perlakuan, BKS dan BK diberikan sebagai suplemen masing-masing adalah 0,0; 0,25; 0,50; 0,75; 1,0 % dari berat badan per hari (BB/hari).Rancangan percobaan yang digunakan adalah bujur sangkar latin ganda tidak lengkap (5x5), yang masing – masing dengan 3 periode sebagai ulangan. Setiap periode terdiri atas 21 hari untuk masa adaptasi dan 7 hari untuk pengukuran. Pemberian suplemen BKS atau BK pada pakan hijauan yang berkualitas rendah dapat meningkatkan secara linier (P<0,01) produksi protein mikroba di dalam rumen. Peningkatan konsumsi BKS atau BK meningkatkan secara kuadratik (P<0,05) terhadap efisiensi produksi protein mikroba di dalam rumen dan konsentrasi NH3-N di dalam rumen (3 dan 24 jam setelah ternak mengkonsumsi suplemen). Sebaliknya, pH rumen tidak dipengaruhi secara nyata (P>0,05) oleh peningkatan konsumsi BKS atau BK. Dari hasil penelitian dapat disimpulkan bahwa suplementasi bungkil kelapa sawit atau bungkil kelapa sampai pada level 1,0% BB/hari pada pedet yang mengkonsumsi rumput berkualitas rendah, dapat meningkatkan produksi protein mikroba dan efisiensi produksi protein mikroba di dalam rumen. Peningkatan tersebut erat kaitannya dengan peningkatan konsentrasi NH3-N di dalam rumen sebagai akibat dari peningkatan konsumsi suplemen.
Kata Kunci: suplemen, mikroba, rumen, pedet
Introduction
The productivity of beef cattle and other ruminants fed solely low quality forage often very low due to low actual digestibility of feed con-sumed. The high level of lignification of feed and deficiencies of critical nutrients to support an efficient popu-lation of microorganisms in the rumen are the main reasons behind the low utilisation of feed. Hence, supple-mentary feeding for ruminants given low quality forage is essential to
stimulate microbial growth in the rumen, and also nutrient intake by the animal (Orskov, 1999).
Palm kernel meal (PKM) and copra meal (CM), are common supple-ments for beef cattle and other ruminants, which contain lipid and protein. Both PKM and CM are by-products of oil industries, which is high in cell-wall constituents and considered as an energy or protein source for ruminants (Devendra, 1988). These feedstuffs have been
widely used for ruminant feeding systems in Malaysia (Devendra, 1988), Thailand and Indonesia (Setthapukdee et al., 1991) and in India (Lakshmi and Krisna, 1995). The main limitation of either PKM or CM as a livestock feed has been attributed to their high content of oil which may have negative effect to microbial activities in the rumen (Moore et al., 1986; McLennan et al., 1998). In fact, there is little informa-tion on the effect of PKM and CM on microbial protein production in the rumen of beef cattle fed low quality forage. This study was addressed to examine the effect of increasing either PKM or CM intake on microbial pro-tein production and its efficiency in the rumen of steers received low quality forage.
Materials And Methods
Treatments and Feeding
Ten Brahman crossbred steers approximately 2436.5 (SE) kg in initial weight and 15 months of age were allocated to two feed type treatment groups (PKM and CM) by stratified randomization on the basis of unfasten live weight. The experi-mental design was 2 incomplete 5x5 Latin Squares, one with each feed type (PKM and CM). Within each feed
type there were five levels of supple-ment feeding equivalent to 0, 0.25, 0.50, 0.75 and 1.0 % body weight per day (W/d). The basal diet was Green panic hay, which was given ad libitum. The studies involved 3 runs, with one replicate (steer) per treatment level per run. Thus there were 3 replications of each level of feeding for each feed type overall (3 steers). After each run, steers were randomly allocated to a different level of feeding but steers were kept on the same supplement type. In each run, the steers were fed their diet in individual pens over a 14 d preliminary period and then transferred to individual metabolism crates for 7 d collection period. The steers were weighed at the beginning of the preliminary and collection period to adjust the supplement allocation. Supplements offered were fed based on dry matter content.
The hay was given twice a day in separate portions, which were fed at 0800 h and 1200 h. The amount of hay offered each day was set at 10-15% more than that consumed by the steer on the previous day. The supple-ments were given once daily at 0730 h and fed separately to the basal diet. Fresh drinking water was freely available at all times.
Table 1. Chemical Composition of Feed Ingredients Used in the Experiment
Component Green Panic Hay
Palm Kernel
Meal Copra Meal
Organic matter (%) 91.4 96.8 94.0
Crude protein (%) 5.7 17.1 24.2
Neutral detergent fibre (%) 71.0 67.4 54.9
Ether extract (%) 1.5 10.3 7.3
M
Meeaassuurreemmeennttss
Urine sampling for predicting microbial protein production
For predicting microbial protein production, the urine output of indivi-dual steers was measured per day by total collection into trays covered with a filter. The pH of the urine was maintained below 3.0 by adding 10% H2SO4 into individual trays at the start
of each daily collection. The urine collected over a 24 h period for each steer was mixed and a 5% aliquot was taken and bulked over the collection period into a plastic container stored in a refrigerator. At the end of each collection period, a 5 mL sub-sample was taken from the bulked samples from each steer, diluted to 50 mL with ammonium phosphate stock buffer and frozen awaiting purine derivative (PD) analysis. The concentration of PD in sub-samples of the urine was determined using High Performance Liquid Chromatography (HPLC) procedures (Bolam, 1998)
The exogenous purine supply (X, mmol/day) attributable to the micro-bial population of the rumen was estimated as the total purine excretion (Y, mmol/d) less the endogenous contribution to this total, divided by a recovery factor. Bowen (2003) suggested an endogenous purine contribution of 0.190 mmol/kg W0.75 for Bos indicus cattle and a recovery coefficient of 0.85 for absorbed purines. The calculation thus becomes:
Y = 0.85 X + 0.190 W0.75.
The value of X (endogenous purine supply) was then used in determining estimated microbial nitrogen pro-duction (EMNP, g/d) through the following equation :
EMNP = (70X)/(0.83 x 0.116 x 1000)
where 0.83 is the assumed digestibility of the microbial protein and 0.116 represents the ratio of purine nitrogen to total microbial nitrogen (Chen et al., 1992). A factor of 6.25 is applied to convert the EMNP to a microbial crude protein (MCP) production (g/d).
pH and Rumen Ammonia-Nitrogen Concentration in the Rumen Fluid
Rumen fluid samples were taken 3 h after supplement feeding on day 7 of the collection period and then again just before feeding on the next day (24 h after feeding), by inserting a plastic tube down the esophagus and into the rumen and with rawing a sample using a vacuum pump. Ruminal pH was measured on fresh fluid immediately after sampling and a sub-sample (20 mL) of rumen fluid for chemical analysis was drawn immediately into 2 tubes (10 mL capacity), each
Feed samples, refusals and faeces were analyzed for dry matter (DM) and organic matter (OM) according to procedure of AOAC (1984) after ground (1 mm screen). The determi-nation of nitrogen was done by using an automatic total nitrogen analyzer (LECO FP-428). Neutral detergent fiber was determined by procedures of Goering and Van Soest (1970). The ether extract content of the hay and supplements was analyzed using a solvent extraction unit (Soxtec HT6, Tecator, Sweden). The concentration of NH3-N in the rumen fluid was
measured by a distillation method using a Buchi 321 distillation unit and an automatic titrator. The reagents were 2% boric acid (H3BO3) solution,
a saturated sodium tetraborate solution (>260 g/L), 0.01M HCL (normality 0.0095) and 25 mL of the boric acid solution.
Statistical Analysis
The effects of supplementation were tested and described by fitting general linear models with pen, run, and supplement level as terms using Genstat 6th edition program (Lawes Agricultural Trust, 2002). The difference between control treatment from PKM and CM groups within which represented six control steers from two treatment groups.
Results And Discussion
Microbial Protein Production
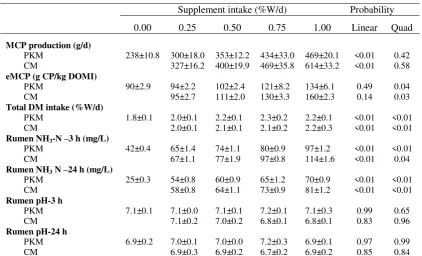
The MCP production and eMCP in the rumen in response to different levels of PKM or CM supplementation are presented in Table 2. The obvious effects of increasing levels of PKM or CM supplementation were to linearly increase the MCP production. How-ever, increasing intake of both PKM and CM affected quadratically (P<0.05) the eMCP in the rumen.
The MCP and eMCP were low for the control steers and increased as the proportion of supplements in the ration increased. The low eMCP of the six control steers (90 g MCP/kg digestible organic matter (DOM)) in this experiment is in agreement with previous studies (Bolam, 1998 and Mullik, 1999). In the study of Mullik (1999) on steers fed Pangola grass hay (CP=8.5 %) ad libitum, the eMCP was 77 g MCP/kg DOM. These low values
are primarily related to rumen deg-radable protein (RDP) supply where the crude protein (CP)/DOM of the Green panic was 112 g CP/kg DOM. The low availability of RDP, soluble carbohydrate and dilution rate, all contribute to this low eMCP (Leng, 1990). However, with increased intake of either PKM or CM in the current study, MCP production showed a linear response to both supplement types. Furthermore, eMCP responded quadratically to increasing intake of both supplements. Interestingly, at the higher level of CM intake (0.68 to 1.0 %W/d), the value of eMCP reached the range level suggested in the current feeding standards (AFRC, 1992; NRC, 2000) of 130 – 170 g MCP/kg DOM. There appears to be no literature using similar supplements to compare these values. Enhanced MCP production and eMCP due to the supplementation of PKM or CM is probably due to an increase in RDP supply reflected in a higher rumen NH3-N concentration (Table 2), and
readily fermentable energy as seen in higher DM intake (Table 2).
Rumen Parameters
Rumen NH3-N concentrations were increased by both PKM and CM supplementation as shown in Table 2. concentrations observed in the current experiment with increasing PKM or CM supplementation agrees with other research (Ehrlich et al., 1990) and reflects the high protein degradation in the rumen.
Table 2. Effect of Feeding Palm Kernel Meal (PKM) and Copra Meal (CM) on the Microbial Protein Production (MCP), the Efficiency of MCP Production (eMCP), Total Dry Matter (DM) Intake, Rumen Parameters of Steers Received Low Quality Forage.
Supplement intake (%W/d) Probability 0.00 0.25 0.50 0.75 1.00 Linear Quad
MCP production (g/d)
PKM 238±10.8 300±18.0 353±12.2 434±33.0 469±20.1 <0.01 0.42
CM 327±16.2 400±19.9 469±35.8 614±33.2 <0.01 0.58
eMCP (g CP/kg DOMI)
PKM 90±2.9 94±2.2 102±2.4 121±8.2 134±6.1 0.49 0.04
CM 95±2.7 111±2.0 130±3.3 160±2.3 0.14 0.03
Total DM intake (%W/d)
PKM 1.8±0.1 2.0±0.1 2.2±0.1 2.3±0.2 2.2±0.1 <0.01 <0.01
CM 2.0±0.1 2.1±0.1 2.1±0.2 2.2±0.3 <0.01 <0.01
Rumen NH3-N –3 h (mg/L)
PKM 42±0.4 65±1.4 74±1.1 80±0.9 97±1.2 <0.01 <0.01
CM 67±1.1 77±1.9 97±0.8 114±1.6 <0.01 0.04
Rumen NH3 N –24 h (mg/L)
PKM 25±0.3 54±0.8 60±0.9 65±1.2 70±0.9 <0.01 <0.01
CM 58±0.8 64±1.1 73±0.9 81±1.2 <0.01 <0.01
Rumen pH-3 h
PKM 7.1±0.1 7.1±0.0 7.1±0.1 7.2±0.1 7.1±0.3 0.99 0.65
CM 7.1±0.2 7.0±0.2 6.8±0.1 6.8±0.1 0.83 0.96
Rumen pH-24 h
PKM 6.9±0.2 7.0±0.1 7.0±0.0 7.2±0.3 6.9±0.1 0.97 0.99
CM 6.9±0.3 6.9±0.2 6.7±0.2 6.9±0.2 0.85 0.84
The ruminal NH3-N
concen-tration without supplementation was low (42 and 25 mg/L, at 3 and 24 h after feeding, respectively) and below the minimal accepted level of 50 mg/L (Satter and Slyter, 1974). Although the level of NH3-N concentration in
the rumen increased with increasing level of supplements, the value is considered to be lower than the value recommended by Perdok and Leng (1990) (at least 100 mg NH3-N/L) to
promote higher digestion of fiber in the rumen. The high lipid concentration in the supplements might inhibit access to the site and degradation of protein.
With respect to rumen pH, no significant difference due to diets was observed. The overall mean values for pH in rumen fluid at 3 h after feeding was 7.1 0.1 for PKM supplemented group.
And 6.9 0.2 for CM supplemented group. Earlier studies (Stewart, 1977, Russell and Dom-browski, 1980) demonstrated that when ruminal pH is above 6.0, cellulolytic enzymes and cellulolytic bacteria are not inhibited. The range of pH across treatments and sampling times in the current study was 6.6 to 7.2, indicating that pH should not have affected microbial activities in the rumen.
Conclusions
The MCP production and eMCP in the rumen of steers fed low quality forage was enhanced by supple-mentation of either PKM or CM up to the level of 1.0 % W/d which were resulted from the higher concentration of rumen NH3-N.
References
AFRC. 1992. Nutritive requirements of ruminants: protein. Nutr. Abst. Rev.62:787-835.
AOAC. 1984. Official Methods of analysis, Centennial Edition. Association of Official Analy-tical Chemist, Washington, DC.
Bolam, M. J. 1998. Manipulation of The Supply of Protein and Energy to Ruminants Consum-ing Tropical Forages Through Supplementation Strategies. PhD Thesis. University of Queensland.
Bowen, M.K. 2003. Efficiency of Microbial Crude Protein Pro-duction inCcattle Grazing Tropical Pasture. PhD Thesis. University of Queensland.
Chen, X.B., Chen, Y.K., Franklin, M.F., Orskov, E.R. and Shard, W.J. 1992. The effect of feed intake and body weight on purine derivatives excretion and microbial protein supply in sheep. J. Anim. Sci. 27 :1709-1715.
Devendra, C. 1988. Utilisation of Feeding Stuffs from The Oil Palm. In: Proc Feeding Stuffs for Livestock in South East Asia. FAO/APHCA Publi-cation No.7 FAO Regional officer for Asia and the Pacific, Bangkok. pp.39-49.
Ehrlich, W.K., Upton, P.C., Cowan, R.T. and Moss, R.J. 1990. Copra meal as a supplement for grazing dairy cows. Proc.
Aust. Soc. Anim. Prod.
18:196-199.
Goering, H. K and Van Soest, P.J. 1970. Forage fiber analyses (apparatus, reagents, proce-dures and some applications).
Lakshmi, V.P. and Krishna, N. 1995. Evaluation of complete rations containing varying levels of palm kernel-cake as a repla-cement for groundnut-cake in sheep. Indian J. Anim. Sci. 65: 1161-1164.
Lawes Agricultural Trust, 2002. Genstat 6th Edition for Windows. Version 6.1. Nu-merical Algorithms Group. Oxford.
Leng, R.A. 1990. Factors affecting the utilisation of poor quality forages by ruminants parti-cularly under tropical conditions. Nutr. Res. Rev.
3:277-303.
McLennan S.R., Plasto, A.W., Doogan, V.J. and Dillon, R.D. 1998. Whole cottonseed and cottonseed meal supplements for cattle given a hay-based diet. Proc. Aust. Soc. Anim. Prod. 22:111-114.
Moore, J.A., Swingle, R.S. and Hale, W.H., 1986. Effect of whole cottonseed, cottonseed oil or animal fat on digestibility of wheat straw diets by steers J. Anim. Sci. 63:1267-1273.
Mullik, M.L. 1999. Strategies to increase efficiency of rumen microbial protein synthesis and productivity of cattle on a
tropical grass pasture. PhD Thesis. University of Queensland.
NRC. 2000. Nutrient Requirements of Beef Cattle. 7th revised edition, National Academy Press. Washington, D.C
Orskov, E.R. 1999. Supplement strategies for ruminants and management of feeding to maximize utilization of roughages. Prev. Vet. Med.
38:179-185.
Perdok, H.B. and Leng, R.A. 1990. Effect of supplementation with protein meal on the growth of cattle given a basal diet of untreated or ammoniated rice straw. Asian-Aust. J. Anim. Sci. 3:369-279.
Russell, J.B. and Dombrowski, D.B., 1980. Effect of pH on the
efficiency of growth by pure cultures of rumen bacteria on continuous culture. Appl. Environ. Microbial. 39:604.
Satter, L.D. and Slyter, L.L. 1974. Effect of ammonia concen-tration on rumen microbial protein production in vitro. Br. J. Nutr. 32:199-208.
Setthapukdee, C., Jalaludin, S. and Mahyuddin, M. 1991. Effect of supplementing grass and urea on the performance and carcass characteristics of lambs fed palm kernel cake-based diet. Proc. 3rd Int. Symp. Nutr. Herb. Penang, Malaysia. p.100.
Stewart, C.S. 1977. Factors affecting the cellulolytic activity of rumen contents. Appl. En-viron. Microbial. 33:497-502.
Alamat Korespondensi: Ir. Marsetyo, M.Sc.Ag. PhD
Jurusan Peternakan, Fakultas Pertanian, Universitas Tadulako, Palu Sulawesi Tengah.
Artikel diterima : 23 Mei 2005 , disetujui: 27 Mei 2006.