Multi-agent Simulation of Alternative Scenarios of Collaborative
Forest Management
Herry Purnomo1
Center for International Forestry Research and Bogor Agricultural University P.O. Box 6596 JKPWB, Jakarta 10065, Indonesia
Yurdi Yasmi, Ravi Prabhu, Linda Yuliani, Hari Priyadi Center for International Forestry Research, Bogor, Indonesia
Jerome K. Vanclay
Southern Cross University, PO Box 157, Lismore NSW 2480 Australia
International calls for sustainable development advocate that forest management should be carried out in a multi-stakeholder environment. The importance of community participation is acknowledged in the Indonesian Act No. 41 on Forestry (1999). However, it is not clear how to achieve this in areas already allocated to a concession holder. Current regulations offer little flexibility for concessionaires to develop site-specific management, or to involve local communities in forest management. The research reported here examines the application of simulation techniques to explore scenarios of sustainable forest management addressing those limitations. Several scenarios have been developed using multi-agent simulation to examine social and biophysical issues. Of the four scenarios examined in this study, collaborative forest management involving both the concessionaire and the local community appears to offer the most promising pathway toward sustainability.
Keywords: multiple stakeholders, collaborative forest management, multi-agent simulation, CORMAS, Kalimantan, Indonesia
INTRODUCTION
Principle 22 of the Rio Declaration on Environment and Development (1992) highlights the importance of indigenous people and their participation in sustainable development. In forestry, this applies to local communities living in or near concession areas. Ten years after Rio, it remains a challenge to identify the new
1
The authors wish to acknowledge that this paper has been produced with financial support from Department for International Development of the UK, and the Asian Development Bank under RETA Grant 5812 and CIFOR. The views expressed here are those of the authors and can in no way be taken to reflect the official opinion of the donors or of CIFOR. The authors also thank Bruce Campbell for his inputs to the paper.
roles of communities and enhance their participation in forest management. Carew-Reid et al. (1994) listed several strategies for sustainable development at national level, illustrating 10 lessons for success, and emphasizing the need for participation.
The Biodiversity Action Plan of Indonesia (BAPPENAS 1993) underscores the importance of community participation in both in-situ and ex-situ conservation. It offers several suggestions to stimulate participation of local people in forest management. These include creating income-generating opportunities, providing clear roles in management and planning, and collaborating to document traditional knowledge. The Indonesian Act 41 about Forestry (1999) stresses the role of community participation in forest management and their rights to monitor the implementation of forest management. Local communities should enjoy benefits from the existing forest around them. However, the best way to implement this Act in the field remains unclear.
The impact of any policy initiative (such as collaboration between stakeholders in managing a complex forest) may take many years to be manifested and frequently becomes evident beyond the period of research and monitoring. What can be done to ensure that collaborative arrangements provide better outcomes for forests and the people dependent on them?
Simulation is one way to address this question, and may be the only viable methodology if the system is large or complex. ‘Simulation’ means making a simplified representation of a real-world situation, and animating it so that predictions of a future situation can be made. It enables objective predictions to be made and the likely impacts of various options to be explored. This paper is one of a series (Vanclay et al. 2003) seeking to explore appropriate ways to examine natural resource and environmental management issues in forest dependent communities (cf. Vanclay 2003, Purnomo et al. 2003).
Multi-agent simulation (MAS) is a promising way to examine such issues (Bousquet et al. 1999). The hallmark of MAS is the recognition of ‘agents’, which are entities with defined goals, actions and domain knowledge, collectively known as their ‘behaviour’ (Stone and Veloso 1997). Some degree of agent autonomy is central to the notion of agent-based modelling (Weiss 1999). These interactions can be cooperative or selfish, with agents sharing a common goal or pursuing their own interests (Sycara 2000). Agents are entities within an environment, which they can sense, modify and move through (Flores-Mendez et al. 1999). Their ability to sense their surrounds means that they need not act as isolated entities, but can communicate and collaborate with other entities.
The complexity of the social and ecological systems under study required some generalizations, including the assumption that issues not represented in the model would remain constant throughout the simulation and across scenarios. The impact of these assumptions is mitigated by the recognition that the focus of this research has not been to predict the future, but to compare alternative scenarios. It is anticipated that the model could help decision-makers establish forest management practices that are more sustainable and more equitable than current practices.
STUDY AREA AND METHODS
The study was conducted within a forest management unit (FMU) of PT Inhutani II located at 116º28’ E, 3º14’ N, in Malinau District, East Kalimantan (Indonesian Borneo). The area was allocated to the State-owned logging company PT Inhutani II by the Government of Indonesia on 30 January 1991 through Forestry Ministerial Decree no. 64/KPTS-II/91. Previously the area had been allocated to PT Inhutani I and was co-managed with Inhutani II.
The Long-term Forest Utilization Plan (1996) identifies a Limited Production Zone with primary forest (14,180 ha), and 34,120 ha zoned as Production Forest (23,890 ha virgin, 7280 ha logged-over, 2920 ha shrubs fields and shifting cultivation and 30 ha housing). According to the plan, Inhutani II may continue to log as much as 1106 ha per year in 11 blocks each of about 100 ha, using a silvicultural system known as the Indonesian Selective Cutting and Planting System (TPTI). Commercial species found in the area include Shorea spp. (Meranti),
Dryobalanops spp. (Kapur), Dipterocarpus spp. (Keruing), Shorea laevis
(Bangkirai), Palaquium spp. (Nyatoh), Gonistylus spp (Ramin) and Agathis spp. (Agathis).
Stakeholders were identified according to the following criteria: proximity to the forest, legal or traditional rights within the forest, dependency on the forest, knowledge of forest management (indigenous or modern), and cultural links or forestry ‘spirit’ (Colfer et al. 1999a). Stakeholder characteristics were identified through field visits and discussions within a series of focus groups each comprising 6 - 10 persons (Bernard 1994). Researchers facilitated these discussions to establish stakeholder identities, their basis for reasoning, and their behaviour and actions. These characteristics formed the basis for the MAS model subsequently developed. Other related data were obtained from District Malinau, the concession holder and from related literature.
Key phases in the development of the model (Grant et al. 1997) are:
1. Forming a conceptual model: stating the model objectives, bounding the system of interest, categorizing its components, identifying relationships, and describing the expected patterns of model behaviour.
2. Quantifying the model: identifying the functional forms of model equations, estimating parameters, representing it in CORMAS and conducting baseline simulations.
4. Using the model: developing scenarios, testing hypotheses and communicating results.
Nonparametric tests were used to evaluate the model to avoid any assumption about the distribution the simulated outcomes. Several tests involved the non-parametric sign test, which performs a one-sample sign test of the median. Because MAS involves stochastic simulations, the baseline consists of a set of replicate simulations. The number of simulations needed to detect a given true difference between sample means, given an estimate of variability within samples, can be estimated as (Sokal and Rolf 1995):
n≥ 2 (σ/δ)2 [tα,γ + t2(1-P),γ]2 (1)
where n is the number of samples; σ is the true standard deviation, estimated from the estimated variance within samples; δ is the difference to be detected; γ is the degrees of freedom associated with b groups and n samples per group so γ = b (n-1);
α is the significance level; P is the probability of correctly denoting a difference as small as δ; and tα,γ and t2(1-P),γare the two-tailed values of student-t.
MODEL DESIGN AND CONSTRUCTION
It is instructive to examine three issues impinging on the efficacy and utility of the resulting model: identifying the agents and issues to be represented in the model; designing the model consistent with the real world; and evaluating the model to satisfy users of its utility.
Identifying Stakeholders
Eight groups of stakeholders were identified in this research: Inhutani II; the Long Seturan, Long Loreh, and Langap communities; the Central and Local Governments; NGOs; and Coal Miners. An analysis of ‘Who counts’ (Table 1; Colfer et al. 1999b) revealed that the principal players are the company (Inhutani II) and the local communities. Scores ranged between one and five (1 = key player, 5 = marginal), with totals for the seven dimensions in the range 11-23 (of a possible range of 7-35; Table 1). Stakeholders with the lowest six scores were included in the present study. NGOs were excluded because they were not considered key players in any area under consideration, and coal miners were not considered because of inadequate data relating to coal deposits in the study area.
The ‘Who Counts’ matrix (Table 1) provided the basis for identifying three classes of agent in the MAS: local communities (Long Seturan, Long Loreh and Langap), governments (local and central) and a timber company (Inhutani II). These categories also represent the primary actors in the forest area: local communities depend on forest for a range of goods and services on a day-to-day basis; the governments regulate and monitor the use of the forest; and the timber company manages the forest to meet commercial goals.
Miners have opened a small area of forest to mine coal. The mine has influenced the economy of the local communities, by creating a small market for the local products and providing menial jobs for local people, but the miners are not involved in the management of the forest.
Table 1. Identifying stakeholders using the ‘Who Counts’ matrix
Stakeholder or community
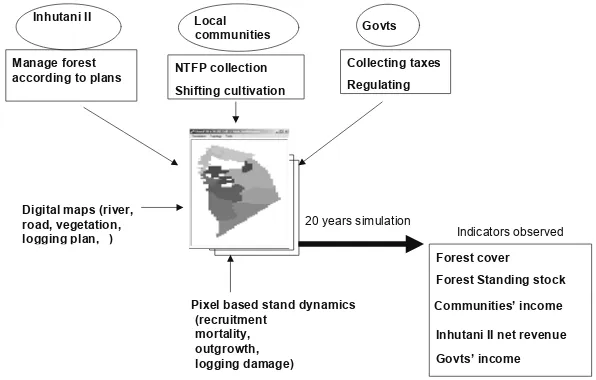
The conceptual model is illustrated in Figure 1. It shows the three classes of actors (ovals) and their goals (rectangles), the pixel-based representation of the landscape, and a summary of the outputs to be monitored as indicators of sustainability.
Inhutani II Local
communities Govts
Manage forest
according to plans NTFP collection Shifting cultivation
The model is constructed so that a simulation proceeds as follows: Inhutani II harvests timber according to approved plans. Local and Central governments approve these plans, regulate logging, and collect taxes from Inhutani II. Local communities collect NTFPs (non-timber forest products) such as rattan and eagle wood, hunt and fish, and practice shifting cultivation. Indicators used to observe the outcomes of simulations included forest cover, standing volumes, communal incomes, net revenue of Inhutani II, and taxes collected by the governments. Topology is important in land use, so forest management units were represented as pixels, with explicit pixel-based denotation of rivers, roads, vegetation and logging plans (Figure 1). Each pixel represents an area of about 35 ha.
The growth of the forest in each pixel was simulated using stand class projection (for details of this approach, see e.g. Vanclay 1994). Data for recruitment, upgrowth and mortality were derived from permanent sample plots in the study area (Septiana 2000; Table 2). Operational inventory data (Table 3) were used to initiate the model with stocking estimates for the original forest stand before logging. The TPTI approach is implemented as a diameter limit with trees over 50 (production forest) or 60 cm dbh (limited production forest) being harvested. However, not all trees above those diameter limits are removed because some trees are not profitable to cut (e.g. trees that are hollow, buttressed or inaccessible). Commercial logging by Inhutani II removes about 80% of the trees (Sist et al. 2003) and causes considerable damage to residual stands. In contrast, traditional (manual) logging is much more selective (1-2 trees/ha or about 10%), and causes little damage to the residual stand (Table 2).
Table 2. Stand dynamics (Septiana 2000) and harvesting impacts
Size class (cm dbh) (lower limit of class) Component
Table 3. Stocking (trees/ha) of forest prior to harvesting
Figure 2 illustrates the interactions between agents as a sequence diagram. The central government calls for a proposal to manage an area and improve the well being of local communities surrounding that area. Inhutani II sends a proposal that comprises a management plan. The central government evaluates the plan and explicitly gives approval or disapproval (noted with ‘xor’, cf. common usage of ‘or’ which implies either or both). Then, the central government informs other agents about this approval. Inhutani logs the area according its plan, and generates income. Inhutani II pays taxes to central and local governments.
Government Local Community
Central Local
Inhutani II
Seturan Loreh Langap
Call for proposal
Propose Reject xor
accept Inform
Pay taxes Call for collaborative proposal
Propose Propose Propose Reject xor
accept proposal Inform intent
Pay fee Pay fee Pay fee Pay taxes
Pay taxes Pay taxes
Figure 2. Sequence diagram of agent interactions
Inhutani II calls for proposals for collaboration. Communities in Seturan, Loreh and Langap, may send a proposal. Traditionally these local communities cultivate rice fields and collect non-timber forest products (NTFPs). They extend their rice fields annually to accommodate any population growth or increased needs. It is assumed that if Inhutani II accepts their proposal, they will collaborate in forest management rather than extending their rice fields. Participating communities pay fees to Inhutani II and taxes to central and local governments.
issues. The local communities are represented as belief-desire-intent (BDI) agents as defined by the following pseudo-code:
function community_action(Perception) : Action begin
Belief := revise (Belief, Perception) Desire := options (Belief)
Intent := filter (Belief, Desire) return execute (Intent)
end function community_action
where Perception is an input. Table 4 shows the practical implications of this BDI agent. When the proposal is accepted it complies with the belief, ‘wanting to co-operate’ with other stakeholders. To improve welfare stakeholders ‘collaborate in forest management’, which means they will be able to log agreed areas. If their proposal is rejected, then their belief is changed, they continue cultivating rice and collecting NTFPs, and their desire to co-operate decreases. If their proposal is rejected more than twice, their beliefs will be changed, and they may not believe in collaboration, and may no longer submit proposals to Inhutani II.
Table 4. Practical implications of the BDI agent for local communities
Perception Belief := revise (Belief,
Note: a Dependent upon available land and suitable forest.
area proposed for collaboration may differ from year to year. Local communities may open new rice fields to support their needs. They typically choose a flat area, close to the existing rice field and villages. These things being equal, the simulation makes a random choice of pixel for rice cultivation.
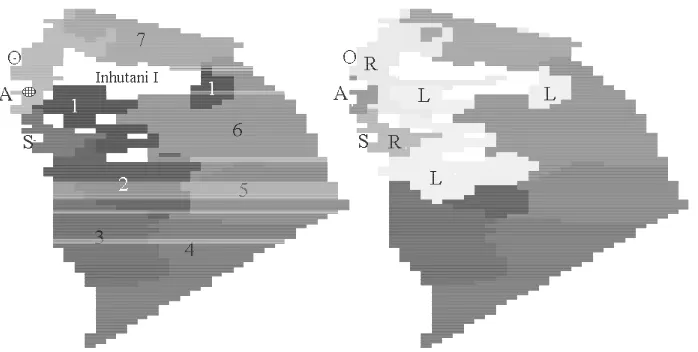
A comparison of predicted versus actual forest cover was used as a basis to evaluate the model. The model was run for the period 1991 to 2000. The initial (1990-91) map of the FMU area (Figure 3) shows the location of rice fields, the Inhutani II log pond (i.e. main log stockpile for export from the concession) and cutting blocks. Table 5 reports the initial forest cover in 1991, the 1998 forest cover estimated from Landsat images, and the results of the 8-year simulation (also shown in Figure 3). There are substantial discrepancies, in part because of substantial changes in the political arena and in forest management during the study period.
Table 5. Forest cover in the study area in 1991, in 1998, and in simulated results
Cover Actual 1991
area (ha)a
Relative 1991 area
Actual 1998 area (ha)b
Simulated 1998 area (ha)
Virgin forest 38,195 79 % 17,900 33,991
Logged over area 5,529 11 % 15,100 9,679
Non-forest
(rice, houses, karst) 4,246 9 % 3,500 4,629
No data (cloud) 330 1 % 11,800 —
Total 48,300 100 % 48,300 48,300
Source: a Aerial photograph interpretation in Inhutani II Long Term Plan. b Inhutani II Annual Plan for 1999.
Figure 3. Map of study area in 1991 (left), and after eight years of simulation (right)
Evaluating the Model
The use of MAS for research involves developing and testing of theories. Adequate testing relies on the comparison of observed and simulated outcomes as well as careful consideration of the logic and behaviour of the model. The dynamic responses implicit in many natural resource management questions add to the challenges of interpretation and testing (Barreteau et al. 2001).
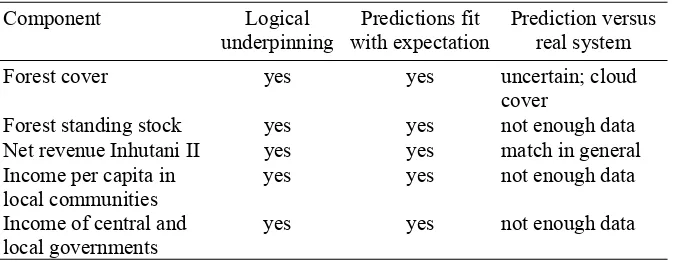
Several researchers (e.g. Vanclay 1994, Grant et al. 1997, Vanclay and Skovsgaard 1997) have advocated the terminology ‘model evaluation’ instead of ‘model validation’. This emphasizes relative utility: a model that is useful for one purpose might be misleading for other purposes. The present model was evaluated using three criteria: the logic of the model and its outcomes; the agreement between predictions and expectations; and a comparison of predictions with the real system. This evaluation was hampered by a lack of data, but preliminary findings are reported in Table 6.
Table 6. Overall model evaluation using three criteria
Component Logical underpinning
Predictions fit with expectation
Prediction versus real system
Forest cover yes yes uncertain; cloud
cover
Forest standing stock yes yes not enough data Net revenue Inhutani II yes yes match in general Income per capita in
local communities
yes yes not enough data
Income of central and local governments
yes yes not enough data
The assessment that the model was reasonable was based on systematic scrutiny of all the relationships within the model, from the simplest sub-model (forest stand increment), to the more complex sub-models (e.g. the interrelationship between stand increment and communal logging). Finally, the overall model performance was assessed. This assessment led to the conclusion that the model complied sufficiently with the basic principles of ecology and economics, to provide a basis for discussion of alternative courses of action.
The MAS model did not account for illegal logging (which has a strong influence on sustainability) because it was not intended to represent the whole system. The focus of the model was to provide a basis for discussion, rather than on predicting the future. Thus quantitative comparisons are of limited utility. The usefulness of a model does not arise solely from its numerical precision, but also from its ability to enable exploration of the assumptions made by human stakeholders (and model-builders). It is not always necessary to ‘prove’ that projected outcomes actually will take place, but they do need to be plausible, that is possible, credible and relevant (Fahey and Randall 1998).
LEARNING FROM THE MODEL
This section examines some of the insights gained from the process of constructing the model and examining its outputs. Simulation outputs from the model are also used to test the hypothesis that co-management leads to better forest management.
Developing Scenarios of Collaborative Forest Management
Two stages are involved in testing the hypothesis about the current forest management system and collaborative management. First, a scenario of collaborative management was developed using the model. Secondly, simulation outputs from the current system and the developed scenario were compared.
Collaborative forest management is defined as a share in the production of timber. Shared production can only happen if there is an agreement between PT Inhutani II Sub Unit Malinau and the communities, which is approved by both local and central governments. Collaborative management is considered success if the cost of collaboration is less than the benefits gained. The simulation assumes that collaboration will occur if agents (stakeholders) benefit in achieving their goals.
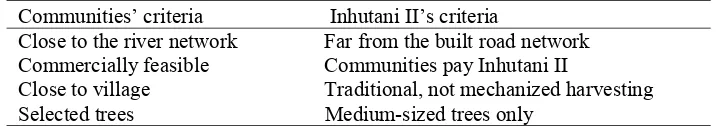
Bounded rational economic behaviour was observed to be the primary characteristic for collaboration. Agents collaborate if it is economically profitable to do so, and is supported, or at least not prohibited, by their belief system. In the simulation each agent does two things: execute what one usually does to achieve one’s goals; and communicate with other agents to find ways to enhance achievements. Table 7 lists criteria for selecting an area of collaboration according to the perspective of each agent. Those agents implement these criteria in selecting areas of collaboration. Simulations were executed for 20 years to observe the effect of management scenarios for the duration of the concession.
Table 7. Criteria for collaborative timber harvesting from the perspective of two parties
Communities’ criteria Inhutani II’s criteria
Close to the river network Far from the built road network Commercially feasible Communities pay Inhutani II
Close to village Traditional, not mechanized harvesting Selected trees Medium-sized trees only
Source: Field interview.
Testing the Hypothesis about Collaboration
The hypothesis, ‘co-management of forests by all relevant stakeholders provides better outcomes’ is formulated formally as:
H0: mc = m0
H1: mc ≠ m0
where ‘mc’ is the median of simulated collaborative management indicators, while
management. Those indicators are logged over area, virgin forest, rice field area, standing stock, communities’ income, the concession revenue and taxes.
To test the hypothesis, severalscenarios of collaboration were formulated. Table 8 lists the different scenarios based on stakeholder inputs. In all the collaboration scenarios – i.e. scenarios A, B and C – local communities gained rights to log forests that currently allocated to Inhutani II. These areas were negotiated between the local communities and Inhutani II, based on criteria listed in Table 7. The local communities were restricted to ‘traditional’ logging. In scenario A, no fees were paid to Inhutani II or to governments. In scenario B, the local communities paid fees to Inhutani II amounting to 20% of their net revenue. Under scenario B communities paid less tax to the local governments, and the same amount of taxes to the central government, than under scenario C. Under Indonesian law, local governments have more flexibility to determine the amount of taxes than central government.
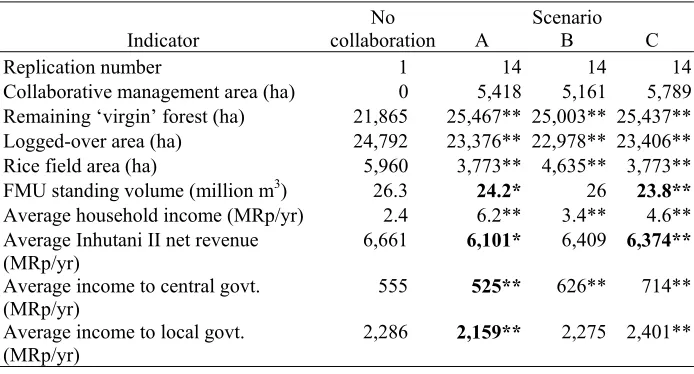
Simulation runs of the collaborative management scenario were replicated several times with different random number streams. The appropriate number of replications was determined from Equation 1, which confirmed that the initial guess of n = 14 (suggested by Grant et al. 1997) was sufficient for all scenarios. Table 9 reports the average of simulation outputs of the various scenarios.
Table 8. Scenarios examined with simulation studies
Issue Scenario A Scenario B Scenario C
Location and area available Nature of logging permitted Fees to PT Inhutani II Taxes to Local Government Taxes to Central Government
Negotiated
Table 9. Simulation outputs for non-collaboration and collaboration scenarios
Scenario Indicator
No
collaboration A B C
Replication number 1 14 14 14
Collaborative management area (ha) 0 5,418 5,161 5,789 Remaining ‘virgin’ forest (ha) 21,865 25,467** 25,003** 25,437** Logged-over area (ha) 24,792 23,376** 22,978** 23,406** Rice field area (ha) 5,960 3,773** 4,635** 3,773** FMU standing volume (million m3) 26.3 24.2* 26 23.8**
Average household income (MRp/yr) 2.4 6.2** 3.4** 4.6** Average Inhutani II net revenue
(MRp/yr)
6,661 6,101* 6,409 6,374**
Average income to central govt. (MRp/yr)
555 525** 626** 714**
Average income to local govt. (MRp/yr)
2,286 2,159** 2,275 2,401**
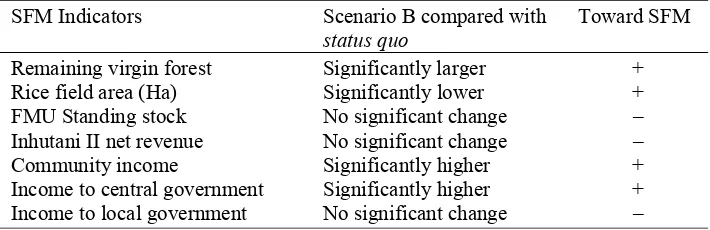
Selected indicators (Tables 9 and 10) provided the basis to assess the sustainability of forest management (SFM) and to test the hypothesis that collaboration leads to better outcomes. From the perspective of forest management, sustainability is more likely if scenario B is implemented.
Table 10 contrasts Scenario B with the current situation and Figure 4 illustrates maps corresponding to three of the 14 replicationsused to assess Scenario B. These three examples have been chosen to illustrate the range of outcomes arising from stochastic simulation, and represent two extremes and a typical outcome. Although the spatial details vary greatly, there is a close correspondence in the overall areas used for the monitored activities. Scenario B provides the best outcome for most indicators, and does not erode standing volumes, Inhutani II net revenue or the income of the local government. Thus the hypothesis (co-management of forests by all relevant stakeholders provides better outcomes) was accepted. It also implies that collaboration between stakeholders should be encouraged, as it should lead to better outcomes from forest management.
Table 10. SFM indicators of Scenario B of collaborative management
SFM Indicators Scenario B compared with
status quo
Toward SFM
Remaining virgin forest Significantly larger +
Rice field area (Ha) Significantly lower +
FMU Standing stock No significant change –
Inhutani II net revenue No significant change –
Community income Significantly higher +
Income to central government Significantly higher + Income to local government No significant change –
Figure 4 illustrates how the spatial pattern of negotiated arrangements may vary according to the random numbers used. However, some consistent trends emerge. The three local communities continue to extend their rice cultivation in the vicinity of their villages. They propose areas of collaboration close to their villages and rivers, and are commercially feasible. Inhutani II favours community use of areas with low timber yields and far from the road network. Thus there is scope to find outcomes that minimize conflict between these differing objectives.
DISCUSSION
Figure 4. Three of the 14 outcomes generated for the collaboration scenario B
Note: Dark grey represents areas under collaborative management, grey represents unlogged forest, and light grey represents logged forest and rice field areas
Harvesting techniques used by local communities appear critical to the sustainability of the forest. Typically, communities harvest only about 10 % of commercial trees, providing favourable conditions for regeneration and time for regrowth.
Most timber logging companies have secured a legal right to harvest from Indonesian production forests, have invested in the areas in the expectation of a commercial timber harvest, and are reluctant to forego this right. However, changing policies and laws create incentives for policy-makers to foster new arrangements of better forest management. Simulations have shown that collaboration between logging companies and local communities can lead to mutually satisfactory (win-win) outcomes. However, care is required to ensure that the specific arrangements regarding this collaboration are fair with respect to rights, returns and relations. Inappropriate arrangements can make some stakeholders better off and others worse-off. Finding a suitable arrangement to showcase such collaboration is challenging. Such an arrangement should draw on the comparative advantages of each stakeholder, drawing on the knowledge, techniques, experience and capital of the logging company and the local community to manage the forest sustainably. Local communities have a deep understanding of the forest as well as a spiritual relationship to forest than can be useful to protect the forest from illegal activities not covered in the collaboration scheme.
Effective communication between stakeholders is an important prerequisite for collaboration. Stakeholders have to compare benefits and costs of collaboration for a range of possible arrangements. These benefits and costs may include tangible and intangible items. Stakeholders should be aware of the range of possible collaboration costs such as:
• costs of specifying rights and obligation of each stakeholder;
• costs of collaboration monitoring; and
• costs of enforcement of rights.
The research concludes that:
1. Multi-agent Simulation can be used to develop scenarios of sustainable forest management involving multi-stakeholders.
2. Collaboration between concessionaires and the communities appears to be the most promising approach for sustainable forest management, in particular for improving community incomes without decreasing the quality of the forest.
Collaborative forest management could be based on an economic approach with both the community and the concessionaire holding rights to harvest within the concession. Such an arrangement may be made more palatable to the concessionaire by cash compensation for timber harvested.
REFERENCES
BAPPENAS (1993), Biodiversity Action Plan for Indonesia, National Development Planning Agency, Jakarta.
Barreteau, O., Bousquet, F. and Attonaty, J. (2001), ‘Role-playing games for opening the black box of multi-agent systems: Method and lessons of its application to Senegal River Valley irrigated systems’, Journal of Artificial Societies and Social Simulation, 4: 2, http://jasss.soc.surrey.ac.uk/4/2/5.html, accessed 20 May 2001.
Bernard, H.R. (1994), Research Methods in Anthropology: Qualitative and Quantitative Approaches, Sage, Thousand Oaks CA.
Bousquet, F., Bakam, I., Proton, H., and Le Page, C. (1998), ‘CORMAS: Common-pool resources and multi-agent systems’, International Conference on Industrial and Engineering Applications of Artificial Intelligence and Expert Systems, Lecture Notes in Artificial Intelligence 1416, Springer, Berlin, pp. 826-838.
Bousquet, F., Barreteau, O., Le Page, C., Mullon, C. and Weber, J. (1999), ‘An environmental modelling approach: The use of multi-agent simulations’, in F. Blasco and A. Weill (eds.), Advances in Environmental and Ecological Modelling, http://CORMAS.cirad.fr/pdf/gowith.pdf, accessed 15 January 2001.
Carew-Reid, J., Prescott-Allen, R., Bass, S. and Dalal C. (1994), Strategies for Sustainable National Development: A Handbook for their Planning and Implementation, IIED and IUCN, London.
CIRAD (2001), ‘Natural resources and multi-agent simulations’, Centre de Coopération Internationale en Recherche Agronomique pour le Développement, http://cormas.cirad.fr/en/outil/outil.htm, accessed 25 February 2002.
Colfer, C.J.P., Brocklesby, M.A., Diaw, C., Etuge, P., Günter, M., Harwell, E., McDougall, C., Porro, N.M., Prabhu, R., Salim, A., Sardjono, M.A., Tchikangwa, B., Tiani, A.M., Wadley, R., Woelfel, J. and Wollenberg, E. (1999a), ‘The BAG: Basic assessment guide for human well-being’, Criteria and Indicators Toolbox, Series No. 5, CIFOR, Bogor.
Colfer, C.J.P., Prabhu, R., Günter, M., McDougall, C., Porro, N.M. and Porro, R. (1999b), ‘Who counts most? Assessing human well-being in sustainable forest management’, Criteria and Indicators Toolbox, Series No. 8, CIFOR, Bogor.
Fahey, L., Randall, R.M. (1998), ‘What is scenario learning?’, in L. Fahey and R.M. Randall (eds.), Learning from the Future: Competitive Foresight Scenarios, Wiley, New York, pp. 3-21.
Flores-Mendez, R.A. (1999), ‘Towards a standardization of multi-agent system frameworks’, ACM Crossroads Student Magazine, http://www.acm.org/crossroads/xrds5-4/multiagent.html, accessed 13 September 2001.
Purnomo, H., Yasmi, Y., Prabhu, R., Hakim, S., Jafar, A. and Suprihatin (2003), ‘Collaborative modelling to support forest management: Qualitative systems analysis at Lumut Mountain, Indonesia’, Small-scale Forest Economics, Management and Policy, 2(2): 259-275.
Septiana, A.R. (2000), Simulation of Forest Yield Regulation, Diploma Thesis, Bogor Agricultural University.
Sist, P., Kartawinata, K., Priyadi, H., Sheil, D. (2003), ‘Comparison of logging impacts with conventional and reduced-impact logging techniques in mixed dipterocarp forest of North-East Borneo’, manuscript, CIFOR, Bogor.
Sokal, R.R. and Rolf, R.F. (1995), Biometry: The Principles and Practice of Statistics in Biological Research, 3rd ed., Freeman, New York.
Stone, P. and Veloso, M. (1997), ‘Multi-agent systems: A survey from a machine learning perspective’, Carnegie Mellon University, http://www-2.cs.cmu.edu/afs/cs/usr/pstone/ public/papers/97MAS-survey/revised-survey.html, accessed 20 October 2001.
Sycara, K. (2000), ‘Multi-agent systems (a subtopic of agents)’, American Association for Artificial Intelligence (AAAI), http://www.aaai.org/AITopics/html/multi.html, accessed 19 September 2001.
Vanclay, J.K. (1994), Modelling Forest Growth and Yield: Applications to Mixed Tropical Forests, CAB International, Wallingford.
Vanclay, J.K. (2003), ‘Why model landscapes at the level of households and fields?’, Small-scale Forest Economics, Management and Policy, 2(2): 121-134.
Vanclay, J.K. and Skovsgaard, J.P. (1997), ‘Evaluating forest growth models’, Ecological Modelling 98(1): 1-12.
Vanclay, J.K., Prabhu, R. and Sinclair, F. (2003), ‘Modelling interactions amongst people and forest resources at the landscape scale’, Small-scale Forest Economics, Management and Policy, 2(2): 117-120.