THESIS
Coastal Landuse Change Detection Using Remote Sensing Technique:
(Case Study in Banten Bay, West Java Island, Indonesia)
Puvadol Doydee
P36500005MIT
Graduate Program
Bogor Agricultural University
ABSTRACT
Various forms of coastal landuse covering the study area has been observed to have undergone changes as evidently detected between the satellite images sensed in 1994 and 2001 at Banten Bay. It is important to identify what these changes are. Therefore,
an appropriate change detection must be selected. In this study, three main objectives were set: 1) To determine the image preprocessing and image processing techniques that is needed for digital coastal landuse change detection, 2) To perform digital coastal landuse supervised classification, and 3) To study the coastal landuse change of Banten bay in two dates.
The image preprocessing step involved removing errors from the raster data. This was done performing basic processes, such as, radiometric correction, geometric correction and image calibration. The image processing step comprised of supervised classification and change detection techniques. Supervised classification was employed in this study to transform multispectral image data into user defined thematic information classes and to serve as a reference for the quantitative results of the change detection techniques. On the other hand, change detection techniques tested on this study to show the best results included Red Green Method, Image Differencing Method, Image Ratioing Method and Principal Component Analysis Method (PCA).
Red Green Method gave the best result for detecting the coastal landuse change because the number of changed area closely resembled the total number of changed area reference. Through careful comparison it was observed that Red Green Method is suitable for detecting areas changes in the paddyfields increase and settlement increase; Image Differencing Method is better to detect areas changes in agriculture increase, fishponds decrease and natural area decrease; Image Ratioing Method gave the best result for monitoring areas change in fishponds increase, paddyfields decrease and agriculture decrease because the number of each changed area (per hectare) nearly coincides more with the size of changed area (per hectare) of each increase and decrease reference.
Every coastal landuse category increased in utility area except for the natural area. The obsenred reduction in the area size of the natural area is due to the growth rate of the population and increased activities along this area. Based from field checking, some parts of agriculture and paddyfields became fishponds in LONTAR zone.
DECLARATION LETTER
I, Mr. Puvadol Doydee, hereby declare that the thesis title:
Coastal Landuse Change Detection Using Remote Sensing Technique:
(Case Study in Banten Bay, West Java Island, Indonesia)
contains correct results from my own work, and that it have not been published ever
before. All data sources and information used factual and clear methods in this project,
and has been examined for its factualness.
Bogor, August 2002
Puvadol Doydee
THESIS
Coastal Landuse Change Detection Using Remote Sensing Technique:
(Case Study in Banten Bay, West Java Island, Indonesia)
Puvadol Doydee
P36500005lMIT
A Thesis Submitted to
Graduate School of Bogor Agricultural University, Indonesia In fulfill of the requirements for the degree of
Master of Science in Information Technology for Natural Resources Management
Graduate Program
Thesis Title : Coastal Landuse Change Detection Using Remote Sensing Technique: (Case Study in Banten Bay, West Java Island, Indonesia)
Student Name Puvadol Doydee
Student ID P36500005
Study Program : Master of Science in Information Technology for Natural Resources Management
Thesis approved
by
the advisory board:Dr.
Ir.
Vincentius P. Siregar SupervisorDr. -1np. Fahmi Amhar Co-supervisor
Chairman of Study Program Director of the Graduate Program
OpA-
Dr.
Ir.
HandokoAUTOBIOGRAPHY
Mr. Puvadol Doydee was born on December 20, 1975 at Phetchaburi Province, Thailand. He grew up in a modest family together with 2 younger sisters. High school days not only involved enjoying the company of friends at Phrommanusorn Phetchaburi Province high school, but also making careful decisions after graduation. It was a time of making big decisions for a very expansive future that lay ahead. Decisions and circumstances lead him in becoming a fisheries biologist. This choice was made because of his interest in knowing more about fisheries science, its nature and the field study involved. Up till now, he never regretted making this decision.
Mr. Puvadol was deeply enthusiastic with Fisheries, learning as much as he could in this field. This lead him in earning a Bachelor's Degree from the Department of Fishery Management, Faculty of Fisheries, at Kasetsart University, Bangkok. Thailand in 1998. As soon as he graduated he started working as a fisheries biologist at the Department of Fishery Management, Faculty of Fisheries, at Kasetsart University. Currently, he is still working with this institution as a faculty and fisheries biologist.
ACKNOWLEDGMENTS
Firstly, I would like to express my sincere thanks and faithful appreciation to the SEAMEO Regional Center for Graduate Study and Research in Agriculture (SEAMEO- SEARCA), Philippines for awarding me the scholarship for this Master of Science program. I would like to express my heartfelt thanks to the chairman of the study program Dr. Ir. Handoko for accepting me in this study program. I would also like to thank my supervisor Dr. Ir. Vincentius P. Siregar and my co- supervisor Dr.-Ing Fahmi Amhar for their guidance, technical comments and encouragement throughout the period of my study.
I am very grateful to Associate Professor Dr. Kungwan Juntarashote, Chairman of the Department of Fishery Management, Faculty of Fisheries, Kasetsart University for his kind encouragement. My profound appreciation goes to Ms. Puangpis Kositsamith who always showed 'concern for me. My sincere gratitude and appreciation goes to Mr. Nyoman Sukmantalya for providing all the data that I needed for this study and Mr. Suryano for helping me once, working together at Banten Bay. You made my study run well. I would like to extend my thanks to all my instructors who delivered the Information Technology knowledge and shared many experiences to me. Furthermore, appreciation is extended to my classmates. Special thanks to the MIT program for their kindness of taking care and helping me throughout the program. I am very thankful.
LIST OF CONTENTS
Page
ABSTRACT
...
i.
.
...
DECLARATION LETTER 11
...
APPROVAL SHEET iv
AUTOBIOGRAPHY
...
v ACKNOWLEDGMENTS...
vi...
LIST OF CONTENTS vii
...
LIST OF FIGURES ix
...
LIST OF TABLES x
...
1 INTRODUCTION I
...
1.1 Background I
1.2 Objectives
...
5...
2 LITERATURE REVIEW
...
2.1 Coastal Zone...
2.2 Shoreline (Coastline)...
2.3 Remote Sensing Technique for Coastal Management...
2.4 Landuse and Coastal Landuse...
2.4.1 Coastal Landuse Change2.4.2 Coastal Landuse Change Monitoring
...
...
2.5 Landsat Imagery...
2.5.1 Landsat-5 TM (Thematic Mapper)2.5.2 Landsat-7 ETM' (Enhanced Thematic Mapper Plus)
...
2.6 Classification...
...
2.6.1 Supervised Classification...
2.0.2 Knowledgebase Classification...
2.7 Change Detection...
2.8 Validation Method...
2.8.1 Error Matrix...
2.8.2 Ground Truth
...
3 METHODOLOGY
...
.
.
22...
3.1 Time and Location 22
...
3.2 Data Sources 23
...
3.2.1 Remote Sensing Data 23
...
3.2.2 Topographic Maps 23
...
3.2.3 Geomorphological Map 23
...
3.3 Required Tools 23
...
3.3.1 Software 23
...
3.3.2 Hardware 24
3.4 Methodology
...
24...
3.4.1 Image Preprocessing 26
...
3.4.2 Image Processing 28
4 RESULTS AND DISCUSSION ...
.
.
.
.
...
4.1 Radiometric Correction...
4.2 Geometric Correction...
4.3 Image Calibration...
4.4 Coastal Landuse in 1994 and 2001...
4.5 Change Detection Techniques...
4.5.1 Red Green Method
...
4.5.2 Image Differencing Method...
4.5.3 Image Ratioing Method...
4.5.4 Principal Component Analysis Method...
4.6 Coastal Landuse Change Analysis...
Page 33
...
5 CONCLUSION AND RECOMMENDATION 50
5.1 Conclusion
... .
.
...
50 5.2 Recommendation ... 52REFERENCES
...
53LIST OF FIGURES
[image:92.595.78.515.88.816.2]Figure 1
.
Coastal zone boundary...
Figure 2.
Basic steps in supervised classification...
Figure 3.
Equiprobability contours defined by a maximum likelihood classifier....
...
Figure 4.
Landuse invento~y...
Figure 5.
Example error matrixFigure 6
.
The Study Area...
...
Figure 7.
Methodology flowchart...
Figure 8.
Image preprocessing flowchart...
Figure 9.
Transform line...
Figure 10.
Image1994: before and after correctedFigure 11
.
Ground Control Points...
...
Figure 12.
Dataset information of image 1994...
Figure 13.
Comparing Landsat 2001 calibrationFigure 14
.
Coastal landuse in 1994...
.
...
Figure 15 Coastal landuse in 2001Figure 16
.
Banten Bay Coastal Landuse 1994...
...
Figure 17.
Banten Bay Coastal Landuse 2001...
Figure 18.
Comparing the image 1994 as red with image 2001 as green...
Figure 19.
The result of red green method...
.
Figure 20 The result of image differencing method
...
Figure 21.
The result of image ratioing methodLIST OF TABLES
Table 1
.
TM Bands and TM Technical Specifications...
Table 2.
ETM+ Bands and ETM' Technical Specifications...
Table 3.
Comparing The DN value for histogram adjustment...
Table 4.
Area of coastal landuse between two dates...
Table 5.
Coastal landuse change between 1994 and 2001...
...
Table 6
.
Comparison of change detection techniques in total reference....
Table 7.
Comparison of change detection techniques in each increase reference Table 8.
Comparison of area change increase difference in each coastal landusecategory
...
...
Table 9.
Comparison of change detection techniques in each decrease reference Table 10. Comparison of area change difference decrease in each coastal landuse1
INTRODUCTION
1.1 Background
Remote sensing technique plays'an important role for monitoring coastal landuse
change. Some researchers have performed change detection but almost most of them
are interested in climate change and change of vegetation. However, in a specific
area, such as, coastal zone, this application is also essential for monitoring change.
This study emphasizes on the capability of remote sensing technique to detect the
change in coastal landuse by using four methods of change detection techniques, and
then compares the result of those with each other.
This study can benefit coastal landuse management, which is necessary as'a part of
sustainable development in line with coastal area planning. One of the image datasets
used in this study was recently captured last 2001. Nowadays, Banten Bay is a
famous study area for researchers and fisheries biologists because the region is
convenient. There are more activities, such as, paddyfields, fish and shrimp farming,
harbor, and power plant have had established along this area and, no doubt, those
activities will influence the coastal zone and fisheries resources. Thus, the phenomena
that have changed might have influence this area and also in the case of small-scale
fisheries community.
The coastal zone is that space in which terrestrial environment is influenced by
marine environments (Carter, 1988). As boundaries between land and water, coasts
are characterized primarily by geologic nature of the land where the loose
sedimentary coast is relatively unstable and often fragile. The coastal zone is an
extremely dynamic system. It is composed of coastal zone as an overall part, coastal
strip and coastline. Variations in the characteristics of its major constituents occur
rapidly over space and time. Sand and other materials are moved onto and off beaches
environment or cause physical damages. Coastal landuse changes are the most
important part of coastal dynamics.
Theory suggests that global warming will result in a rise in global mean sea level
hence coastal areas will be affected by potential changes not only with the climate
system but also the sea level. The potential impacts of environmental changes on
humanity maybe greater in this compai-tment of the geosphere and biosphere system
more than many other area of the surface of the globe since the range of geometric
driven of change includes not only climate change in the broadest sense of changes in
temperature, rainfall and wind regimes but also includes changes in ocean climate,
storminess, flooding and inundation (LOICZ, 1994).
Coastal ecosystem and organisms that have important biogeomorphological hnction
include coral reefs, calcareous algae, and a range of shell-producing animals that
contribute to the formation of calcareous sediments; coastal wetland forest, sand
ridge, mangrove, sea grass, salt marsh and macro algae communities that tend to trap
land or ocean derived particulate material; benthos invertebrates that can stabilize or
destabilize near shore sediments; and various organisms (micro algae, bacteria) that
promote sediment cohesiveness through the production of extra cellular metabolites.
Coastal zone pollution is a variety of waters that originate from both land and marine-
based activities and eventually enters into the marine environment. Sources of land-
based pollution include coastal and upstream agriculture that discharges pesticide,
fertilizer and sediment runoff. For urban and industrial development that discharges
untreated waste and effluent. Source of marine-based pollutantion include oil and gas
related activities resulting in discharges of drilling wastes, chronic spills and
potentially major oil spills (tanker accidents, blowouts); and marine traffic accidents
resulting in release of waste and toxic material, as well as the heavy accumulation of
waste in coastal and marine waters, especially in area with high population density
Change detection has been one of the major applications of remote sensing since
1960s. There are many approaches to change detection. Despite of their differences in
change identification algorithms, accurate spatial registration of the various dates of
imagery is a requirement for all these methods. There are essentially two different
categories of image rectification approaches, the deterministic and the statistical
approaches. The deterministic approach relies on data of the flight parameters and the
terrain information, and is effective when types of distortion are well characterized
(Richards, 1995). The statistical approach, by means of ground-control-points (GCP)
dataset, establishes mathematical relationship between image coordinates and their
corresponding map coordinates using standard statistical procedures. Remote sensing
can be used as a management tool to map coastal landuse and monitor the coastal
landuse change.
There are several existing and former coral islands of patch and fringing forms and
submerged reefs in Banten Bay, two of which are conserved as bird sanctuary, sea
grass beds and mangroves. The existence of corals form the base and cause stability
of the coral island and supply new sediment on the coast. Coral reefs, sea grasses, and
mangroves are the main tropical coastal ecosystems their composition, distribution
and function are affected by impacts of sedimentation, erosion forces, sand and rubble
mining, eutrophication, and over fishing. Coral reefs stability is very much dependent
on the living benthos life. The living benthos life, the more stable or expanding the
reefs as function of time. Sea grass plays an important role to fisheries, and its
prosperity is affected by changes in sediment runoff. At present, this system is
diminishing due to very active reclamation activities, some of which are converted
into fishponds. The area reduction and disappearance of mangroves, coral reefs and
sea grass will reduce coastline stability or accelerate the erosion rate of coastal area
(Saptarini, 2000).
Referring to the regional development plan, northwest coast of Banten province has
chemical, dock, and power plant. On the other hand, the northeastern coast is for
coastal fishery cultivation, conservation area, coastal green belt, and settlement area.
Coastal and marine fisheries support some seventy thousand people who live around
Banten Bay. In line with the increase of population number with its activities and
needs, and lack of proper development control, there are prominent coastal landuse
shifts and changes from that previously planned and subsequently various conflicts of
interests occur.
An international seaport for containers and jetties are now being constructed with
pronounced reclamation activities (Saptarini, 2000) due to rapid growth of industries,
which it needs transportation and seaport. Thus, this region have change influent
current direction and velocity, and consequently may stimulate sedimentation in the
near up drift and coastal erosion at the far up drift and near down drift parts. On the
other hand, constructions of seaport, industries and residential areas, agriculture and
aquaculture modify sedimentation process and its distribution in the Banten Bay.
Therefore, coastal landuse change is an essential matter that should be monitored For
planning or avoiding any further changes that can damage or harm the environment.
In areas with dense population or built up areas with vital infrastructures. The
technology that was used to accomplish in this study is remote sensing that offers s
faster and better synoptic view of large areas compared with traditional way, such as,
terrestrial mapping and aerial photo, as well as it is easier and cheaper of coastal
1.2 Objectives
The objectives of this study involved mapping coastal landuse and monitoring coastal
landuse change from Landsat image data, which were compared between the years of
1994 and 2001. The study area is in Banten Bay, West Java Island, Indonesia. The
detailed objectives are below:
1. To determine the image preprocessing and image processing techniques that is
needed for digital coastal landuse change detection,
2. To perform digital coastal landuse supervised classification,
2
LITERATURE REVIEW
The essential and important issue of coastal zone management for sustainable
development have had concerned about coastal landuse, coastal ecosystem and
environment, canying capacity and land suitability, which in this study handled with
information technology that emphasize in application of remote sensing for coastal
landuse change detection. The key words are Coastal Landuse, Remote Sensing (RS),
Landsat, Supervised Classification and Change Detection. So, its needed to determine
a definition of keys words and some portion relationship in order to effective and
efficient for performing and accomplishment in this study.
2.1 Coastal Zone
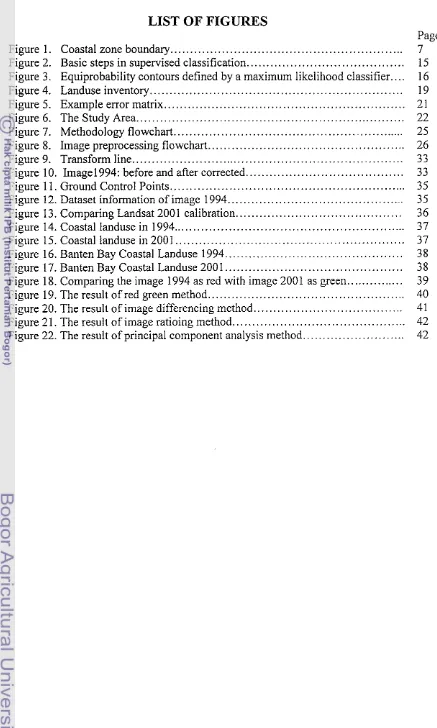
In the United States of America, the term coastal zone (legal definition for coastal
zone management) means the coastal waters (including the lands therein and
thereunder) and the adjacent shorelands (including the waters therein and thereunder),
strongly influenced by each and in proximity to the shorelines of the several coastal
states, and includes islands, transitional and inter-tidal areas, salt marshes, wetlands,
and beaches (NOAA, 1998).
For mapping purposes in Indonesia, coastal zone is defined as an area between l a d
and sea that affects each other, having a specific geosphere characteristics, to the
direction of land that is limited by the effect of marine socio-economic and physical
characteristics, while to the direction of sea it is limited by the natural process and
caused by human activities against the land environment.
Sometimes coastal zone definition depends on the project purposes, such as that
defined for the Land-Ocean Interactions in the Coastal Zone (LOICZ) project. The
coastal zone is considered to extend from the coastal plains to the outer edges of the
and exposed during the sea level fluctuations of the late-Quaternary period.
Definitions of coastal zone may extend to the landward and seaward limits of marine
and terrestrial influence respectively. At the other extreme, the coastal zone can be
restricted to the coastline and adjacent geomorphological features determined by the
action of the sea on the land margin. Coastal zone boundary is presented in Figure 1.
Figure 1. Coastal zone boundary (Holligan and de Boois, 1993).
2.2 Shoreline (Coastline)
Shoreline is intersection of the land with the water surface. The shoreline represents
the line of contact between the land and a selected water elevation. In areas affected
by tidal fluctuations, this line of contact is the mean high water line. In confined
coastal waters of diminished tidal influence, the mean water level line may be used
(NOA.4, 2001). Furthermore, coastlines vary in time, and coastline detected by Remote Sensing may be influenced by this variation, so that a correction might be
necessary. Several different shoreline definitions are in use by various state, and local
authorities. The use of inconsistent shoreline definitions between maps, charts,
Geographic Information Systems (GIs), and other products can lead to confusion by
users and can contribute to misinformed decision-making.
Shoreline defined as the line of ordinary low water along that portion of the coast that
[image:100.602.104.490.206.358.2]waters. In coast survey usage, shoreline is considered synonymous with coastline and
defined as the line of contact/crossing line between the land and a body of water. On
coastal and geodetic survey nautical charts and surveys, the shoreline approximately
uses the mean high water line (Saptarini, 1998).
Another definition of shoreline is the line where the average high tide, known as
mean high water (MHW), interacts the coast. Basically, planning map uses high water
line or mean sea level as shoreline reference as they are easier to be determined and
frequently exposed. This is different from the depth reference in bathymetric map that
usually uses low water line for safe navigation as applied in most ports of Indonesia.
However, use mean sea level (MSL) as reference level for comparative morpholo-
gical studies or sea level changes.
2.3 Remote Sensing Technique for Coastal Management
Remote sensing is the technique of collecting information from a distance. By
convention, "from a distance:" is generally considered to be large relative to what a
person can reach out and touch, hundreds of feet, hundreds of miles, or more. Remote
sensing techniques are used intensively to gather measurements, Satellite-based
systems can now measure phenomena that change continuously over time and cover
large, often inaccessible areas (Aronoff, 1991).
There are various journal concerns the application of remote sensing for coastal
management, such as, fisheries detection using NOAA satellite, why can fishing
grounds be monitored by remote sensing, monitoring the water sediment dynamics,
satellite ocean color use for oceanic resources, general inventory of shrimp
aquaculture potential, suitable land selection for shrimp f m development,
bathymetry mapping, and coral reef mapping in order to manage coastal resource into
sustainable development cany on. However, Landsat imagery is useful for image
is caused of the Landsat TM and ETM' has both an increase in the number of spectral
bands and an improvement in spatial resolution.
2.4 Landuse and Coastal Landuse
Landuse is defined in terms of a specific combination of land activity and landcover.
Land "activity" is regarded as the active use man makes of the land. It is not to be
confused with other variables, such as, tenure, ownership, economic activity or land
value. Landcover is regarded as the vegetative, natural or artificial construction
covering the land surface (Yusuf, 2001).
Definitions of landuse raise the following issues:
- The difference between present and proposed uses needs to be clarified
- Both landcover and land activities need to be included
- Landcover complicates the inventory and its unnecessary
Coastal landuse is defined in terms of a specific combination of land activity and
landcover on the coastal zone. Land "activity" is regarded as the active use man
makes of the land occurred on the coastal zone. Coastal landcover is regarded as the
vegetative, natural or artificial construction covering the coastal land surface. Coastal
landuse, such as, natural area and agriculture might be either change into paddyfields,
fishponds or settlement. Moreover, those may be change by natural hazard, such as,
storm, floodwater, landslide and earthquake. However, the faster one that has effected
with coastal landuse is human activities. Coastal landuse changed very important
phenomena because its have influent with biogeomorphological function. For
example, coral reefs zone, calcareous algae, and a range of shell-producing animals
that contribute to the formation of calcareous sediments, sea grass, salt marsh and
macro algae communities that tend to trap land or ocean derived particulate material,
various organisms (micro algae, bacteria) that promote sediment cohesiveness
through the production of extra cellular metabolites.
2.4.1 Coastal Landuse Change
Coastal landuse change is one of the most critical dynamic elements of coastal zone.
This pattern is a product of the interaction between ecological and socioeconomic
processes. Understanding the function and structure of coastal landuse, primarily in
terms of human impacts, requires integration of biological and socioeconomic
knowledge. Natural resource managers, in particular, need this integration to
effectively evaluate the social and environmental cost of alternative management
scenarios.
The basic concept of landuse changes is related to the biogeochemical cycle, energy
cycle, global climate change, and the aspect of human dimension. Energy flows
through an ecosystem in a cyclic manner and do materials that necessary for a life,
such as, carbon, oxygen, nitrogen, potassium, water, and many others. The path these
substances take a place in the environment are called biogeochemical cycles. Some
biogeochemical cycles are keeping up by large storages in the atmosphere and other
are dominated by terrestrial storages, usually in rocks and sediment. Energy in an
ecosystem (and also humansystem) is eventually derived from the sun, called solar
energy. The energy passes through a series of storages by way of many paths, before
lastly being return to the space as radiant energy. Ecosystems consist of all living
organisms in a defined geographic area together with all the physical entities (soil,
water, dead organic matter, and so on), with which they interact. Since one type of
organism in an ecosystem consume another, a pattem of energy flow through the
ecosystem is set up, called food chain.
There is a general recognition about the significance of coastal landuse changes to the
coastal landcover in effecting the biochemical flows, and the states of the biosphere
geosphere. Also coastal landuse in its own right as it interacts with human activities
that drive and take action to the environmental change. Changes in coastal landuse
may result in deforestation and soil degradation, such as, desertification and
salinization, loss of wetlands, changes in hydrology function, and changes in the
distribution of chemical and biological properties of aquatic and terrestrial ecosystem
(Yusuf, 2001).
There are four aspects of large-scale environmental perturbations that are considered
as the term of "global change": 1). Change in landuse and landcover, 2). Worldwide
decline in biodiversity, 3). Change in atmospheric composition, especially the increase in C02 concentration and 4). Change in climate. The most rapid changes of
coastal zone are in coastal landuse, mainly in terms of coastal landuse conversion,
such as, forest conversion for agricultural purpose, fishery cultivation purpose, human
settlements, industrial areas, and other intensive uses.
2.4.2 Coastal Landuse Change Monitoring
Determination of coastal landuse change monitoring can be conducted using various
methods, among others, mapping using GPS (Global Positioning System). In recent
decades, remote sensing technique has been use for monitoring landuse changes.
Remote sensing techniques consist of some methods, such as, map-used, aerial
photograph, and data imagery. Beginning with the early use of aerial photography,
remote sensing has been recognized as a precious tool for viewing, analyzing,
characterizing, and making decision about environment problems. Remote sensing
technology though a larger instantaneous field of view therefore it is acquired in
larger scope of areas, fast and cost-effective. Satellite remote sensing has become
more and more important as a technique for regional studies, especially for less
accessible large areas where previously information was very limited. Some scientist
changes; especially, landuse and landcover changes and for this study have used for
detecting the change in coastal landuse.
2.5 Landsat Imagery
2.5.1 Landsat-5 T M (Thematic Mapper)
Landsat-5 TM was lunch in 1984. Thematic Mapper (TM) is instrument that upgrades
included improved ground resolution (30 meters) and 3 new channels or bands. The
TM is a highly advanced sensor incorporating a number of spectral radiometric and
geometric design improvements relative to the MSS. Spectral improvements include
the acquisition of data in seven bands instead of four, with new bands in the visible
(blue), mid-infrared, and thermal portions of the spectrum. Also, based on experience
with MSS data and extensive field radiometer research result, the wavelength range
and location of the TM bands have been choose to improve the spectral
differentiability of major earth surface feature.
Radiometrically, the TM performs its onboard analog-to-digital signal conversion
over a quantization range of 256 digital numbers (8 bits). This corresponds to a
fourfold increase in the gray scale range relative to the 64 digital numbers (6 bits)
used by the MSS. This finer radiometric precision permits observation of smaller
changers in radiometric magnitudes in a given band and provides grater sensitive to
changes in relationships between bands. Thus, difference in radiometric values that
are lost in one digital number in MSS data may now be distinguished.
Geometrically, TM data are collected using a 30-m ground resolution cell (for all but
the thermal band, which has 120 m resolution). This represents a decrease in the
lineal dimensions of the ground control cell of approximately 2.6 times, or a
reduction in the area of the ground resolution cell of approximately 7 times. At the
same time, several design changes have been incorporated within the TM to improve
data are supplied using 28.5 X28.5-m pixels registered to the Space Oblique Mercator
(SOM) cartographic projection. The data may also be fit to the Universal Transverse
Mercator (UTM) or Polar Stereographic projection (Lillesand and Kiefer, 1994). The
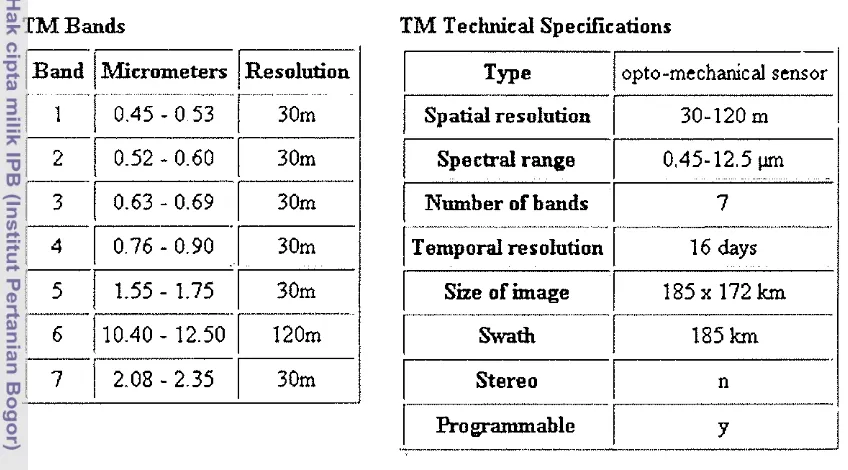
TM bands and TM Technical Specifications are presented in Table 1.
Table I . TM Bands and TM Technical Specifications (NASA, 2002).
TM Bands TM Technical Specifications
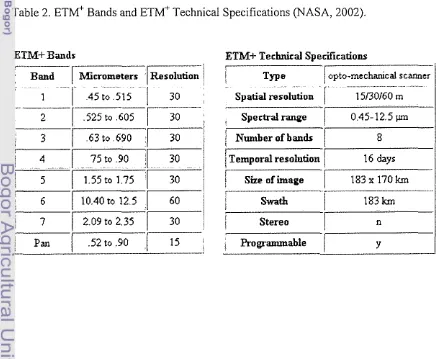
2.5.2 Landsat-7 ETM+ (Enhanced Thematic Mapper Plus)
Type -
Spatial resolution ' - ; O - I Z O m
The Land Remote Sensing Act of 1992 once again transferred the management
responsibility for the Landsat program with the design and operation of Landsat-7 and
its successors. Under this legislation NASA and the Department of Defense (DOD)
jointly managed the program. According to the design of Landsat-7 has been
developed in an attempt to meet the needs of both the defense community and civilian
users. At the time of this writing (1993), many aspect of the design and operation of
Landsat-7 were still under discussion (particularly in light of launch failure of
Landsat-6). The following describes the plans for the system as of that date. The
design of the ETM' (Enhanced Thematic Mapper Plus) stresses the provision of data
Spectral range
Number of bands
0.45-12.5 pm
~ . .
7 ... ...-.. ,. . -. .
Temporal resohtion
[
16 daysSize of image 185 x 172 km ..
Swath
r--
1 85 kmStereo n
[image:106.595.79.503.228.463.2]continuity with Landsat-4 and Landsat-5. Similar orbits and repeat patterns are used,
as is the 185-km swath width for images. As with the ETM planned for Landsat-6, the
system is designed to collect 15-m-resolution " panchromatic" data and six bands of
data in the visible, near-IR, and Mid-IR spectral regions at a resolution of 30 m. A
seventh, thermal band is to be incorporated with a resolution of 60 m. As with the
ETM, high and low gain setting for the individual channels may be controlled from
the ground.
Several other design features characterize the ETM'. First, the system will include a
"dual mode solar calibrator, "in addition to an internal lamp calibrator. This will
greatly improve the radiometric calibration of the ETM' data. Also, data can be
transmitted to ground in three possible ways: directly, via the tracking. Finally,
because the spacecraft includes a GCP receiver, subsequent geometric processing of
the data will be facilities (Lillesand and Kiefer, 1994). The ETM' bands and ETM'
[image:107.599.78.518.420.779.2]Technical Specifications are presented in Table 2.
Table 2. ETM' Bands and ETM' Technical Specifications (NASA, 2002).
ETM+
---
Bands. ~. . . .. . .. . . ..
1
1'
G t o . 5 1 5/
30;
.. --
r--.
--2
1
,525 to ,605I
i
ETM+ Technical Speciiications
I
i Type . . .. .
/
.
. opto-mechanical scanner, -
Spatial resolution
/
15/30/60 rn,
Spedral-e1
0 . 4 5 - 1 2 . 5 ~/
Number ofbands1
8j
Temporal resolution1
16 days1
Size ofimage1
183 x 170 km! Swath
1
183 kmI
! Stereo
1
nProgrammable
1
Y2.6 Classification
2.6.1 Supervised Classification
Classification is an abstract representation of the situation in the field using well-
defined diagnostic criteria: the classifiers. Sokal (1974) defined it as "the ordering or
arrangement of objects into groups or sets on the basis of their relationships." A
classification describes the systematic framework with the names of the classes and
the criteria used to distinguish them, and the relation between classes. Classification
thus necessarily involves definition of class boundaries that should be clear, precise,
possibly quantitative, and based on objective criteria (Jensen, 1986).
Supervised classification is the method used to transform multispectral image data
into thematic information classes. This procedure typically assumes that imagery of a
specific geographic is gathered in multiple regions of the electromagnetic spectrum.
The basic steps in s~ipervised classification are presented in Figure 2.
IMAGE DATA SET
l F i n digital numberr
CATEGORIZED SET
C h n m l : 1
I l l TRAINING STAGE 121 CLASSIFICATION STAGE 131 OUTPUT STAGE C0llrct nurn.r;c11 Cunpare each u n k n ~ r n l Prcrnnl rrnzrrr-
data I r a n lrainiog ~ i l c l 10 WK1161 111116tt1'. lll.lp$
a r e a 00 w l l l l as,* lo r n ~ : simila~ ldbles 01 area darn
,-MY WIILml CdlPCOrl GIS driil l i l r .
ot land c a w
[image:108.595.72.507.42.814.2]caegorla
Supervised classification, the identifying and location of feature classes or cover
types (urban, forest, water, etc) are known beforehand through fieldwork, analysis of
aerial photographs, or other means. Typically, identify specific areas on the
multispectral imagery that represent the desired known feature types, and use the
spectral characteristics of these known areas to train the classification program to
assign each pixel in the image to one of these classes. Multivariate statistical
parameters, such as, means, standard deviation, and correlation matrices are
calculated for each training region, and each pixel is evaluated and assigned to the
class to which it has the most likelihood of being a member (according to rules of the
classification method chosen).
One of the simple classification strategies that may be used is Maximum Likelihood
Classifier. The Maximum Likelihood Classifier quantitatively evaluates both the
variance and covariance of the category spectral response patterns when classifyix~g
an unknown pixel. In essence, the maximum likelihood classifier delineates
ellipsoidal "equiprobability contours" in the scatter diagram. These decision regions
are showed in Figure 3. The shape of the equiprobability contours expresses the
sensitivity of the likelihood classifier to covariance.
I I
sld 4 <?"l M*
-
An extension of the maximum likelihood approach is the Bayesian classifier. This
technique applies two weighting factors to the probability estimate. First, the analyst
determines the "a priori probability", or the anticipated likelihood of occurrence for
each class in the given scene. Second, a weight associated with the "cost" of
misclassification is applied to each class. Together, these factors act to minimize the
"cost" of misclassifications, resulting in a theoretically optimum classification. In
practice, most maximum likelihood classification is performed assuming equal
probability of occurrence and cost of misclassification for all classes. If suitable data
exist for these factors, the Bayesian implementation of the classifier is preferable
(Jensen, 1986). Image classification is an auto~natically categorize all pixels in an
image into coastal landuse classes or themes. These categorized data may then be
used to produce thematic maps of the coastal landuse present in an image and produce
summary statistic on the areas covered by each land cover type.
2.6.2 Knowledgebase Classification
The human visual interpretation that is mainly an object-based has to be considered as
a natural and logical alternative, since the traditional computer-assisted algorithms
have produced less information than is desirable when they are applied to higher
resolution remotely sensed data. To integrate geographical information system (GIS)
and remote sensing (RS) system it is important that both systems are object oriented.
A data structure with a higher information level can be obtained by using the concept
of terrain objects. In GIs terrain objects are represented by three components: an
identifier, a thematic data, and a geometric data. In RS the information derived from
classification is feature based. Of late there has been lots of research going on how to
link GIs and RS. The integration between GIS and RS is vital since in GIs the data
can become obsolete quickly, so it is essential to update periodically with new spatial
and thematic data. Remote sensing is often the most cost effective source for these
Remote sensing data is used by a variety of users from ecologist, geologist, landuse
planner and meteorologist to oceanographer. For many of these surveying
applications the images are classified into classes that are relevant to the users. The
classification is based on spectral characteristics. The spectral characteristics are
difficult to classify because we require knowledge about the class in terms of texture,
pattern, and shape of the objects. Additional information in form of ancillary data can
be used to enhance the classification; the latter category is called "knowledgebased
classification" (Middelkoop ef a/., 1991).
The knowledge base in our case takes the form of a production rule base. The
knowledgebased system has three types of rules: the initialization rules, landcover to
landuse rules and local consistency rules. These rules have been adapted in
classifying our landcover maps to landuse. The initialization rules use a priori
knowledge to give a score to each landcover. For coastal Ianduse classification it is
not possible to retain all characteristic features of an object. The criteria of
classification have to be selected (this implies that some features will be emphasize)
and some other neglected. The most common systems of classification are:
physiognomic, ecological, geographical, dynamic or evolutionary and functional
system.
The level of detail may also determine the criteria of classification. For example,
when inventories have to be made over extensive areas using remote sensing
techniques, physiognomic criteria will acquire more importance. Physiognomic
systems are more related to the landcover than to the actual use to which the land is
put. Landuse is inferred from analysis and interpretation of landcover features. The
success of such interpretation relies on the analyst's ability to identify relevant
physical characteristics of land attributes and relate those observable parameters to
the use made of local resources. Assessment of the actual landuse is also dependent
on the availability of an appropriate classification. A logical succession of operations
neighborhoods, proximity and association, as well as pattern (quality analysis) due to
the requirement of landuse classification for satellite images.
Characteristics Vtsual observations
PAlJERN Remote sensing measurement
CLASSIFIER PRE-SPECIFIED CLASSES
( Set of rules ) (open ended classification) I
I
[image:112.605.119.484.157.306.2]Identification
Figure 4. Landuse inventory - a logical succession of operations.
2.7 Change Detection
Coastal landuse change detection is needful for updating coastal landuse maps and the
coastal resources management. The change is usually by comparison between two
dates images, or sometimes between an old map and update remote sensing image.
Change detection is a method to identifj, the changes in imagery of the same
geographic area obtained at different times. Aerial photo and data imagery are two of
data source that often used in change detection. Digital change detection is a method
that involving data imagery as source of data. A fundamental assumption of digital
change detection is that there exists a difference in the spectral response of a pixel on
two dates if the landcover or landuse changes from one type to another. A change
detection method should be based on a sensor system that:
-
Has a systematic period between over flights,- Records imagery of the same geographic area,
-
Reduces relief displacement as much as possible, andThe change detection processing using satellite imagery is an ideal way to determine
changes in coastal landuse in order to enable organizations to maintain the integrity of
the data that they manage. The periodic availability of remotely sensed data makes it
well suited to change detection applications. Multidate imagery can be processed to
highlight changes in pixel spectral response between image dates. Such information
can be used in the decision making process, or used to monitor changes over time as
an aid to updating information database.
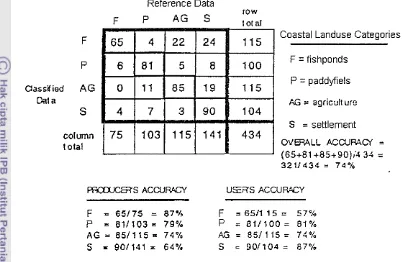
2.8 Validation Method 2.8.1 Error Matrix
One of the most common means of expressing classification accuracy is the
preparation of a classification error matrices (sometimes called a confusion matrix or
a contingency table) Error metrics compare, on a category-by-category basis, the
relationship between known reference data (ground truth) and the corresponding
results of an automated classification. Such matrices are square, with the number of
rows and columns equal to the number of categories whose classification accuracy is
being assessed (Lillesand and Kiefer, 1994). The matrix is a square array of numbers
set out in rows and columns that express the labels of samples assigned to a particular
category in one classification relative to the labels of samples assigned to a particular
category in another classification. Example error matrix is presented in Figure 5.
2.8.2 Ground Truth
A commonly used term for observations made on the surface of the earth with respect
to remotely sensed data is ground truth. Other terms of a similar meaning are in situ
commonly used to determine the accuracy of categorized data obtained through
classification (ER Mapper, 1997).
Reference Data
column
I olal
row
101 al
Coastal Landuse Categories
P = paddyfiels
W ; = agricull ure
[image:114.595.82.484.147.409.2]S = settlement
3 METHODOLOGY
3.1 Time and Location
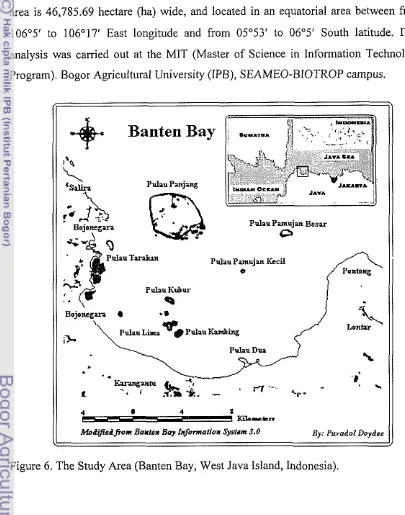
This study was conducted from March to August 2002 and the location covered
Banten Bay, West Java Island, Indonesia. The study area is presented in Figure 6. The
area is 46,785.69 hectare (ha) wide, and located in an equatorial area between from
106"5' to 106O17' East longitude and from 05'53' to 06O5' South latitude. Data
analysis was carried out at the MIT (Master of Science in Information Technology
[image:115.602.79.484.209.724.2]Program). Bogor Agricultural University (IPB), SEAMEO-BIOTROP campus.
Figure 6. The Study Area (Banten Bay, West Java Island, Indonesia).
L
Banten Bay
's&
P&u PanjvlgPulau Pamujan B s s v
0
Pulau Kubur
.a
Pulau D u
.
+
' r 7 - c,.
-
* . .
L
4 L 4 I
Mod~fl~disafmm Baxten 601 I*m?~tioa S@em 3.0 6 y . ArvadolDoyd.v
3.2 Data Sources
There are three kinds of data were used in this study as enumerated below:
3.2.1 Remote Sensing Data
The remote sensing datas that were used in this study are the images Landsat-5 TM,
with the pathlrow 1231064 and acquisition date of April 6, 1994, and Landsat-7 ETM+
with pathlrow 1231064 and acquisition date of August 7, 2001. These were acquired
from Bakosurtanal.
3.2.2 Topographic Maps
The topographic maps that were used in this study included 6 sheets: 1109-643
Pontang, 1109-634 Serang, 11 09-633 Cilegon, 11 10-3 11 Bojonegara, sheet 11 10-312
Pasir Putih, sheet 11 10-321 Lonrar. All sheets in scale had a scale of 1: 25000
published by Bakosurtanal in 1999.
3.2.3 Geomorphological Map
The geomorphological map covering the coastal area of Banten Bay, West Java
Island, which was modified on February 2000 by Mr. I Nyoman Sukmantalya from
Bakosurtanal, had a scale of 1 :50000.
3.3 Required Tools
In this study, we used some supporting tools, in terms of software and hardware as
the followings:
3.3.1 Software
-
ER Mapper 5.5 is a powerful, easy-to-use geographical data viewer and processor that operating system can be run on PC Windows 95, Windows-
Banten Bay Information System 3.0 is powerful, easy-to-use ecosystem data, Banten bay database and geographic information for planning anddeveloping. Moreover, to take care for the provision of environmental
information
-
ArcView GIS version 3.1 is powerful, easy-to-use tool that brings geographic information, gives the power to visualize, explore, query andanalyze data spatially
- Microsoft Excel 2002 and Arcflnfo version 3.5 might be use as supporting
tools
Processor need for software above as following:
- 16 MB Main Memory (expandable to 64 MB)
-
Internal 207-Mbyte and External 424-Mbyte [40U] S I Disks (total of 631- Mbyte)-
3.5-inch 1.44 Mbyte Internal floppy Disk Drive- CD-ROM drive, SCSI Peripheral Interface
-
2 Serial RS-4 ports-
8 bit, 256 Color Display3.3.2 Hardware
- PC Windows 98 Pentium(r) 111 Processor, 64 MB RAM
-
Computer Server Pentium I1 266 MHz 64 MB RAM-
Global Positioning System (GPS) Type: Navigation GPS, hand-held, Trade mark: Garmin, I11 plus- Laser Printer Type: Hewlett Packard, Laserjet 6L GOLD
3.4 Methodology
The methods were used for this study has three main tasks as described below; and
Satellite Imagery Satellite Imagery -Landsat-5 TM 1994 -Landsat-7 ETM * 200 1
Change Detection Supervised Classification
0
Classification Image ProcessingRed Green Method
Principal Component
References
= Data
Result
h
ImageAnalysis
I I
[image:118.595.27.530.61.699.2]= Main process
... = Supporting Data Uses
----_-__---
1
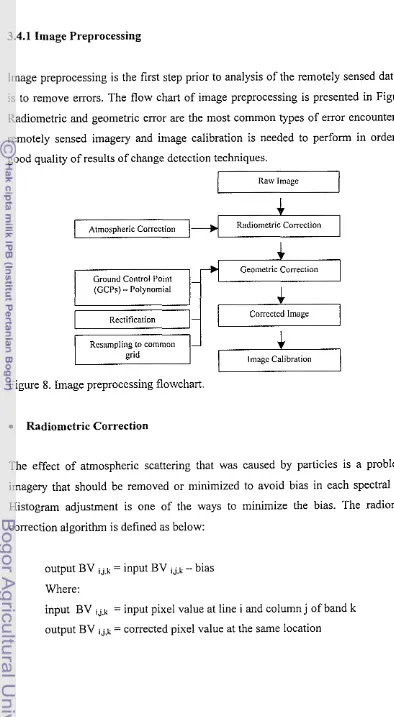
3.4.1 Image Preprocessing
lmage preprocessing is the first step prior to analysis of the remotely sensed data that
is to remove errors. The flow chart of image preprocessing is presented in Figure 8.
Radiometric and geometric error are the most common types of error encountered in
remotely sensed imagery and image calibration is needed to perfom in order to a
good quality of results of change detection techniques.
I
Raw lmage4
Radiometric Correction
Geometric Correction
(GCPs) - Polynomial
Rectification
Resampling to common
[image:119.599.77.471.64.781.2]Image Calibration
Figure 8. Image preprocessing flowchart.
Radiometric Correction
The effect of atmospheric scattering that was caused by particles is a problem in
imagery that should be removed or minimized to avoid bias in each spectral band.
Histogram adjustment is one of the ways to minimize the bias. The radiometric
correction algorithm is defined as below:
output BV ij.k = input BV i j , ~ -bias
Where:
input BV ij,l; = input pixel value at line i and column j of band k
0 Geometric Correction
Geometric correction that is commonly used to make digital remote sensor data truly
useful is geometric rectification. Geometric rectification is the process of using
Ground Control Points (GCPs), which are selected to transform the geometry of the
images so that each pixel corresponds to a position in a real world coordinate system.
Rectification is the process by which the geometry of an image area is made plane
metric (Jensen, 1986).
The basic operations in geometric rectification:
-
Collect GCPIdeally x' would equal to x,,ig and y' would equal to yorig but some distortion usually
happened in GCPs collection. A simple way to measure such distortion is by
computing the RMS error for each control point using the equation as below:
RMScrror = J(xl-xorig 12
+
( y P - y o r i g )2Where:
xOri, and yorig = the original row and column coordinates of the GCP in the
image
x' and y' =the computed or estimated coordinate in the original image
RMS threshold is 0.5 pixel or RMS,,,, < 0.5, and less then 0.5 pixels is expected.
- Transformation
Use equation solution to transform the entire image. Polynomial (Control Point) is
used as type of rectification. Coordinate transformation equations can be used to
interrelate the geometrically correct (map) coordinates and the distorted image
- Resampling
Resampling is used to determine the pixel values to fill into the output matrix from
the original matrix (Lillesand Kiefer, 1994). Resampling technique chosen is nearest
neighbor. The value for a pixel in the output image could be assigned simply on the
basis of the value of closest pixel in the transformed image.
e Image Calibration
Image calibration is needed to enhance two images by checking the mean DN values
for the dark and bright features at the same location and then define polygon by
drawing training regions. The second image was performed statistics and
transformation the second image linearly shown as below:
Y I = a X l + b , Y 2 =aX2+b
Where:
Y I : Bright Value of image 1994
Y2: Dark Value of image 1994
X I : Bright Value of image 2001
X2: Dark Value of image 2001
From the means summary report (Derived from ViewIStatistics) and formula above.
After computing and getting the value for a and b, each band (6 bands) was then
substituted in the formula editor dialog box of the algorithm window dealing with
image 2001.
3.4.2 Image Processing Area of Interest (AOI)
Area of interest was prepared by cropping the images of study area. When possible
areas that were covered with cloud were avoided. This is important for saving disk
0 Define Training Area
Before performing supervised classification, there is a need to select training regions,
where annotation tools were used to draw polygons defining training regions in the
image (areas of known feature types of cover and then calculate region statistics).
Calculate statistics for pixels in each training region. Evaluate the class signatures,
view and evaluate the statistics for training regions in tabular format or graphical
format using histogram or scattergrams. Concerning regions: regions are vector
polygons that define an area of interest in an image. Regions can be used to process
or display parts of an image separately from others, masking out parts of an image for
mosaicing. The definition of each region is stored in the header file for the raster
dataset (ER Mapper, 1997).
*
Supervised ClassificationThe objective of these operations is to replace visual analysis of the image data with
quantitative techniques for automating the identification of features in a scene. This
involves the analysis of multispectral image data and the application of statistically
based decision rules for determining the coastal landuse identity of each pixel on an
image. These procedures fall into the domain of spatial pattern recognition. The intent
of the classification process is to categorize all pixels in a digital image into one of
several coastal landuse classes. The general guide steps taken in this study are
presented below:
-
Classification scheme- Initial image display
- Image interpretation
- Training site selection
- Statistic extraction
- Accuracy assessment
The overall accuracy of classified image is computed by dividing the total number of
correctly classified pixels by the total number of reference pixels. The accuracies of
individual categories calculated by dividing the number of correctly classified pixels
in each category by the total number of pixels.
e Change Detection Techniques
In this study change detection techniques were composed of four methods, which
included with Red Green Method, Image Differencing Method, Image Ratioing
Method and Principal Component Analysis Method. Red Green Method is a widely
used technique, and is particularly useful for interactive viewing of change area. This
technique involves displaying simultaneously one dataset in green and one dataset in
red. The output combined images containing mainly shades of yellow (indicating the
same response between dates), but areas that have changed, appear as green or red.
Red areas tend to have more contrast than green areas, therefore, it is suggested that
the most current image be used so that the red layer is increased in pixel brightness
and vice versa. A viewing scale 1: 20000 or larger is ideal for panning across the
image to delineate areas of interest. This technique is most effective where the
magnitude of the areas to be found is anticipate being quite large, such as, cleared
fields or changes in crop growth.
Image Differencing Method is perhaps the most simple of all change detection
techniques. It is based upon the principle that by subtracting the pixel responses in
one image from the corresponding pixel responses in another image, any negative
value in the output image represents an increase or decrease in pixel response
depending on the order of subtracting.