i
FLAME IMAGING USING COMBINATION OF LED AND OPTICAL SENSOR
MOHD AL- AMIN BIN MAT DRIS
This Report Is Submitted in Partial Fulfillment of the Requirements for the award of Bachelor of Electronic Engineering (Industry Electronics) With
Honours
Faculty of Electronic Engineering and Computer Engineering Universiti Teknikal Malaysia Melaka
ii
FLAME IMAGING USING COMBINATION OF LED AND
OPTICAL SENSOR
mengaku membenarkan Laporan Projek Sarjana Muda ini disimpan di Perpustakaan dengan syarat-syarat kegunaan seperti berikut:
1. Laporan adalah hakmilik Universiti Teknikal Malaysia Melaka.
2. Perpustakaan dibenarkan membuat salinan untuk tujuan pengajian sahaja.
3. Perpustakaan dibenarkan membuat salinan laporan ini sebagai bahan pertukaran antara institusi pengajian tinggi.
4. Sila tandakan ( ) :
SULIT*
(Mengandungi maklumat yang berdarjah keselamatan atau kepentingan Malaysia seperti yang termaktub di dalam AKTA RAHSIA RASMI 1972)
TERHAD* (Mengandungi maklumat terhad yang telah ditentukan oleh organisasi/badan di mana penyelidikan dijalankan)
TIDAK TERHAD
Disahkan oleh:
__________________________ ___________________________________
(TANDATANGAN PENULIS) (COP DAN TANDATANGAN PENYELIA)
Alamat :JLN Bendang Keladi, KG Panglima Bayu, 17510, Tanah Merah,
iii
“I declared that this thesis is the result of my own work except the ideas and summaries which I have clarified their sources.”
Signature : ………
Writer : MOHD AL-AMIN BIN MAT DRIS
iv
“I hereby declare that I have read this report and in my opinion this report is sufficient in terms of the scope and quality for the award of Bachelor of Electronic
Engineering (Telecommunication Electronic) With Honours”
Signature : ………
Supervisor’s Name : EN ADIE BIN MOHD KHAFE
v
DEDICATION
vi
ACKNOWLEDGEMENT
Firstly, I would like to thank Allah because with His blessing I am able to prepare this report and final project for Universiti Teknikal Malaysia Melaka. I wish to thank all those who helped and encouraged me to complete my Bachelor of Electronic Engineering (Industry Electronics).
I would like to extend my sincere gratitude to my supervisor, En Adie bin Mohd Khafe, for his assistance and guidance toward the progress of this thesis project. Through the year, En Adie has been patiently monitoring my progress and guided me in the right direction and offering encouragement. Obviously the progress I had now will be uncertain without his assistance.
Special thank to my friends Hafiz Nazar, Akwanizam and all my housemate for giving me support and encourage me to finish this report.
This project would not have been like this if they not given great support and encouragement on me when other academic assignments and test has pressured me. The golden glory for me was during accomplishing this project is when my project successfully completed in the right path.
vii
ABSTRAK
viii
ABSTRACT
x
4.1.3 Get the output from multimeter and
Oscilloscope 31
4.1.2 Result For PSM II 34
4.2.1 Receiver circuit 34
4.2.2 Transmitter Circuit 36
xi
CHAPTER TITLE PAGE
5 Conclusion and Future Work 46
5.1 Conclusion 46
5.2 Suggestion for future work 47
REFERENCES 48
Appendices A Project Planning 49
Appendices B SHF203 Photodiode Datasheet 50
Appendices C TL084CN Datasheet 64
xii
LIST OF TABLES
TABLE TITLE PAGE
1.1 Schedule for PSM 1 5
1.2 Schedule for PSM II 5
2.1 Sensor Grouping 11
2.2 LED Wavelength 19
xiii 3.4 The Color scale Used to Convert the Concentration Matrix 29
xiv
4.15 Loading the Data 39
4.16 Image Regenerate 40
4.17 Concentration Profile during No Flame Condition 41
4.18 The Figure Fulfill the Condition 42
4.19 Half Open 43
4.20 Full Open 44
xv
LIST OF SYMBOLS
(
,)
LBPV x y = Voltage distribution obtained using LBP algorithm concentration profile in unit (volt) an n x m matrix where n equals to dimension of sensitivity matrix.
, Rx Tx
S = Signal loss amplitude of receiver Rx-th for projection Tx-th in unit of volt.
(
)
, ,
Tx Rx
xvi
LIST OF APPENDICES
APPENDIX TITLE PAGE
Appendices A Project Planning 49
Appendices B SHF203 Photodiode Datasheet 50
Appendices C TL084CN Datasheet 56
Appendices D LED Datasheet 70
1
2
Process tomography refers to any tomography method used to measure the internal stateof a heatedprocess(e.g. heatingdistribution in a furnaceand heating in boiler system). By tomography techniques, it can measure and display an image of heat distribution or can monitoring a location that had been heat. This type of information is not usually obtainable with the sensor traditionally used by engineer, therefore these techniques gives a better understanding of the heat system in the furnace through the plant and the data can be used to design better process equipment and to control certain processes to maximize yield and quality.Basically, in a tomography system several sensors are installed around themodel of furnace to be imaged. The sensor output signals depend on the position of the component boundaries within their sensing zones .A computer is used to reconstruct a tomography image of the cross-sectionbeing interrogated by the sensors. Real time images can be obtains which measure the dynamic evolution of the parameters being detect at t the sensors.
1.1 Process Tomography
Process tomography involves the use of non-invasive sensors to acquire vital information in order to produce two or three dimensional images of the dynamic internal characteristics of process systems. Information can assist in the design of process equipment, verification of existing computational modeling and simulation techniques, or to assist in process control and monitoring.
At present, the usual objectives of using tomography systems is to obtain concentration profiles of moving components of interest within the measurement section in the form of a visual image, which is updated at a refreshment rate dependent upon the process being investigated.
3
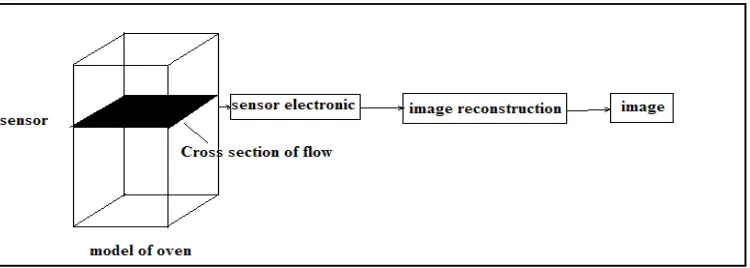
1. The sensor and sensor electronics. The field sensing pattern of the sensors is also important, as it is related to the choice of image reconstruction algorithm.
2. Image reconstruction, which includes extraction of image characteristics and reconstruction of the image.
4. Image interpretation, to give the desired information on the heat, such as the heat distribution in the furnace or oven can be calculated and monitor.
Figure 1.1 Basic schematic Diagram of Tomography System
4
1.2Objectives Of The Project
The aim of this project is to know the heat distribution based on tomography process. The objectives of this project are:
1 To design and implement LED and optical sensor based tomography system for heat distribution.
2 To construct the model of oven for installing the sensor.
3 To design and implement voltage linear back projection (VLBP) using visual basic to obtain cross-section image.
4 To design the circuit and implement data to manipulate in the program.
5 To display an image of heat distribution.
1.3 Scope Of The Project
This project is divided into two parts, which the first parts is hardware development and the second part is software development which include interfacing witch the data acquisition system (DAQ).
5
1.4 Project Plan
Schedule for the project are shown below. This project is based on the project planning schedule. For PSM I, the project started from July to October 2008. The project planning schedule is shown in Table 1.1 and for the PSM II the schedule is shown in table1.2
Table 1.1 Schedule for PSM I
6
1.5 Thesis Outline
Chapter 1 present an overview of the process tomography, the objectives of the project, scope of the project, project planning and thesis outline.
Chapter 2 provides literature review which includes the tomography technique, Sensor type and selection photodiode, and orthogonal projection technique
Chapter 3 consist of explanation about methodology which covers about emitter and receiver, The design of optical receiving circuit, DAQ card and Visual Basic (VB) and Linear back Projection (LBP) Algorithm
Chapter 4 shows a result during PSM I and PSM II which include testing, experiment, constricting a jig and etching a circuit.
7
CHAPTER II
LITERATURE REVIEW
2.0 Tomography Technique
Tomography techniques vary widely in their instrumentation and applications, all of them can be characterized by a common two-step approach to the imaging process; firstly gather projection data based on some physical sensing mechanism, then reconstruct a cross sectional image from the projections. The term "projection" has a specific meaning in tomography which a projection can be visualized as type of radiography of the process vessel [4].
In tomography, many projections are needed to reconstruct the interior volume or cross-section of an object. Projections actually can be referred as sensor arrangement. In practical systems, there are two types of projection that have been investigated and applied to measure flame, which are:
1. Parallel projection. 2. Fan bean projection.
8
Only correspond to its emitter source, while for fan beam projection, the number of emitter and receivers can be unequal [5].
Nevertheless, the fan beam projection technique provides a higher resolution system compared to the same number of sensors used in parallel projection due to high obtaining information several projections are needed to reduce aliasing which occurs when two particles intercept the same view. [6]
However from both methods it can be illustrated into a various techniques of arrangement which all of that has been widely investigated to implement into flow imaging of conveying system. The various arrangements can be illustrated into six types of projection, which are:-