Abstract—In Wireless Mesh Network (WMN) the mesh nodes (APs) are configured with the same frequency channel creates a phenomenon called as co-channel interference. The purpose of selecting the same frequency channel is to make sure all the mesh nodes can talk each other within the frequency range. In order to study the effects of this phenomenon together with multipath fading for indoor environment, we have setup a wireless mesh network operating at 2.4GHz inside a 4-floors faculty building. Extensive measurement campaigns have been conducted at each floor. To observe the effects of these phenomena at the application layer perspective, we measure the network throughput and mapped it to the physical layer performance parameter; received power. The relationship between the application and physical layers performance parameters is modeled numerically and the results are analyzed. One interesting finding is that the empirical relationship model for wireless mesh network does not follow the common exponential models as known in Wireless Local Area Network (WLAN). We can say that the throughput drop is too small and can be neglected and the average throughput is at 1.53Mbps over all received powers. The result shows that the effects of both co-channel interference and multipath are very severe and need to be tackled properly in wireless mesh network design and deployment.
Index Terms—Throughput, power received, wireless mesh
network.
I. INTRODUCTION
ECENTLY, wireless communication systems present increasing needs for detailed planning due to the reduction of cell size in mobile systems and the rising number of various wireless networks technologies such as wireless mesh network topology. To comprehend the mesh networking concept, it is indispensable to have an interpretation of what a mesh topology represents. When there are n nodes in a network, where the term “node” refers to a communication device with ability to convey data from one of its interfaces to another, then the ability of each node to communicate with every other nodes in the network represents a mesh network topology [1].
Figure 1 depicts three, four, and five mesh nodes, in which each node connected to other mesh nodes in the network. The connection between each node is referred to as a link. From the number of links associated with each network shown in Figure 1, it is obvious that the number of links increases as the number of nodes increases. Although it is merely three links are required to interconnect three nodes, six are required to interconnect four nodes, and ten are required to interconnect five nodes [1].
Figure 1: In a true mesh network architecture, each node connected to every other node in the network [3]
Modeling and Performance Analysis of
Throughput-Received Power Relationship for
Indoor Wireless Mesh Network
M. S. Zakaria, M. R. Ahmad, M. S. Johal, and M. K. Suaidi
Faculty Electronic & Computer Engineering, Universiti Teknikal Malaysia Melaka (UTeM) Hang
Tuah Jaya, 76109 Durian Tunggal Melaka, Malaysia
[email protected], [email protected]
Phone No: +6065552111/Fax No: +6065552112
II. WIRELESS MESH NETWORK
WMN is dynamically self-organized and self-configured, with the nodes in the network automatically establishing an ad hoc network and maintaining the mesh connectivity. WMN consist two types of nodes: mesh routers and mesh clients [2]. Router also called Full Function Devices or FDD, extend the network coverage, dynamically route around obstacles, and provide backup routes in case of network congestion or device failure. They can connect to the coordinator (device that sets up the network and acts as a portal to monitor network performance and configure parameters) and other routers, and can also have child devices. Note that in a wireless mesh networking, each node functions as a router and repeater, forwarding data to the next node to function as a relay.
WMN is a distributed networking technology that is currently being adapted to connect peer-to-peer clients and large-scale backbone networks. Capacity is a very significant metric for wireless mesh networks due to its highly distributed characteristics. To improve the capacity for distributed mesh networks, various high-speed techniques for the physical layer have been developed. Orthogonal Frequency Multiple Access (OFDM) for 802.11 is one of the high-speed improvements in the PHY layer for WLAN by increasing the speed from 11Mbps to 54Mbps [3]. Further improvement incorporates multiple antennas technology known as In Multiple-Out or MIMO to boost the throughput up to 100Mbps.
A. Interference from Other 802.11 Sources
One of the WMN objectives is to wider the coverage range of current wireless network without scarifying the throughput and channel capacity. Another objective of WMN is to provide non-line of sight (NLOS) link between nodes without direct line of sight (LOS) connectivity. In order to achieve all the objectives, the mesh-style multi-hopping with less interference between the communicating nodes is required [4]. However there are lots of 802.11 sources that operate at 2.4GHz band or ISM band that can interfere with the mesh AP frequency channel. Furthermore in ISM band, there are only 3 non-overlapping frequency channels that available for the user. So there will be high possibility of the co-channel interference to be occurred at this frequency channel. Once the frequency channels of the nodes interfere to each other, packet could be lost from other 802.11 senders on the same channel or from overlapping channels. These packets might be data or the periodic 802.11 beacons. Data traffic can be burst while beacons would likely maintain a relatively steady rate. Generally speaking when the non-intentional interferers such as Bluetooth nodes and microwave ovens transmit in the same band and in the same area, they typically emit signals whose structure is very different compared to the desired signal. They may transmit their signal while a desired transmission is in progress and leading to damage packets that need to re-transmit. This scenario indirectly will impair the wireless network throughput.
B. Multipath Fading
The multipath fading phenomenon can lead to the inter-symbol interference. It is occur when the desired signal arrives at the intended node through multipath or several different paths [4]. Multipath is caused by object that can affect the direct wave propagation to be deviated from its origin path. The physics that cause multipath signals are quite complex and described statistically by an appropriate model. However they can be described through the basic propagation mechanisms which are reflection, diffraction and scattering phenomena. Normally for indoor environment, objects always have a certain thickness, as shown in Figure 2. In addition, they also introduce losses. Generally, when a ray in air illuminates an object, a reflected ray and a refracted ray are produced in the upper and lower areas of the space, respectively. The reflected rays can be considered to be the rays coming from the mirror image of the object. The refracted ray, in the lower area of the space, is parallel to the incident ray, but it has a deviation, Δd, as shown in Figure 2:
Δd = d sin (θi – θt) / cos θt (1)
where θi and θt are the angles of incidence and refraction, respectively. In an indoor environment, the thickness of a typical wall is 20 to 30 cm, so, generally, the distance between the refracted ray and the incident ray may be less than 20 cm. If the thickness of the wall is larger, the refracted ray may be too weak to be considered in the calculation.
Diffraction is the bending of a wave around objects or the spreading after passing through a gap. It is due to any wave's ability to spread in circles or spheres in 2D or 3D. Space diffraction processes are most noticeable when the obstruction or gap (aperture) is about the same size as the wavelength of the impinging wave. Scattering happens when the desired wave impinge on object that significantly smaller that its wavelength such as the foliage. Scattering causes the wave to disperse in many different directions.
Figure 2: The general situation of reflection and refraction in an indoor environment. [5]
III. EXPERIMENTAL SETUP
A. Test-Bed Development
The IEEE 802.11n standard has been used for the test-bed development. The test-bed was setup for performance measurement of both WLAN and WMN. The base station has been configured to support both WLAN and WMN by using Wireless Distribution System (WDS) features that provided by openwrt firmware. Details of the measurement equipment specification are listed in Table 1. Single access point was configured as an infrastructure network for WLAN setup and placed at a specific location. Three access points with WDS features were placed at three different location of the faculty administration building for WMN testing. Measurement of RSSI and throughput were then made at perticular location by using mobile computer or the laptop with wireless cards such listed in Table 1. The specification of the laptop are depicted in Table 2. Both of the WLAN and WMN test-beds have been setup at different times. But, all the access points and clients were placed at the same locations for every measurement campaign. So that, performance both of the WLAN and WMN could be compared in the identical environment.
B. Measurement Campaign
In order to evaluate wireless network performance for a specific site, it is necessary to conduct measurement campaigns to ensure that the acces points can provide optimum coverage to the clients that associated with it. The measurement campaigns for this project have been conducted for indoor scenario inside administration building of Faculty of Electronic and Computer Engineering, UTeM.
In WLAN measurement campaign, only one AP is installed at the third floor of the faculty building. 36 arbitrary points were selected for measurement of the signal strength and the throughput. In WMN installation, the APs were deployed at administration building. All the APs have been configured to support WMN configuration where all the APs are connected to each other using wireless distribution system (WDS) setting. There were 36 points of receivers placed at the third and second floor, 18 points at the first floor and 13 points at the ground floor where the measurement took place. The Received Signal Strength Indicator or RSSI had been captured in dBm unit by using Xirrus Wireless Monitor software. Meanwhile IxChariot software had been used to
complete the throughput test for various wireless
applications including the send and receive e-mail (SMTP and POP3) services, file transfer protocol (FTP) services and hyper text transfer protocol (HTTP) services. From the collected raw data of throughput and RSSI, the relationship between these two data is modeled and then analyzed.
IV. RESULTS AND DISCUSSION
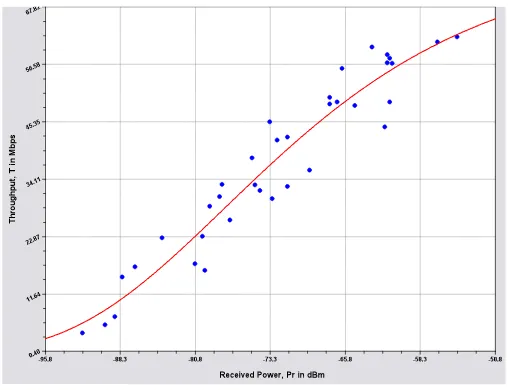
Figures 3 and 4 show the throughput-received power relationship for both WLAN and WMN. We can observe that the maximum achievable throughputs are 62.2 Mbps and 2.80 Mbps for WLAN and WMN respectively at 54.5dBm and -41dBm. There are 92.47% of different between the maximum throughputs for the WLAN setup compare to WMN at their maximum Pr value.
Furthermore we can observe that the minimum achievable throughputs are 4.0 Mbps and 1.4 Mbps for WLAN and WMN respectively at -92dBm and -73.5dBm. This shows 65% of different between the WLAN minimum throughputs compare to WMN at the lowest Pr value of WLAN and -73.5dBm of WMN setup. While the lowest Pr value of WMN setup was -82.5dBm.
Table 1. Wireless Equipment Used in Network Performance Measurements
Technology Wireless-N Gigabit
System Type IEEE 802.11 b/g/n
Maximum Throughput 150Mbps
Access Point Type Linksys 310N
Access Point
Transmit Power 17dBm
Access Point
Antenna Gain 2.2dBi
Client Card Type Linksys WUSB300N
Client Card
Transmit Power 14+/-1dBm
Client Card
Antenna Gain 2.8dBi
Table 2. Clients (Laptop) Specification for Network Performance Measurements
Computer Name Client
Operating System Windows XP Processor Intel Core 2 Duo
2.4GHz
RAM 3 Gigabytes
Measurement Software Xirrus Wi-Fi Monitor and IxChariot
Figure 3: Throughput-Received Power Relationship for WLAN
Figure 4: Throughput-Received Power Relationship for WMN
Figure 3 shows that the WLAN throughput is exponentially proportional to the received power. Although the WLAN system experiencing multipath and fading due to indoor environment, it is clear that maximizing the received power by minimizing the effects of multipath and fading will maximize the network throughput.
On the other hand, Figure 4 shows different pattern for the WMN throughput-received power relationship model due to co-channel interference. We can see that the throughput is almost constant at average of 1.53 Mbps over all received powers. It is clear to us that we cannot maximize the mesh network throughput by just minimizing the effects of multipath and fading or by using adaptive modulation technique. Other measures must be used to minimize the effect of channel interference. It is important to notice that co-channel interference reduces the throughput by almost 97.5% compared to the maximum achievable throughput in WLAN system.
From WMN throughput-received power relationship empirical data, we model the relationship mathematically by using quadratic fit.
T = a + (b x Pr) + (c x Pr2 ) (2)
where a = 2.7676, b = 0.0331 and c = 0.0002 are constant, T is the network throughput and Pr is the received power.
V. CONCLUSION
The test-bed of WLAN and WMN systems have been setup in order to characterize the throughput-received power correlation. It is common to obtain high throughput with high received power value in WLAN system which has been proved through the correlation model. However in WMN system there are more than two APs are installed. Since every AP is configured with the same frequency channel, the co-channel interference phenomenon degrades the throughput value even though the RSSI is stronger (<-60dBm). This characteristic has been proved through the correlation model of the throughput-received power for the WMN.
REFERENCES
[1] Gilbert Held,” Wireless Mesh Networks”, Taylor & Francis Group, United State 2005
[2] Ian f. Akyildiz, Xudong Wang, Kiyon “A Survey on Wireless Mesh Networks”, IEEE radio communications Magazine, Vol. 43, pp. S23 - S30, September 2005
[3] John Paul M. Torregoza, Won-Joo Hwang “channel Multi-Transceiver Routing Protocol for Wireless Mesh Network”, pp. 12-14, February 2007
[4] Saumitra M. Das, Dimitrios Koutsonikolas, Y. Charlie Hu, and Dimitrios Peroulis, “Characterizing MultiWay Interference In Wireless Mesh Networks”, International Conference on Mobile Computing and Networking, pp. 57 – 64, 2006
[5] Zhong Ji, Bin-Hong Li, Hao-Xing Wang, Hsing-Yi Chen, and Tapan K. Sarkar, “Efficient Ray-Tracing Methods for Propagation Prediction for Indoor Wireless Communications,” IEEE Antennas and Propagation Magazine, Vol. 43, pp 41-49, April 2001
[6] Mihail L. Sichitiu, "Wireless Mesh Networks: Opportunities and Challenges," Proc of the Wireless World Congress, (Palo Alto, CA), May 2005.
![Figure 1: In a true mesh network architecture, each node connected to every other node in the network [3]](https://thumb-ap.123doks.com/thumbv2/123dok/621753.74961/1.612.335.540.362.675/figure-true-mesh-network-architecture-node-connected-network.webp)