Volume 2013, Article ID 742853,9pages http://dx.doi.org/10.1155/2013/742853
Research Article
Characterisation of Structure-Borne Sound Source Using
Reception Plate Method
A. Putra, N. F. Saari, H. Bakri, R. Ramlan, and R. M. Dan
Sustainable Maintenance Engineering Research Group, Faculty of Mechanical Engineering, Universiti Teknikal Malaysia Melaka, Hang Tuah Jaya, Melaka, 76100 Durian Tunggal, Malaysia
Correspondence should be addressed to A. Putra; [email protected]
Received 29 August 2013; Accepted 22 September 2013
Academic Editors: K. Dincer and M. H. Ghayesh
Copyright © 2013 A. Putra et al. his is an open access article distributed under the Creative Commons Attribution License, which permits unrestricted use, distribution, and reproduction in any medium, provided the original work is properly cited.
A laboratory-based experiment procedure of reception plate method for structure-borne sound source characterisation is reported in this paper. he method uses the assumption that the input power from the source installed on the plate is equal to the power dissipated by the plate. In this experiment, rectangular plates having high and low mobility relative to that of the source were used as the reception plates and a small electric fan motor was acting as the structure-borne source. he data representing the source characteristics, namely, the free velocity and the source mobility, were obtained and compared with those from direct measurement. Assumptions and constraints employing this method are discussed.
1. Introduction
he structure-borne sound is still a challenging problem in engineering especially in buildings where machineries such as fans, compressors, hydraulic equipment, electrical motors, heating pumps, washing machines, and air conditioning system can produce a considerable amount of vibration [1]. he transmitted vibration waves do not only cause noise but also are hazardous to the building structure. Such machines are called structure-borne sound sources.
he symptom before the structural damage due to the efect of vibration is sometimes not visible. With the infor-mation of the vibration level strength of the structure-borne sound source, a preliminary control measure can be planned. his is where characterisation of the source becomes important [2]. Unfortunately, determination of the “behaviour” of the structure-borne source is more diicult compared to airborne source because the machine’s vibration energy transmits to the supporting structure in a complicated motion [3]. It is signiicant to know as much information as possible not only about the source but also about the receiver structure to obtain the dynamic characteristics through the contact points represented by the mobility, that is, the ratio of the response velocity to the excitation force.
For structure-borne source characterisation, the recep-tion plate method as a laboratory measurement test has been proposed [4, 5]. he vibration source is installed on the reception plate where it is assumed that the injected power by the source is equal to the power dissipated by the plate. By employing reception plates having mobility much greater or much lower than that of the source to enforce simpliication in the mathematical model, from here, the free velocity of the source as well as the source mobility can be obtained [6]. However, using the plate power equation [7] in the reception plate method requires difuse ield vibration in the reception plate where the modal density should be suiciently high. his is convenient for thin and high mobility plate, but problematic for the thick and low mobility plate.
ZS
f
(a)
ZS
FB
(b)
Figure 1: Free velocity and blocked force.
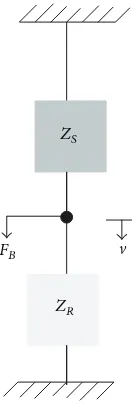
ZS
FB
ZR
Figure 2: A source connected to a receiver.
2. Mathematical Formulation
2.1. General Formulation. Consider a vibrating source with impedance�� freely suspended and vibrates with velocity
V�as shown inFigure 1(a). Without the presence of load or receiver structure to be attached, the velocity is called the “free velocity.” If the source is then attached rigidly on a rigid surface as inFigure 1(b), the injected force��by the source is called the “blocked force”. From deinition
��= ��V�; ��= V�
��, (1)
where��= �−1� is the mobility of the source.
Consider now the source is rigidly connected to a receiver structure with impedance �� as shown in Figure 2 and because of the rigid connection assumption, both the source and receiver move in the same velocityV. he blocked force at
the contact point is now the sum of the force from the source
��and that applied to the receiver��[8]. he blocked force
can thus be written as
��= ��+ ��= (��+ ��)V. (2)
Equation (2) can be rearranged to obtain the velocity at the contact point in terms of the source and receiver mobili-ties as well as the free velocity expressed as
V= ��
(��+ ��)=
V���−1
1/��+ 1/�� = ��(��+ ��)−1V�. (3)
he vibration input power injected into the receiver is given by
�in= 12Re{��∗V} = 12Re{��}V2, (4)
where�∗is the complex conjugate of�.
Assuming that the source is now attached to the receiver through�contact points, the formulation can be represented in terms of vectors and matrices given by
�in= 12Re{F��v} = 12Re{v�Z��v} , (5)
whereF�and v are column vectors of size� × 1and the
impedanceZis a� × �matrix. he superscript�denotes
the conjugate transpose. By substituting (3) into (5), the input power can be expressed as
�in= 12Re{v��[Y�+Y�]−�Y�[Y�+Y�]−1v�} . (6)
In terms of the blocked force, (6) can be rewritten as
�in= 12Re{F��[Z�+Z�]
−�Z�[Z
�+Z�]−1F�} . (7)
Consider now two extreme cases for idealisation where either the source has very high or very low mobility compared with that of the receiver. If the source has very low mobility so that|��| ≪ |��|, (6) reduces to
�in= 12Re{v��[Y�]
−�v�} . (8)
An example of this condition is a solid massive vibrating machine attached on a lexural loor. his type of source behaves as a “velocity source” which means that the velocity input to the receiver is insensitive to the dynamic behaviour of the receiver [9].
he second condition is where the mobility of the source is much higher than that of the receiver, so that|��| ≫ |��| or|��| ≪ |��|. hus, (7) becomes
�in= 12Re{F��[Z�]
−1F
�} = 12Re{F��Y�F�} . (9)
2.2. Mobility Simpliication. From (9) and (8), the mobility matrixY�for�contacts involves six components of
excita-tions, that is, three translational and three rotational where
6� × 6� matrix size is therefore required. However, to simplify the problem, only translational force perpendicular to the receiver is taken into account. he matrix size reduces to� × �given by
where���is the point mobility for� = �and transfer mobil-ity for� ̸= �. At one point, the efect of other adjacent points can be represented by “collapsing” the point mobility and the transfer mobilities into a single mobility using the concept of efective mobility where for zero and random phase assumption between points, they are, respectively, expressed as [10]
2.3. Reception Plate Power. he reception plate method is a technique where a vibrating source under normal operating condition is connected to a lat plate structure. he total struc-ture-borne power of the source is equal to the power gener-ated on the plate given as [7]
�Total
in = �����⟨V2�⟩ , (13)
where��is the total mass of the plate,��is the total damping loss factor of the plate,�is the operating frequency, and⟨V2�⟩
is the spatial average of mean-squared velocity.
For the case where the structure-borne sound source has much lower mobility than that of the reception plate,|��| ≪
|��|, employing the efective mobility in (11) or (12), (8) can therefore be written as
�Total
Assuming small variations of efective mobility among the contact points, (14) can be further simpliied as
�Total
where ��Σ is average efective mobility across all contact points. From the reception plate power in (13), thus
�����⟨V2�⟩ = 12Re( 1
Figure 3: Comparison of measured average mobility from the high mobility reception plate and the fan motor: narrow band (solid line) and one-third octave band (dashed line).
As seen in (16), the total squared free velocities∑�� |V��|2can be obtained from the reception plate method.
For the case where the reception plate has much lower mobility than that of the structure-borne source,|��| ≪ |��| and again assuming small variations of the mobilities, (9) becomes
with ���Σ being the efective mobility of the source at the
�th contact ponint. Again using the reception plate power and assuming small variations of source mobility across the contact point give
From (19), the average source mobility���Σ of the structure-borne sound source can now be obtained by also using the results of the total squared free velocity∑�� |V��|2measured
from the high mobility reception plate in (16).
3. Reception Plate Experiment
101 102 103
Figure 4: Efective mobility of the high mobility reception plate assuming: (a) zero phase and (b) random phase.
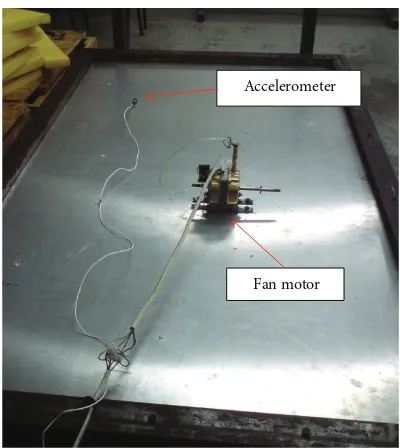
electric fan motor was used as a structure-borne source mounted rigidly on four contact points and operated at normal speed condition.
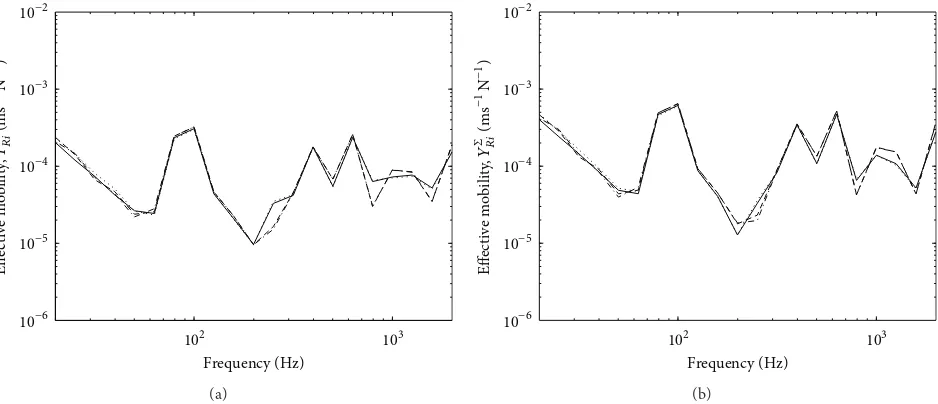
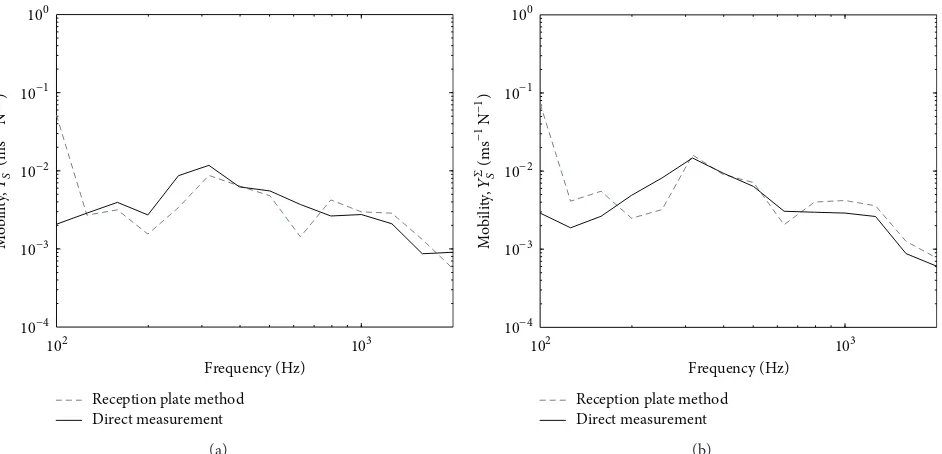
3.1. High Mobility Reception Plate. he high mobility plate in the experiment used an aluminium plate having thickness of 1 mm and dimensions of1.4 × 0.8m. he plate was clamped with a steel frame and mounted on four rigid stands. Point mobilities were taken at four contact points (where the source was to be attached) using Kistler impact hammer Type 9722A500 and Kistler accelerometer Type 2021514. Mobil-ities at the motor feet were also taken.Figure 3shows the comparison of the averaged mobility between the plate and the motor where across the frequency particularly above 600 Hz, the mobility diference is 10 dB which supports the assumption used in (14).
Fan motor
Accelerometer
Figure 5: he fan motor attached on the high mobility reception plate.
Figure 6: he measured spatially average mean-squared velocity of the high mobility reception plate (grey line: one-third octave band).
Figure 4presents the variations of the efective mobilities for zero and random phase in one-third octave bands. he results for zero phase assumption from (11) as seen in
Figure 4(a) show mobility variation within 1 dB which is acceptable for (15) to be valid. Much smaller variation can be seen for random phase assumption inFigure 4(b).
101 102 103
Figure 7: he damping loss factor of the high mobility reception plate.
Accelerometer
Figure 8: Measuring the free velocity directly at the feet of the fan motor running at normal speed.
normal operating speed, the spatially average mean-squared velocity⟨V2�⟩of the plate was measured. he result can be
seen inFigure 6where it can be observed that the response dominates below 1 kHz and rolls of above this frequency.
One more parameter to be measured before obtaining the free velocity from the reception plate method is the damping loss factor of the plate (see (13)). he damping factor can be measured in a reverberation chamber where it is inversely proportional to the measured reverberation time as con-ducted in [6]. However, the damping loss factor can also be measured conveniently using the input and spatially average squared mobility of the plate given by [7]
��=
Re{��}
� ̈����⟨����������2⟩,
(20)
where �� is the point mobility and ⟨|��|2⟩ is the spatially average squared transfer mobilities. Five measurement loca-tions out of ten points for measuring the spatially average squared velocity were chosen for the measurement of input
T
Figure 9: Comparison of the squared free velocity obtained from the reception plate method (thick line) and direct measurement (thin line): (a) zero phase and (b) random phase.
and transfer mobilities. he result of the measured damping loss factor is plotted inFigure 7in one-third octave bands. Constant results can be seen above 200 Hz where the damp-ing loss factor of the plate is around 0.007.
Figure 8shows the table fan electric motor used in the experiment with an accelerometer attached on one of its L-shape feet in order to measure the direct free velocity to be compared with that from the reception plate method.
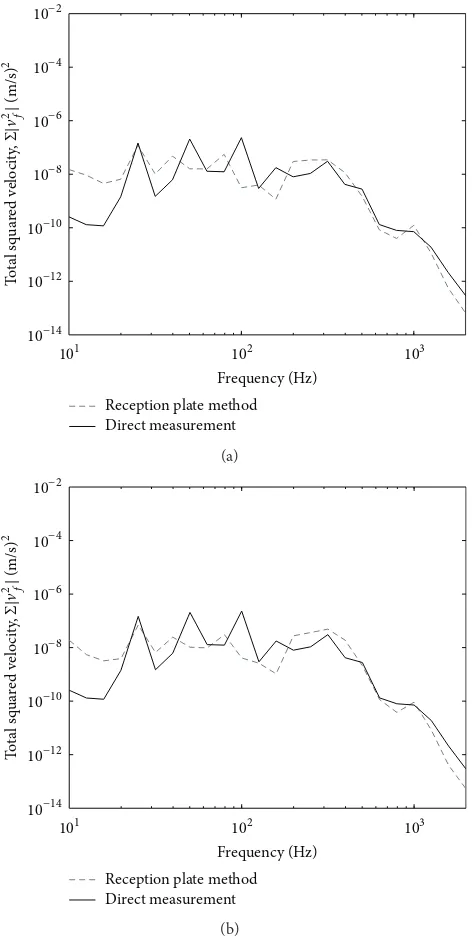
By using (19), the estimation of the total squared free velocity∑�� |V��|2of the motor can be obtained and presented
Figure 10: he electrical fan motor on the low mobility reception
Figure 11: Comparison of measured average mobility from the low mobility reception plate and the fan motor: narrow band (solid-line) and one-third octave band (dashed-line).
It can be seen that the estimated squared free velocity follows the trend of that from the direct measurement consistently. he results can be seen to have good agreement above 200 Hz within 5 dB discrepancy for both zero phase and random phase assumptions of the efective mobility. Discrepancy of 10 dB can be seen at low frequency below 100 Hz due to small modal density of the reception plate on which the reception plate power in (13) is based. he L-shape feet of the motor might also give efect it these creates high stifness
101 102 103
Figure 12: Efective mobility of source by assuming (a) zero phase and (b) random phase.
structure where vibration power from the motor was not fully transmitted to the reception plate.
3.2. Low Mobility Reception Plate. For the low mobility recep-tion plate, a 2.5 cm thick steel plate was used with dimensionts of1.24 × 0.61m as seen inFigure 10. he plate was rested on the loor where rubber pads were located between the plate and the supported bricks to prevent unwanted relected vibration waves and to let the plate to move in free-free edges. Note that in (19) the input power now also depends on the mobility of the source. Due to high stifness of the L-shape of the source feet, careful mobility measurement has therefore been taken by exciting the body of the motor as close as possible to the connection with the L-shape feet and mounted the accelerometer on each of the motor foot to record the vibration response.
102 103
Figure 13: Efective mobility of the thick plate by assuming (a) zero phase and (b) random phase.
101 102 103
Figure 14: he measured spatially average mean-squared velocity of the low mobility reception plate (grey line: one-third octave band).
Distinct peaks can be clearly seen in the plate mobility indicating low modal density of the plate. his raises problem when applying (13) where difuse ield vibration is required. However, the level of the plate mobility can be seen to be more than 10 dB lower than the source mobility which fulils the impedance mismatch assumption in (19).
Equation (19) also assumes small variation of efective source mobility. his is shown in Figure 12 for zero and random phase assumptions in one-third octave bands. he variation can be seen to be less than 5 dB for the four contact points across the frequency range except at below 20 Hz and around 120 Hz which might be due to the nature of the corresponding foot. he variation of the efective mobility of the thick reception plate can also be seen inFigure 13to be suiciently small.
Figure 15: he damping loss factor of the low mobility reception plate.
he spatially average of mean-squared velocity of the plate is shown inFigure 14. Due to small response at the locations away from the motor (e.g., near the plate edges), spatial aver-aging was only done for the measurement points close to the contact points. he response can be seen to decrease as the frequency increases.
Reception plate method
Figure 16: Comparison of the squared free velocity obtained by the reception plate method (thick line) and direct measurement (thin line): (a) zero phase and (b) random phase.
where the reception plate result follows the trend of the direct measurement, as also obtained for the total free velocity in the thin reception plate (seeFigure 9). Large discrepancy occurs below 200 Hz which is due to the low modal density of the reception plate.
4. Conclusion
Characterisation of a structure-borne source of a table fan motor using the reception plate method has been done successfully. Good agreement of the estimated free velocity and mobility of the source has been achieved from mid to high frequency. However, the use of a low mobility plate to estimate the source mobility is found to be cumbersome as it has low modal density, which is contrary to the condition required by the reception plate power. Careful measurement of the vibration velocity is therefore important to consider the modal behaviour of the plate especially at the area close the excitation point. For the future work, instead of the mean-average result, possible range of the data results of the free velocity and mobility from the measured structure-borne source in terms of its statistical variation across the frequency is also of interest to account the uncertainty coming from source and the receiver.
Conflict of Interests
he authors declare that there is no conlict of interests regarding the publication of this paper.
Acknowledgment
he authors gratefully acknowledge the inancial support pro-vided by the Ministry of Higher Education Malaysia (MoHE)
for supporting this work under Fundamental Research Grant Scheme; FRGS/2010/FKM/TK03/15-F00109.
References
[1] M. L. S. Vercammen and P. H. Heringa, “Characterising struc
ture-borne sound from domestic appliances,”Applied Acoustics,
vol. 28, no. 2, pp. 105–117, 1989.
[2] A. T. Moorhouse, “On the characteristic power of
structure-borne sound sources,”Journal of Sound and Vibration, vol. 248,
no. 3, pp. 441–459, 2001.
[3] B. A. T. Petersson and B. M. Gibbs, “Towards a structure-borne
sound source characterization,”Applied Acoustics, vol. 61, no. 3,
pp. 325–343, 2000.
[4] M. M. Sp¨ah and B. M. Gibbs, “Reception plate method for characterisation of structure-borne sound sources in buildings:
assumptions and application,”Applied Acoustics, vol. 70, no. 2,
pp. 361–368, 2009.
[5] M. M. Sp¨ah and B. M. Gibbs, “Reception plate method for characterisation of structure-borne sound sources in buildings: installed power and sound pressure from laboratory data,”
Applied Acoustics, vol. 70, no. 11-12, pp. 1431–1439, 2009. [6] B. M. Gibbs, R. Cookson, and N. Qi, “Vibration activity and
mobility of structure-borne sound sources by a reception plate
method,”Journal of the Acoustical Society of America, vol. 123,
no. 6, pp. 4199–4209, 2008.
[7] L. Cremer, M. Heckl, and B. A. T. Petersson,Structure-Borne
Sound: Structural Vibrations and Sound Radiation at Audio Frequencies, Springer, Berlin, Germany, 3rd edition, 2005. [8] P. Gardonio and M. J. Brennan, “Mobility and impedance
methods in structural dynamics,” inAdvanced Applications in
Acoustics, Noise and Vibration, F. Fahy and J. Walker, Eds., pp. 389–447, Spon Press, 2008.
[9] E. E. Ungar and C. W. Dietrich, “High-frequency vibration
iso-lation,”Journal of Sound and Vibration, vol. 4, no. 2, pp. 224–241,
[10] B. Petersson and J. Plunt, “On efective mobilities in the pre-diction of structure-borne sound transmission between a source structure and a receiving structure, part II: procedures
for the estimation of mobilities,”Journal of Sound and Vibration,
Submit your manuscripts at
http://www.hindawi.com Volume 2013Part I
Hindawi Publishing Corporation
Hindawi Publishing Corporation
http://www.hindawi.com Volume 2013 Hindawi Publishing Corporation
http://www.hindawi.com Volume 2013