Volume 2013, Article ID 624865,6pages http://dx.doi.org/10.1155/2013/624865
Research Article
Characterization of Activated Carbons from Oil-Palm Shell by
CO
2
Activation with No Holding Carbonization Temperature
S. G. Herawan, M. S. Hadi, Md. R. Ayob, and A. Putra
Faculty of Mechanical Engineering, Universiti Teknikal Malaysia Melaka, Hang Tuah Jaya, 76100 Durian Tunggal, Melaka, Malaysia
Correspondence should be addressed to S. G. Herawan; [email protected]
Received 22 March 2013; Accepted 15 April 2013
Academic Editors: B. Kuchta, A. Rodriguez, and A. Tungler
Copyright © 2013 S. G. Herawan et al. his is an open access article distributed under the Creative Commons Attribution License, which permits unrestricted use, distribution, and reproduction in any medium, provided the original work is properly cited.
Activated carbons can be produced from diferent precursors, including coals of diferent ranks, and lignocellulosic materials, by physical or chemical activation processes. he objective of this paper is to characterize oil-palm shells, as a biomass byproduct from palm-oil mills which were converted into activated carbons by nitrogen pyrolysis followed by CO2activation. he efects of no holding peak pyrolysis temperature on the physical characteristics of the activated carbons are studied. he BET surface area of the activated carbon is investigated using N2adsorption at 77 K with selected temperatures of 500, 600, and 700∘C. hese pyrolysis conditions for preparing the activated carbons are found to yield higher BET surface area at a pyrolysis temperature of 700∘C compared to selected commercial activated carbon. he activated carbons thus result in well-developed porosities and predominantly microporosities. By using this activation method, signiicant improvement can be obtained in the surface characteristics of the activated carbons. hus this study shows that the preparation time can be shortened while better results of activated carbon can be produced.
1. Introduction
Activated carbons are sorbents with a highly developed porosity, especially in the micro and meso ranges, which are used in a wide range of applications, including gas-phase and liquid-phase adsorption processes [1,2]. Activated carbons can be produced from diferent precursors, including coals of diferent ranks, and lignocellulosic materials, by physical or chemical activation processes [2,3]. In general, the principal properties of manufactured active carbons depend on the type and properties of the raw material used. Recently, increasing attention has been focused on using abundant biomass wastes as a feedstock for activated carbons. Oil-palm shell is a good candidate of raw materials for the production of activated carbon with a highly developed porosity and surface area because of the following reasons: the considerably high carbon content and relatively low price. It has been shown that the oil-palm shell has 55.7% of carbon content compared to oil-palm ibers (49.6%), cofee shells (50.3%), and sugar cane bagasse (53.1%) [4]. he relatively low price is because the raw materials are available as wastes,
where they are free to obtain in small quantity or low price in huge quantity.
Oil-palm (Elaeis guineensisJacq.) fruit is a major source of vegetable oil, which is extracted from its lesh and kernel. hey are produced mainly in South East Asia (Malaysia, Indonesia, and hailand), Africa (Nigeria and Cameroon), and several southern provinces of China. During palm oil processing, there are two major solid wastes generated, extracted lesh iber (or called mesocarp) and seed shell (or called endocarp). In Malaysia, which is the largest palm oil producer in the world, about two million tons (dry weight) of oil-palm shell and one million ton of extracted oil-palm lesh iber are generated annually. Normally, they are used as boiler fuels or building materials. herefore better utilization of these cheap and abundant wastes is proposed to convert them into activated carbons.
In mesopore (pore diameter of 2–50 nm) and macroporous (pore diameter>50 nm) materials, the pores are thought to be illed with adsorbate by multilayer adsorption upon the internal pore surface and capillary condensation. Total inter-nal surface area is therefore the primary factor controlling gas sorption in such materials.
Greater adsorption energies have been shown to exist in micropores (pore diameter<2 nm) than in transitional pores of solids of similar composition. Micropores are believed to be illed by volume illing, as opposed to layer-by-layer adsorption on the internal surface of the pores. Micropore volume therefore appears to be the main control on gas sorption for microporous materials. he proportion of the total pore volume contributed by microporosity is thus an important parameter in evaluating the gas adsorption characteristics of a solid.
In the synthesis of activated carbon by physical activation, when a particular precursor is used, it is mainly the activation process that determines the classiication of the inal material. So it is important to conduct the activation under conditions that would produce an activated carbon with desirable textural and surface chemistry properties. From the survey, it was found that the efect of activation temperature on the porosity of the activated carbon varies with the raw material, and the experimental conditions cannot be extrapolated from one precursor material to another. Consider the case of activated carbon produced from a raw material of used tires, and activated with a mixture of steam and carbon-dioxide. he BET surface area of the activated carbon increased with activation time reaching a maximum of 432 m2/g ater 120– 150 min at a temperature of 970∘C and a burn-of level of 60– 65 weight % [3].
However, at temperatures above 900∘C, the macroporous volume decreased slightly with increasing burn-of. Guo and Lua [2] produced activated carbons which were prepared from oil-palm shell and they showed that increasing the acti-vation temperature from 773 to 1173 K leads to a progressive increase in the BET surface area; however, the maximum surface area obtained was 1366 m2/g, and all of samples they investigated were using holding time before activation in range of 60 to 120 min. In another study on oil-palm shell, Daud and Ali [5] found that within the temperature range of 800 to 900∘C, an increase in the activation temperatures had no signiicant efect on the mesopore and macropore devel-opment. In general, the activation process is usually carried out in the presence of a suitable oxidizing agent such as steam, carbon-dioxide, air, or oxygen. For steam and carbon dioxide activation, the temperature is generally in the region of 800 to 1000∘C, while steam activation starts in the temperature region of 700 to 750∘C. However, for oxygen activation, a lower temperature of 300 to 500∘C is usually employed to avoid combustion. he activation process, together with the intrinsic nature of the precursors, strongly determines the characteristics of the resulting activated carbons [5,6].
According to the preceding discussion, this study is distinctive from previous work in a number of ways. First, it involves the development and modiication of physical activation activated carbon-procedure by using a new basic medium ways to produce activated carbon with a high surface
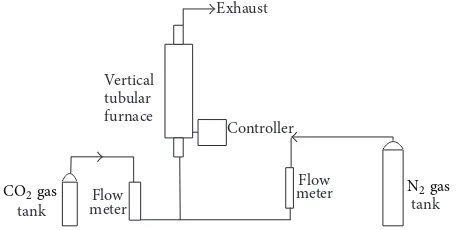
Exhaust
Figure 1: Schematic diagram of the experimental setup.
area and controlled pore structure. Second, it also includes a study of the efect of temperature on the porosity, chemical structure, and carbon surfaces of the activated carbons.
However, same as previous existing studies in activated carbon characterization, nitrogen adsorption at 77 K is em-ployed to verify the efect of the pore structure on the adsorption properties.
2. Experiment
2.1. Raw Material. he selection of appropriate raw mate-rial for the preparation of porous carbon, factors such as high carbon and low inorganic (i.e., low ash) content, high density of the precursor, and suicient volatile content are taken into considerations [4]. he raw oil-palm shells were obtained from an oil-palm mill in Batu Pahat Johor, Malaysia. he experiments were conducted in the hermodynamic Laboratory of Faculty of Mechanical Engineering, Univer-siti Teknikal Malaysia (UTeM), Melaka. he production of carbon adsorbents involved carbonization and physical activation process using an experimental rig, also known as activated carbon reactor.
2.2. Carbonization. he raw oil-palm shell was irst dried at 110∘C to reduce the moisture content. he dried shell was then ground and sieved. Size fractions of 2.0–2.8 mm for shell were used.Figure 1 shows the experimental setup for carbonization process that both pyrolysis and activation were carried out in a stainless-steel reactor having 550 mm length and 38 mm internal diameter, placed in a vertical tube furnace. About 50 g of the materials were placed on a metal mesh in the reactor. During pyrolysis, puriied nitrogen at a low rate of 150 cm3/min was used as purge gas. he furnace temperature was increased from room temperature to 500– 700∘C. he resulting chars were then directly activated based on its carbonization temperature (500–700∘C) for 60 minutes under a CO2lush.
Table 1: List of label for the materials according to the process.
No. Label Meaning
1. 5AC Carbonization and activation at 500∘C 2. 6AC Carbonization and activation at 600∘C 3. 7AC Carbonization and activation at 700∘C 4. CAC Commercial activated carbon Norit
5. A500∗ Carbonization and activation at 500∘C with 60 minutes holding time
6. A600∗ Carbonization and activation at 600∘C with 60 minutes holding time
7. A700∗ Carbonization and activation at 700∘C with 60 minutes holding time
∗Results from [7].
carbon industry where generally temperatures of 1000∘C or more are employed. he use of lower temperatures agrees with past studies using lignocellulosic precursors [2]. Lower temperatures require less energy and help to reduce potential production costs. For convenience of discussion, the samples are labeled as inTable 1.
2.4. Characterization. he porous structure of each sam-ple of the activated carbon was determined by nitrogen adsorption/desorption at 77 K using a surface analyzer Quan-tachrome, Autosorb-1c apparatus. Each sample was irst degassed at 110∘C for 12 hours under vacuum, and then the isotherm was measured in the relative pressure range from 0.01 to 0.99. he BET analysis was performed for relative pressures between 0.06 and 0.2. he total pore volume is calculated from the amount of vapor adsorbed at a relative pressure of 0.975. Following the IUPAC nomenclature, the pore sizes 2 nm and 50 nm are adopted as the micro-meso and micro-meso-macro boundaries, respectively. he Barrett-Joyner-Halenda (BJH), Horvath-Kawazoe (HK), and density functional theory (DFT) methods are used here to investigate the micropore size distribution. he micropore volume is obtained from the amount of nitrogen adsorbed at a relative pressure of 0.2. he mesopore volume is calculated by subtracting the amount adsorbed at a relative pressure of 0.2 from that adsorbed at a relative pressure of 0.99. he DFT and slit-shaped pore models are then used to determine the mesopore size distribution. Finally, the average pore diameter is calculated from the ratio between micropore volume and surface area. A scanning electron microscope, Cambridge Instruments S360, was used to observe the presence of porosities and microporosities of the samples.
3. Results and Discussion
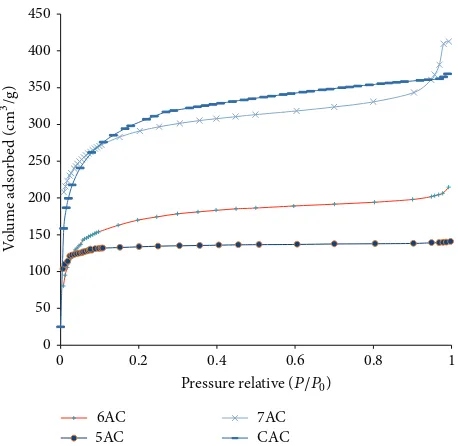
3.1. Surface Area and Pore Volume. Figure 2shows the ad-sorption isotherms which are obtained from nitrogen adsorp-tion/desorption at 77 K using a surface analyzer. he results indicate a typical Type I according to IUPAC classiication relecting the domination of micropores in the pore structure. hese are characteristic of microporous solids having a small external surface area, the limiting uptake being governed by
0
Figure 2: Results of adsorption isotherms of all the samples.
the accessible micropore volume rather than by the internal surface area. In order to compare tailored activated car-bon with the commercialized activated carcar-bon, commercial activated carbon Norit AC was used and was provided by Esco Singapore Pte. Ltd. in the form of cylindrical extruders with the diameter of approximately 5 mm. his commercial activated carbon has been successfully characterized by Guan et al. [8].
At low pyrolysis temperature activated carbon inFigure 2, one can clearly see that the initial step region is abruptly followed by a plateau indicating that the adsorption has virtually stopped because multilayer of adsorbate cannot be formed due to close proximity of the pore wall. It also implies near absence of mesopore and macropore inside the material. Further increase in the temperature through activation pro-cess has widened the pores as well as increased the volume of micropores. his observation was also reported by Gonz´alez et al. [9] in steam and carbon dioxide activation of olive stone chars. he efect can be seen by the increase in the amount of gas adsorbed and the slope of the isotherm changes from a sharp knee at 500∘C to a rounded knee with a discernible slope at high pressure region for higher temperature. his marginal increase in the volume adsorbed at the relative pressure range of 0.35–0.95 at high pyrolysis temperature could be attributed to the emergence of mesopores as a result of pore widening mechanism. More detailed discussion on pore development during activation process has been highlighted by Rodriguez-Reinoso [10]. he volumes were estimated from adsorption data by applying the Dubinin-Raduskevich equation over a range of relative pressure from 0.05 to 0.3.
Table 2: BET surface area and pore volume of palm shell activated carbon.
Sample BET surface area (m2/gram)
Total pore
volume (cm3/g) volume (cmMicropore3/g)
5AC 521.5 0.215 0.217
6AC 631 0.314 0.288
7AC 905 0.569 0.449
CAC 860 0.55 0.48
A500∗ 317.357 0.14969 0.12376 A600∗ 369.318 0.17338 0.15288 A700∗ 369.595 0.17698 0.15549
∗Results from [7].
that the BET surface area and the pore volumes increase as the carbonization temperature increases. he mesopore volume is shown to increase with the temperature due to pore widening upon activation with CO2 low as stated in [11].
Table 2also summaries the comparison between the samples with no holding time from this study and the samples with 60 minutes holding time temperature [7]. he preparation of activated carbon in [7] is similar with this study in terms of the raw material, the procedure, the heating rate, the carbonization, and activation processes except the holding time temperature.
It clearly shows that the samples with no holding time temperature have greater surface area, total pore volume, and micropore volume than the samples with holding time temperature.
Furthermore, it can be seen that micropore volume increases signiicantly with the increase of activation tem-perature. When the temperature is increased, the burn-of percentage burn-of the ixed carbon will be higher and this also leads to the production of micropores. However, at temperatures of more than 1000∘C as in [6] it was observed otherwise, the micropore fraction decreased. Extensive ther-mal activation could lead to pore widening, whereby the micropores created during the carbonization process will be widened to mesopores and macropores. As a result, volume of mesopore and macropore fractions will increase. his condition indirectly decreases the micropore fraction.
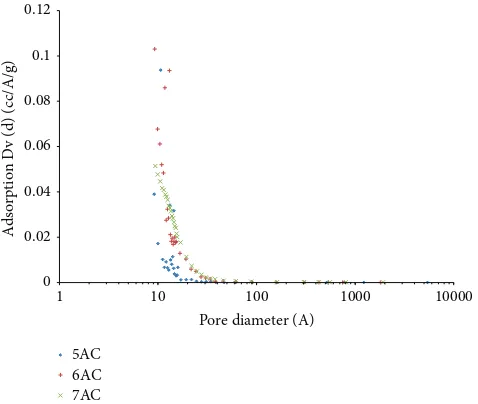
3.2. Pore Size Distribution. Figure 3 shows the pore size distribution of the activated carbon using BJH method. It shows that there is a steep increase for amount of adsorption Dv (d) in the micropore region, indicating that micropores have made up a substantial volume of the total pore volume of the activated carbon.
his is further suggested that the prepared activated car-bons were signiicantly made up of micropores. Similar pore size distributions were observed for all the other activated carbons obtained under diferent pyrolysis conditions.
he micropore size distribution for the activated carbon according to the Horvath-Kawazoe method [12] is shown in
Figure 4. From the diferential pore volume plots, ultramicro-pores less than 7 ˚A are present, which contribute to selectivity
0
1 10 100 1000 10000
A
Figure 3: Results of PSD of palm shell activated carbon using BJH method.
Figure 4: PSD of palm shell activated carbon using H-K method.
of adsorption (molecular sieve efect). At activation temper-ature of 500∘C, heterogeneous micropore size distribution is obtained with two diferent peaks at 8.6 ˚A and 11.4 ˚A while at 600∘C the pore size distribution has shown more uniform size with peak at 9.8 ˚A. At 700∘C, the activated carbon has one peak at 9.8 ˚A indicating that micropores made up a substantial volume of the total pore volume of the activated carbon.
0 0.01 0.02 0.03 0.04 0.05 0.06 0.07
0 5 10 15 20 25 30 35 40 45 50
P
o
re
v
o
lu
me (cc/A/g)
Pore diameter (A)
5AC 6AC 7AC
Figure 5: Results of PSD of palm shell activated carbon using DFT method.
0 0.02 0.04 0.06 0.08 0.1 0.12
0 10 20 30 40 50 60
D
v (d) (cc/A/g)
Pore width (A)
Figure 6: he PSD of the Norit AC derived from N2 isotherm at 77 K using DFT [8].
Figure 6, it is shown that the Norit AC presents a narrow micropore peak around 11 ˚A with little mesoporosity.
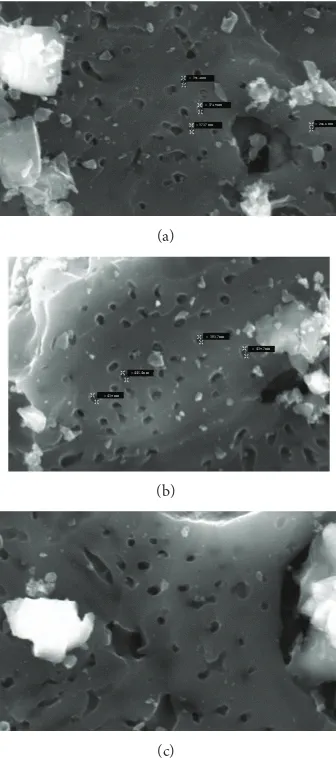
3.3. Particle Morphology Characterization with Scanning Elec-tron Microscopy Analysis. he Scanning Electron Microscopy (SEM) analysis shows the surface condition of the ibrous activated carbon.Figure 7presents the micrographics of the activated carbon prepared at the selected temperatures.
he oil-palm shell activated carbon surface has a rela-tively smooth solid structure mainly void of pores but with occasional crevices. Similar to other SEM works [13,14], the carbonized oil-palm shell surface was also covered with many globular silica bodies that contain sharp, conical agglomera-tions. FromFigure 7, efect of pyrolysis temperature appears on the pore width and uniformness of the activated carbon can be observed. At all samples, some pores of carbon are covered with silica, while this silica may decrease the number of adsorbed particle due to the adsorbate that cannot enter
= 391.4nm
= 374.9nm
= 373.7nm = 266.6nm
(a)
= 303.7nm
= 439.7nm
= 445.4nm
= 439nm
(b)
(c)
Figure 7: SEM photograph of oil-palm shell activated carbon prepared at (a) 500∘C, (b) 600∘C, and (c) 700∘C.
the pore. his silica can be removed when higher CO2low is applied to the activated carbon preparation [15].
4. Conclusion
Acknowledgment
he authors gratefully acknowledge the inancial support pro-vided by the Ministry of Higher Education Malaysia under Fundamental Research Grant Scheme, FRGS/2007/FKM(7)-F0013.
References
[1] S. Wang and Z. H. Zhu, “Efects of acidic treatment of activated carbons on dye adsorption,”Dyes and Pigments, vol. 75, no. 2, pp. 306–314, 2007.
[2] J. Guo and A. C. Lua, “Efect of heating temperature on the properties of chars and activated carbons prepared from oil palm stones,”Journal of hermal Analysis and Calorimetry, vol. 60, no. 2, pp. 417–425, 2000.
[3] O. Ioannidou and A. Zabaniotou, “Agricultural residues as pre-cursors for activated carbon production-A review,”Renewable and Sustainable Energy Reviews, vol. 11, no. 9, pp. 1966–2005, 2007.
[4] S. L. Rincon and A. Gomez, “Comparative behaviour of agri-cultural biomass residues during thermochemical processing,”
Global NEST Journal, vol. 14, no. 2, pp. 111–117, 2012.
[5] W. M. A. W. Daud and W. S. W. Ali, “Comparison on pore development of activated carbon produced from palm shell and coconut shell,”Bioresource Technology, vol. 93, no. 1, pp. 63–69, 2004.
[6] G. G. Stavropoulos and A. A. Zabaniotou, “Production and characterization of activated carbons from olive-seed waste residue,”Microporous and Mesoporous Materials, vol. 82, no. 1-2, pp. 79–85, 2005.
[7] I. Mohamad, Synthesis and Characterization of Microporous carbon adsorbents from oil palm shell by physical activation [M.S. thesis], Faculty of Mechanical Engineering, Universiti Teknikal Malaysia Melaka, 2006.
[8] C. Guan, C. Yang, and K. Wang, “Methane storage in a commer-cial Activated Carbon,”Carbon : Science and Technology, vol. 1, pp. 16–17, 2008.
[9] M. T. Gonz´alez, M. Molina-Sabio, and F. Rodr´ıguez-Reinoso, “Steam activation of olive stone chars, development of porosity,”
Carbon, vol. 32, no. 8, pp. 1407–1413, 1994.
[10] F. Rodriguez-Reinoso, “Controlled gasiication of carbon and pore structure development,” inFundamental Issues in Control of Carbon Gasiication Reactivity, vol. 192 ofNATO ASI Series, pp. 533–571, 1991.
[11] T. Yang and A. C. Lua, “Characteristics of activated carbons prepared from pistachio-nut shells by physical activation,”
Journal of Colloid and Interface Science, vol. 267, no. 2, pp. 408– 417, 2003.
[12] G. Horvath and K. Kawazoe, “Method for the calculation of efective pore size distribution in molecular sieve carbon,”
Journal of Chemical Engineering of Japan, vol. 16, no. 6, pp. 470– 475, 1983.
[13] K. C. Khoo, W. Killmann, S. C. Lim, and M. Halimahton, “Char-acteristics of the oil palm stem,” inOil Palm Stem Utilization-Review of Research, vol. 107 ofForest Research Institute Malaysia, pp. 15–28, 1991.
[14] A. L. Ahmad, M. M. Loh, and J. A. Aziz, “Preparation and characterization of activated carbon from oil palm wood and its evaluation on Methylene blue adsorption,”Dyes and Pigments, vol. 75, no. 2, pp. 263–272, 2007.
Submit your manuscripts at
http://www.hindawi.com
Hindawi Publishing Corporation
http://www.hindawi.com Volume 2013
Game Theory
Hindawi Publishing Corporation
http://www.hindawi.com Volume 2013
Hindawi Publishing Corporation
http://www.hindawi.com Volume 2013
Complex
Systems
Journal ofISRN Operations Research
Hindawi Publishing Corporation
http://www.hindawi.com Volume 2013
Hindawi Publishing Corporation
http://www.hindawi.com Volume 2013
Applied Analysis
Hindawi Publishing Corporation
http://www.hindawi.com Volume 2013
Optimization
Journal of
ISRN
Computational Mathematics
Hindawi Publishing Corporation
http://www.hindawi.com Volume 2013
Hindawi Publishing Corporation
http://www.hindawi.com Volume 2013
ISRN
Combinatorics
Hindawi Publishing Corporation
http://www.hindawi.com Volume 2013
Hindawi Publishing Corporation
http://www.hindawi.com Volume 2013
Geome
try
ISRN Applied Mathematics
Hindawi Publishing Corporation
http://www.hindawi.com Volume 2013
International Journal of Mathematics and Mathematical Sciences
Hindawi Publishing Corporation http://www.hindawi.com Volume 2013
Sciences
Hindawi Publishing Corporation
http://www.hindawi.com Volume 2013
Hindawi Publishing Corporation
http://www.hindawi.com Volume 2013
Mathematic
s
Journal of
Hindawi Publishing Corporation
http://www.hindawi.com Volume 2013
ISRN
Mathematical Physics
Hindawi Publishing Corporation
http://www.hindawi.com Volume 2013
Discrete Mathematics
Journal ofHindawi Publishing Corporation