WASTED HEAT RECOVERY SYSTEM: HOW TO GAIN ENERGY
ABDUL MUHAIMIN BIN MOHD SHAFIE
SUPERVISOR DECLARATION
“I hereby declare that I have read this thesis and in my opinion this report in sufficient in terms of scope and quality for the award of the degree of
Bachelor of Mechanical Engineering (Automotive).”
Signature : ………..
Supervisor :DR. MUSTHAFAH BIN MOHD TAHIR
WASTED HEAT RECOVERY SYSTEM: HOW TO GAIN ENERGY
ABDUL MUHAIMIN BIN MOHD SHAFIE
This report is submitted in partial
fulfillment of the requirements for the award of a Bachelor of Mechanical Engineering (Automotive)
Faculty of Mechanical Engineeing Universiti Teknikal Malaysia Melaka
DECLARATION
“I hereby declare that the work in this report is my own except for the summaries and quotations which have been duly acknowledge.”
Signature :………..
Author :ABDUL MUHAIMIN B. MOHD SHAFIE
iii
Special for Father and mother
ACKNOWLEDGEMENT
I would like to express my deepest appreciation to all of those who provided me the possibility to complete this final year project report. A special gratitude I give to my final year project super visor, Dr. Musthafah bin Mohd Tahir, whose contribution in stimulating suggestion and encouragement, helped me to coordinate my project especially in my writing this report.
v
ABSTRACT
ABSTRAK
vii
TABLE OF CONTENT
CHAPTER TITLE PAGES
DECLARATION ii
ACKNOWLEDGEMENT iv
ABSTRACT v
ABSTRAK vi
TABLE OF CONTENT vii
LIST OF TABLE x
LIST OF FIGURE xi
LIST OF SYMBOLS xiii
LIST OF APPENDIX xiv
CHAPTER 1 INTRODUCTION 1
1.1 Overview 1
1.2 Problem Statement 2
1.3 Objective 3
1.4 Scope 3
1.5 Thesis Overview 4
CHAPTER 2 LITERATURE REVIEW 6
2.1 Theory of An Organic Rankine Cycle 6
2.1.1 Rankine Cycle System 6
2.1.2 Organic Rankine Cycle 9
2.2 Theoretical Equation For Organic Rankine Cycle 10
CHAPTER 3 METHODOLOGY 15
3.1 Overview. 15
3.2 Project Requirement 15
3.3 Project Flow Chart 16
3.4 Heat Recovery System 17
3.4.1 Schematic Diagram For Heat Recovery System 17 3.4.2 Components Justification System 18
a) Engine 18
b) Pump 19
c) Air Motor 21
d) Heat Exchanger 22
e) NIST Reference Fluid Thermodynamic and
Transport Properties (REFPROP) 23
f) Working Fluid 25
g) Sensors and Wiring 29
h) WINDAQ Software 31
i) Reservoir tank 33
j) Hose 35
3.4.3 System Installation 36
3.4.4 Procedure To Retrieve The Data 38
CHAPTER 4 RESULTS AND DISCUSSION 40
4.1 One Minutes After The Engine Started 42
4.2 5 Minutes After Engine Started 43
4.3 5 Minutes After The Engine Started With Fan Off 44 4.4 10 Minutes After The Engine Started With Fan Off 45 4.5 20 Minutes After The Engine Started 46
4.6 Important Findings 47
CHAPTER 5 CONCLUSION AND RECOMMENDATION 48
5.1 Conclusion 48
ix
REFERENCE 50
APPENDIX A 52
APPENDIX B 53
LIST OF TABLE
NO TITLE PAGES
2.1 Table 2.1 : Wasted heat streams classified by temperature
(Neeharika, 2012). 7
3.1 Table 3.1 : Critical pressure and boiling point of working fluid. 25
xi
LIST OF FIGURE
NO TITLE PAGES
2.1 Figure 2.1 : Simple ideal Rankine cycle(power cycle, n.d). 9
2.2 Figure 2.2 : Schematic diagram for Rankine cycle (Geothermal
power, n.d). 10
2.3 Figure 2.3 : Pressure versus Enthalpy of a closed Rankine cycle
(Power cycle, n.d). 11
3.1 Figure 3.1 : Project flow chart 16
3.2 Figure 3.2 : Schematic diagram for heat recovery system 17
3.3 Figure 3.3: Engine used for this experiment 18
3.4 Figure 3.4:Illustration of the heat in the cooling system (Fauzan, n.d). 19
3.5 Figure 3.5: Pump used 20
3.6 Figure 3.6: Pump specification 21
3.7 Figure 3.7 : Air motor 22
3.8 Figure 3.8 : Heat exchanger (Brazed plate heat exchanger) 23
3.9 Figure 3.9 : Heat exchanger used in the experiment 23
3.10 Figure 3.10 : Initial display of REFPROP 24
3.11 Figure 3.11 : REFPROP used to find Enthalpy 25
3.12 Figure 3.12: Graph of pressure versus enthalpy for R-134a 28
3.13 Figure 3.13 : Graph of temperature versus Entropy for R-134a 28
3.14 Figure 3.14 : Sensors attach to the piping 29
3.15 Figure 3.15 : Wiring for Data logger 31
3.16 Figure 3.16 : Selecting the channel 32
3.17 Figure 3.17 : Calibration box 32
3.18 Figure 3.18 : Appearance of WINDAQ 33
3.19 Figure 3.19 : Changing the sample rate. 33
3.20 Figure 3.20: Reservoir tank used 34
3.21 Figure 3.21 : Installation of refrigerant 35
[image:13.595.127.514.228.762.2]3.23 Figure 3.23 : Installation of the system. 38
4.1 Figure 4.1 : Heat recovery system 40
4.2 Figure 4.2 : Leaking at the reservoir tank 41
4.3 Figure 4.3 : Graph after 1 minute 42
4.4 Figure 4.4 : Graph after 5 minutes 43
4.5 Figure 4.5 : Graph after 5 minutes engine started with fan off 44
4.6 Figure 4.6 : 10 minutes after engine started with fan off 45
xiii
LIST OF SYMBOLS
°C Degree Celsius
W Watt (Power)
°F Degree Fahrenheit
qin heat in
qout heat out
wturb, out Work Turbine out
wpump, in Work pump in
h enthalpy
KJ/Kg Kilojoule per kilogram MPa Mega Pascal Psi Per square inch
Flow rate
_ Thermal efficiency rpm Revolution per minute kg/m3 Density
K Kelvin
LIST OF APPENDIX
NO TITLE PAGES
A Gantt chart 52
B Drawing 53
CHAPTER 1
INTRODUCTION
1.1 OVERVIEW
Recently, the development of a country used a lot of energy consumption. Industrial development, increasing in number of the vehicles in the road, and domestic equipments used a large scale of energy to operate. There are many sources that can convert into electric energy such as, fuel, hydro, wind, and others. Over the time, crude oil and petroleum product will become limited, costly to find and produce. At the same time, the demand for these sources is high. Moreover, environmental problems also need to be considering in the development. Green house effect and pollution are an example of the environmental problem recently.
Low-grade heat can produce an electric which can be used for another system. In a cement power plant that is currently located in Switzerland, they use wasted heat from the suspension preheated gas and clinker cooler waste air and convert them into a clean electrical energy (Borrnet, 2011). These processes not only make the efficiency of the power plant increase, but also reduce the production of the CO2 emission. Twenty percent of the consumption of the cement power plant also can be save using low-grade wasted heat sources(Borrnet, 2011). Recovering wasted heat can reduce the dependence on the crude oil, produce no additional risky emission such as carbon and reduce the operating cost.
1.2 PROBLEM STATEMENT
Since a few years ago, development of a world’s economy leads to produce a by-product commonly carbon dioxide which a sources of the green house effect. Moreover, the usage of raw fuel seems to be increase over the time. People cannot depend only on a raw fuel that will decrease slowly. They need to find new sources that may reduce the usage of a raw fuel. Waste heat is one of the sources that can produce energy without adding the carbon emission to the environment. Plus, waste heat is one of the ways to reduce the dependence on the foreign oil.
3
friction. 30 to 35% of the total heat supplied by the fuel is removed through cooling medium which is radiator by carried away the lubricating oil and heat to the radiator(Ganesan, 2007).
Waste heat from the radiator can be used as new sources of energy by converting the heat energy into an electrical energy. This can be done by building a heat recovery system for a vehicle that can be used in the future. The usage of the clean sources leads to produce a health environment.
1.3 OBJECTIVE
Main objective in this project is to build up a waste heat recovery system and obtain energy form the wasted heat in this system. This study also will prove that the theory that wasted heat can be recovered by heat recovery system. Moreover, the ancillary objective in this study is to analyse the different of heat in the radiator that will produce a high energy for the recovery system.
1.4 SCOPE
1.5 THESIS OVERVIEW
These reports consist of 5 main chapters which are:
CHAPTER 1 - INTRODUCTION
Introducing the readers to the general background of the case study, the objective of the project, scope of the project, and the problem statement that leads to this study.
CHAPTER 2 - LITERITURE REVIEW
In this chapter, it consists of a study about this project about their theory. This study are referred from the books, journals, thesis and internet.
CHAPTER 3 - METHODOLOGY
This chapter mainly about the progress of the project. This is shown using a flow chart. In this chapter also including the process of collecting the data and information from the previous study, collecting of data, drawing the system, process and analyse the data to obtain the final result.
CHAPTER 4 - DISCUSSION
5
CHAPTER 5 - CONCLUSION
This chapter will show the conclusion about the study and the recommendation for the future improvements.
CHAPTER 6 - REFERENCE
CHAPTER 2
LITERATURE REVIEW
2.1 THEORY OF AN ORGANIC RANKINE CYCLE
In this chapter, Organic Rankine cycle (ORC), Wasted heat recovery system, the component involved in the ORC will be introduced. All of the information stated in this chapter is through a study that has been done for this project.
2.1.1 RANKINE CYCLE SYSTEM
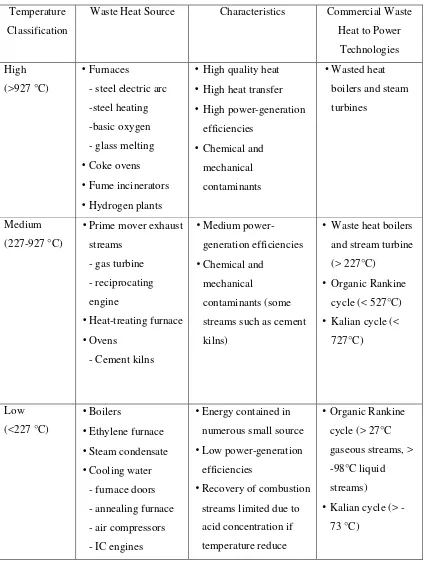
There are three types of Rankine power cycle, which is Stream Rankine Cycle (SRC), Organic Rankine cycle (ORC), and Kalina cycle (KC). Table 2.1 shows the waste heat stream that is classified by temperature. In this table, the cycle that needs to use as a reference for a system can be determine. For the Internal Combustion Engine, the radiators usually produce the heat at range 60 to 80°C. This type of ICE will use temperature that is classified as low temperature.
7
[image:23.595.109.534.211.773.2]working fluid (Neeharika, 2012). Although Kalina cycle is more efficient energy extraction from the heat source and have an efficiency 15 to 25 percent more efficient thanORC, Kalina is dangerous if the system installed in the vehicle when an accident occurs.
Table 2.1 : Wasted heat streams classified by temperature (Neeharika, 2012). Temperature
Classification
Waste Heat Source Characteristics Commercial Waste
Heat to Power
Technologies
High
(>927 °C)
•Furnaces
- steel electric arc
-steel heating
-basic oxygen
- glass melting
•Coke ovens
•Fume incinerators
•Hydrogen plants
•High quality heat
•High heat transfer
•High power-generation efficiencies
•Chemical and mechanical
contaminants
•Wasted heat boilers and steam
turbines
Medium
(227-927 °C)
•Prime mover exhaust streams
- gas turbine
- reciprocating
engine
•Heat-treating furnace
•Ovens
- Cement kilns
•Medium power-generation efficiencies
•Chemical and mechanical
contaminants (some
streams such as cement
kilns)
• Waste heat boilers and stream turbine
(> 227°C)
• Organic Rankine cycle (< 527°C)
• Kalian cycle (< 727°C)
Low
(<227 °C)
•Boilers
•Ethylene furnace
•Steam condensate
•Cooling water - furnace doors
- annealing furnace
- air compressors
- IC engines
•Energy contained in numerous small source
•Low power-generation efficiencies
•Recovery of combustion streams limited due to
acid concentration if
temperature reduce
•Organic Rankine cycle (> 27°C
gaseous streams, >
-98°C liquid
streams)
•Low-temperature ovens
below -23 °C
Many of impracticalities associated with the carnot cycle can be eliminated bysuperheating the steam in the boiler and condensing it completely in the condenser, as shown in Figure 2.1, a schematically on a T-s diagram (Cengal and Boles, 2011, p.551).Rankine cycle is the result of this case, which is the ideal cycle for the vapor power plants. Heat is converted into a work or energy by Rankine cycle (RC). The working fluid in the Rankine cycle is usually water or steam. The heat is supplied into a Rankine cycle which is in close loop in order to operate. 90% of the electric power generated in this world are comes from Rankine cycle(Wiser Wendell H.,2000). Commonly, biomass, coal, solar thermal, and nuclear power plants used Rankine cycle to regenerate the heat lost. For an ideal Rankine cycle, internal irreversibility does not involve and consists of the following process:-
1 – 2 Isentropic compression in pump
2 – 3 Constant pressure heat addition in boiler 3 – 4 Isentropic expansion in turbine