Investigation and Evaluation of Low cost Depth Sensor
System Using Pressure Sensor for Unmanned Underwater
Vehicle
Aras M.S.M
1, Abdullah S.S
2, Shafei S.S.
11-Department of Mechatronics, Faculty of Electrical Engineering, Universiti Teknikal Malaysia Melaka, Hang Tuah Jaya, 76100 Durian Tunggal, Melaka Malaysia.
2- Department of Electric and Electronics, Malaysia-Japan International Institute of Technology, Universiti Teknologi Malaysia, International Campus Jalan Semarak, Kuala Lumpur, Malaysia.
3-Department of Mechanical And Manufacturing Engineering, Faculty of Engineering, University Malaysia Sarawak, Jalan Dato’ Muhammad Musa, 94300 Kota Samarahan, Sarawak.
Received X X X Revised X X X Accepted X X X
ABSTRACT:
This paper presents the investigation and evaluation of low cost depth sensor system design for unmanned underwater vehicle (UUV) using pressure sensor. Two types of low cost pressure sensor system design are proposed for underwater vehicle. The pressure sensors are expected to prevent buckling or damaging to the UUV. The first design uses barometric pressure sensor, while the second design uses MPXAP which is an integrated silicon pressure sensor on-chip signal conditioned and temperature compensated. There are two different sub model of MPXAP put forward in this research namely, MPX4250AP and MPX5700AP. These pressure sensors are tested in three different conditions: in water tank, lake and swimming pool to study their effect on various densities. Details of the designs are discussed and implementations of these sensors on UUV are analyzed. Experimental results showed these pressure sensors have different performances. Based on the analysis of the results, MPX AP sensor is more suitable to be applied to UUV with low cost budget. For the depth from 0 to 30 meter, MPX 4250 AP is selected while MPX 5700 AP is for the range of depth up to 70 meter.
KEYWORDS: Pressure Sensor System; Unmanned Underwater Vehicle; Absolute Pressure; Barometric Pressure Sensor; Integrated Silicon Pressure Sensor; Water Density
1. INTRODUCTION
Underwater vehicle was first developed to study diffusion, acoustic transmission and submarine wakes. Since then, UV technology has evolved tremendously, applied and used in more tasks and roles and missions constantly evolving. The development of more advanced processing capabilities and high yield power supplies, underwater vehicle (UV) are now accepted and widely used for underwater mission [1]. Most of UVs is used in commercial field for oil and gas industry, military mission, underwater researcher and also as a hobby. Underwater vehicle is an application use to observe and monitor any events that occur under water. Generally, there are three types of underwater vehicle used for the application such as autonomous underwater vehicle (AUV), remotely operated vehicle (ROV), underwater gliders and human occupied vehicle. Despite the growing use of UV, a major problem face by the UV is still not
solved. UV tends to buck in a certain unknown under water pressure. Normally, each underwater vehicle operates at a depth that has been determined by the engineers. However, by knowing the operating depth without knowing the pressure at that determined depth can cause buckling to UV body. By knowing the pressure on the determined depth, underwater vehicle can be prevented from buckling. To overcome these problems, the underwater vehicle needs a system to measure accurately pressure value at the determined depth. It is also important that the system must be designed esthetically and easy to handle. The system accuracy and reliability are of paramount importance. Suitable material for the UV body should also be considered meticulously.
underwater application [4]-[8][11][13]-[15]. To date, even though many researchers have successfully developed different design/measurement method for the UUV, the system is expensive to develope.Therefore, the low cost pressure sensor would offer advantage over existance measurement method. A pressure sensor usually acts as a transducer where it generates a signal as a function of the pressure imposed. Pressure sensors are used for controlling and monitoring most of the application in a daily life. It can be used indirectly to measure various variables such as fluid, gas flow, speed, water level, and altitude. Regardless of the quality of the pressure sensor, the measurement of the pressure is influenced by environmental factors, such as wave, tide, atmospheric pressure and sea water density [2]. By using small and low power, pressure sensor is an attractive approach to measure waves and depth of a small scale unmanned underwater vehicle (UUV). The transducers are placed on the bow, port and starboard sides of the UUV and these will be used to determine the proximity of obstacles around underwater vehicle (UV) [3].
In this paper, two types of low cost pressure sensors design are proposed to obtain the pressure value at the determined depth. The design of the depth sensor system is focus on the underwater application. The improvement is made for the pressure sensor system that use barometric pressure sensor module. Then, the second system that use MPX AP sensor is developed. For the second system, the value is obtained from output voltage that is proportional to the value of pressure, and then the pressure value is obtained from the calculation. Their accuracy and reliability are analyzed in three types of condition such as water tank, lake and pool on the same fixed depth. The system with the best performance will be chosen as sensor system for underwater vehicle. This paper is organized as follows; section 2 presents the theoretical about pressure sensor; section 3 describes system methodology. Section 4 and Section 5 illustrates the field testing results. Finally, section 6 is a final remark. to certain depth in the ocean. The submarine that has been built in a wrong shape would collapse when it depth of the water. Figure 1 shows one of the example of relationship between the pressure and depth; the pressure increases when the depth is deeper. This shows that the range of the diverse rates of pressure in water is various at different depth.
Fig. 2: Pressure versus Temperature [6] 3. METHODOLOGY
This project consists of two major parts which are the hardware part and the software part. The hardware parts involve the fabrication of two pressure sensor systems which consist of electronic board and their casings. Figure 3 shows the process requires to accomplish this project. In the first phase, the improvement of the first pressure sensor is done by providing an external switching device to the system. Meanwhile, an integrated silicon sensor is fabricated for the second pressure system. The second phase is the software development for the pressure sensor system to display the pressure value on the LCD. At this stage, a suitable casing is chosen to protect the system, thus it is water resistant. The final stage involves analyses of the data pressure obtain from the experiment of both pressure sensor systems at three different places which are in water tank at laboratory, at UTeM’s lake, and at swimming pool.
Fig. 3: Flow chart of project 3.1 Hardware Constructions
for this project is well functioning. Meanwhile for the second system, it consists of integrated silicon pressure sensor, filtering circuit, and also op- amp circuit. First, an integrated silicon pressure system is fabricated. Then, the components are soldered on the board.
After the assembly process, the circuit connection for both systems is tested by checking its continuity before placing the systems inside the casing. For the first pressure sensor system this procedure must be done to make sure the pressure sensor is functioning and in contact to the PIC. It must also be ensured that the casing used is suitable and able to protect the system while it is in the water. The details of the electronic components connection use in this project will be explained in next section.
Fig. 4: flow of the hardware process 3.2 Electrical Component
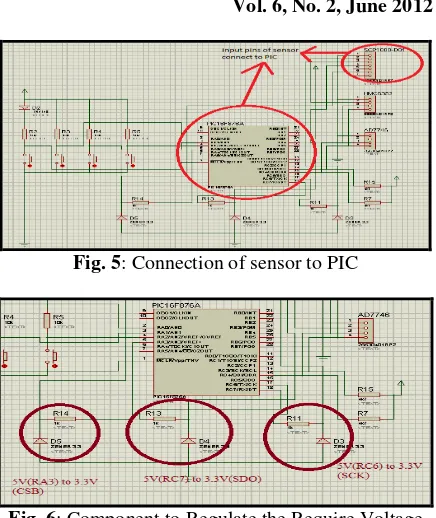
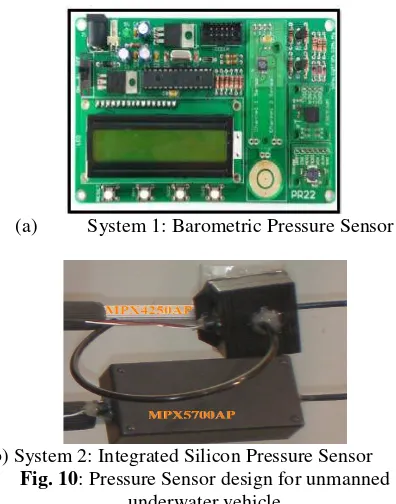
The main board used for both pressure sensors are printed circuit board. The control circuit board consists of a functional circuit, PIC 16F876A and LCD. The sensor use to read the pressure value is barometric pressure sensor. Figure 5 shows the SCP1000 input pins where SCK (SPI clock input) is connected to the RC3 and MOSI (SPI data input) to the RC4. Figure 6 shows that the signal between sensor and PIC 16F876A is converted to the voltage level. Since this sensor requires 3.3V, the pins at sensor are connected to other components to regulate the voltage for the suitable supply required.
Fig. 5: Connection of sensor to PIC
Fig. 6: Component to Regulate the Require Voltage Then the LCD and switching is constructed on the external board and connects to the main board by using bus cable. Since the LCD is connected on the external board, components are connected using jumper with header pin.
3.3 PCB Design for Depth Sensor
Next step is PCB design process. PCB design process for the pressure sensor consists of four important stages. In fabrication process,extra precaution has to be taken since the design process is very sensitive to the tolerance in the dimension. The first stage is to prepare the master layout and followed by creating the photoresist pattern, etching and soldering.The mark layout is a scaled conductor pattern as shown in Figure 7. Once the proteus software had been optimized and the exact patterns are obtained then the file is translated to form the layout of design.
(a) (b) Fig. 7: (a)Te mark layout for pressure sensor;
Fig. 8: Complete circuit
Finally, the pressure sensor is soldered on the PCB as shown in Figure 8. The continuities are checked using multimeters to ensure the complete and good flow of signal in the design circuit. Once the continuity test is completed, the pressure sensor now ready to measure depth of water. This is second sensor pcb board design.
3.4 Software Development
Figure 9 shows the flowchart of the operation for the pressure sensor system one. This system is operated once the switch is on and it displays the value based on the mode switch press. Each switch represents the sensor use in the system.
Fig. 9: the flow of software operation
The sensor system two not used PIC programming (software development). Only measurement on output pin so that the output obtained in Volts unit. So, needed to convert to depth using converter in another section.
4. EXPERIMENT
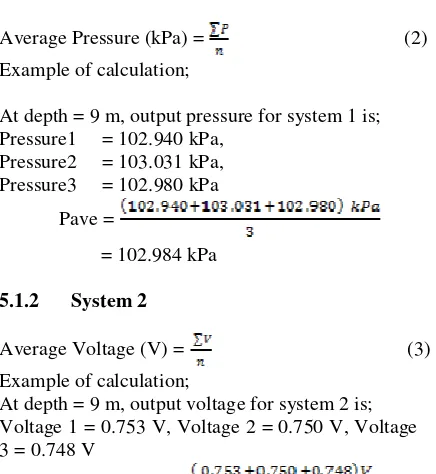
Figure 10 shows the pressure sensor design in this research which is ready to be tested. The method to test the pressure sensor is developed. First experiment was performed in the pool filled with tap water with a depth of about 1 m. The second test was performed in
the lake which has a depth of about 10 m. The last test was performed in the pool with the depth of about 10m. For the first experiment the depth is limited because of the height of water tank is only about 1 m, thus the range to determine the pressure is from 0 to 1 m. However, in the second test the lake has depth of about 10 m and the range of depth is from 0 to 10 m. The same case happens for the last test in the pool where the depth range is from 0 to 10m. The long and adjustable pipe is used to submerge the pressure sensor systems with casing into the water in order to obtain the deepest rate of water.
(a) System 1: Barometric Pressure Sensor
(b) System 2: Integrated Silicon Pressure Sensor Fig. 10: Pressure Sensor design for unmanned
underwater vehicle
4.1 Testing in the Water Tank at Underwater Laboratory
Fig. 11: The experiment conducted in water tank 4.2 Testing in the UTeM’s Lake
The second test for the pressure sensor system was performed in the lake as shown in Figure 12. This second test involved two pressure sensor systems as the main tools. This second place was chosen to investigate whether the lake water and its depth affect the pressure sensor performance. The same method was done at water tank to obtain the result which is the pressure sensor system with casing was submerging into the lake water. The results of two pressure sensor systems are recorded in two different tables. The results are recorded from range 0 to 10 m depth with each increment of 1m. The range of depth is bigger because the lake depth deeper than the water tank. The test was repeated three times to get more accurate results. The results was plotted in the graph of pressure (kPa) versus depth (m) for first system and voltage (V) versus depth (m) is plotted for second system.
Fig. 12: The experiment conducted in lake 4.2 Testing at swimming Pool
The third experiment was done in the pool as shown in Figure 13. The aim of the third experiment is to obtain the pressure value as compare to the previous experiments since the depth of the previous place is limited. The same method was applied at swimming pool where the pressure sensor system with casing was submerged into the water. The results for two pressure sensor were recorded in two different tables. The
results were recorded from range 0 to 10m depth with each increment of 20 cm since the range was also increase compare to the previous experiment. The pressure value for the two pressure sensor systems was recorded in the tables. The test was repeated three times to get the accurate result and the result also was plotted in the graph of pressure (kPa) versus depth (m) for system one and voltage (V) versus depth (m) is plotted for system two.
Fig. 13: The experiment conducted at pool 5. RESULT
5.1Experimental Results
From the result recorded, the average of output pressure and voltage of two systems for each depth of water is calculated by using the below equations accordingly;
5.1.1 System 1
Average Pressure (kPa) = (2)
Example of calculation;
At depth = 9 m, output pressure for system 1 is; Pressure1 = 102.940 kPa,
Pressure2 = 103.031 kPa, Pressure3 = 102.980 kPa
Pave =
= 102.984 kPa
5.1.2 System 2
Average Voltage (V) = (3)
Example of calculation;
At depth = 9 m, output voltage for system 2 is; Voltage 1 = 0.753 V, Voltage 2 = 0.750 V, Voltage 3 = 0.748 V
Average Voltage (V) =
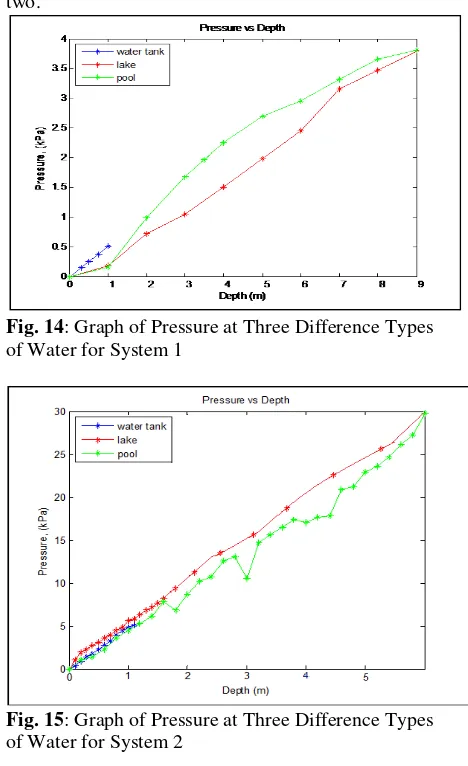
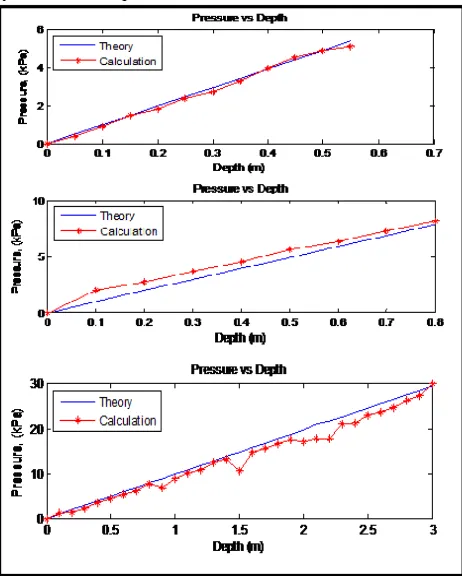
From the results obtained, the graph of pressure versus depth for System 1 and System 2 were plotted. Figure 14 shows the graph value of pressure on three different types of water for system 1. While for the Figure 15 shows the graph value of pressure on three different types of water of pressure sensor for system two.
Fig. 14: Graph of Pressure at Three Difference Types of Water for System 1
Fig. 15: Graph of Pressure at Three Difference Types of Water for System 2
5.1.3 Performance of Pressure System To evaluate performance of the pressure system in this reseach, error is defined as follows,
Error= (4)
% of error = Error x (100/100)
The theoretical value for pressure can be calculated or obtained from the software that can be used to convert the depth of water into pressure value. Figure 16 show the software used to obtain the theory value for pressure at the given depth.
Fig. 16: Pressure Converter
Example of calculation to obtain pressure value at given depth is shown below;
For depth, h = 5m, by using eq (1) yield
g = 9.81 = 1000 kg/m3
P = (1000 kg/m3) (9.81) (5) P = 49.05 kPa
In order to get the actual value of pressure from the experiment, the output values that obtain from these two systems were set to be bonding equation or for the calibration.
5.2 Pressure Sensor System 1 (Barometric Pressure Sensor)
The first value obtained from pressure sensor system is set to be as reference value. The calculation for each pressure at different depth is continued by using the equation (4). Each of the value for the theory and calculation of the pressure from the experiment for the system one was recorded in the Figure 14 and Figure 15. In graph for the Figure 14 and 15, the equation used to obtain the error between theory and calculation given by:
Error= (5)
% of error = Error x (100/100) Calculation;
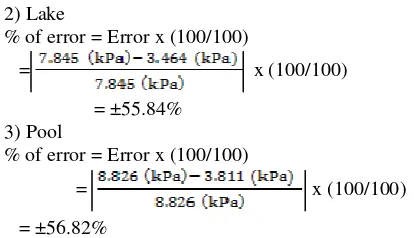
Taking the maximum error from the graph of theory and calculation for experiment done by referring to the graph;
1) Water tank
% of error = Error x (100/100)
= x (100/100)
2) Lake
5.3 Pressure Sensor System 2 (Integrated Silicon Pressure Sensor)
5.3.1 MPX 4250 AP
Experiment 1 held on swimming pool with depth up to 12.5 feet. Result of this experiment as shown in Table 1. Three reading measuring of output stated in Table 1. Figure 17 is shows the output pressure (voltage) plotted in graph.
Fig. 17: Output vs absolute pressure Table 1. The result of experiment 2
Depth
Fig. 18: Outputs graph of three reading From Figure 18, we can see the output of pressure sensor linearly proportional to the depth of water. The deep the pressure sensor submerges into underwater, the pressure will be increasing until it saturated when the pressure sensor limit for the depth up to 25.5 meter. The three reading of output almost got same pattern that is linearly output. Mention earlier, we assumed when the output 1.622 V, the depth will be on surface (0m) and when the output is 2.223 V the depth is pressure. The water pressure changes are linearly proportional to the depth of water. The pressure will be increase as the depth of water increase. The change in depth (or weight of the water) will influence the pressure as defined in equation 4 where p is pressure, w is weight of the fluid and h is the depth.
Table 2. Data sheet of pressure sensor
while MPX5700AP that every 25kPa give an output of 0.25V. MPX 5700 can measure up to 700 kPa equivalent to 71.38 meter deep as shown in Figure 19.
Fig. 19: Output vs absolute pressure Table 3. The result of experiment 3
Depth (cm) output 1
output 2
output 3
Depth (cm) from datasheet
0 0.737 0.736 0.728 4.748
5 0.740 0.740 0.731 4.767
10 0.743 0.743 0.734 4.786
15 0.746 0.746 0.737 4.805
20 0.749 0.749 0.740 4.824
25 0.752 0.752 0.743 4.843
30 0.755 0.755 0.746 4.862
35 0.758 0.758 0.749 4.881
40 0.761 0.761 0.752 4.900
45 0.764 0.764 0.755 4.919
50 0.767 0.767 0.758 4.938
55 0.770 0.770 0.761 4.957
60 0.773 0.773 0.764 4.976
Fig. 20: output graph of three reading from three experiments
From Figure 20 we can see the output of pressure sensor also linearly proportional to the depth of water. The deep the pressure sensor submerges into underwater the pressure will be increasing until it saturated when the pressure sensor limit for the depth up to 70 meter. The three reading of output almost got same pattern that is linearly output. Mention earlier, we assumed when the output 0.737 V, the depth will be on surface (0m) and when the output is 0.773 V the depth is 60 cm. From Table 2 the setting depth between 0.737 V and 0.773 V is 22.8 cm. So the error is 60 %. As the conclusion, this pressure sensor cannot suitable to apply in our underwater vehicle to determine the depth of water based on changes in pressure because this pressure sensor MPX5700AP give an output of 0.25V every 25kPa. So it is not suitable for shorter depth. It is suitable for more deep up to 70 meters. Figure 4 is shows a experiments set up for pressure sensor, (a) is MPX 4250 A and (b) is MPX 5700 AP.
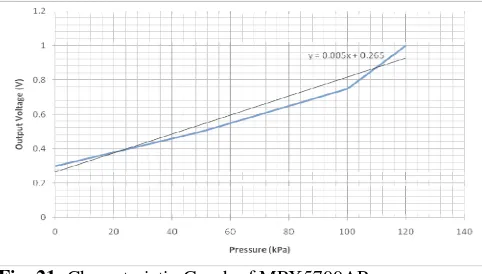
The outputs obtain from the experiment done for the second pressure sensor system in three difference types of water was in voltage value. In order to get the value of pressure, the characteristic graph was plotted by using excel based on the given specification of the MPX5700AP sensor. Figure 21 shows the plotted characteristic graph of MPX5700 AP.
Fig. 21: Characteristic Graph of MPX5700AP
The equation was obtained from this graph to find the pressure value for the experiment done at the three different types of water. The equation is;
The general equation, y = mx + c (5)
Equation obtained, y = 0.0055x + 0.265
Calculation;
At depth = 0 m; y = 0.0055x + 0.265, y = 0.748 V.
x = Pressure value (kPa)
Pressure (kPa) =
=
= 87.818 kPa is equal to reference pressure After the value for each pressure for the experiment done was obtain, the actual value for pressure for each depth was then calculated by using the equation (6).
By referring to the eq. (4) % of error = Error x (100/100) Calculation;
1) Water tank
% of error = Error x (100/100)
= x (100/100)
= ±9.40%
2) Lake; The value of mode of error in the graph is consider compare to maximum value
% of error = Error x (100/100)
= x (100/100)
= ±23.59 3) Swimming Pool
% of error = Error x (100/100)
= x (100/100)
= ±28.31%
From the data obtained, the pressure will always increase when collaboration with increasing water in depth. From the graph plotted for system one and system two, both system showed the increment value of pressure for each increment of depth. The system 1 shows that the pressure value at water tank and pool has the higher value compare to the pressure value at lake. System two shows that the value of pressure at lake is higher than the value of pressure at water tank and pool.
However for the both system, its shows that the pressure value for water tank and pool at the same depth is almost the same. These according to the theory of water pressure which the pressure is increase when the depth of water is increase and the pressure is also affected by the water density. The pressure for water tank and pool is almost the same since both of it is fresh water. The lake water should have high water density based on the theory of water because of its impurities. Based on the theory, the system two give the accurate result compare to the system one since its shows that lake has high pressure compare to water tank and pool.
Calculation of percentage of error to see performance of the two pressure sensor also done by taking the maximum error from the plotted graph in those three different types of water. By the calculation done, the result clearly shows that value of percentage error for system one is higher which is equal ±38.38% at water tank compare to system two that equal to ±9.40%. For the second percentage error value at lake system one equal to ±55.84%, while system two equal to ±23.59%. For the last place, at pool the percentage of error for system one is equal ±56.82%, while for system two is equal ±28.31%.
Fig. 22: Comparison of three types of pressure sensor 6. CONCLUSION
The experiments carried out for the various types of pressure sensors in 3 type of water (Pool, lake and lab tank) and different water depth showed:
1.The appropriate pressure for water vehicle to move without buckling
2.The surrounding pressure can be determined where the UV can be safely maneuvered
3.The appropriate pressure sensor system for under water activity is MPX AP. It is reliable, accurate and it can be used as a depth sensor as well. The margin of error is about 4 kPa
5.Water in tank and water in the pool do not exhibit the same characteristics namely: same pressure, and temperature which affect its density.
After completing this project, this project can help in research activity to determining the appropriate pressure to move the underwater vehicle in the water. This research also has many advantages that can help to determine the level of underwater vehicle by referring to the surrounding pressure of the underwater vehicle. By referring to the objective of this project, the selected pressure sensor system for underwater vehicle in this project is pressure sensor system that use MPX AP sensor. This sensor shows a good performance in measuring the pressure value at underwater. Other than that, this sensor also is able to be use as depth sensor that matches most of the application for underwater vehicle since it has a wide range of pressure measurements.
The selected pressure sensor system also based on the performance shows in measuring the pressure value at underwater. The analysis shows that this system is accurate in measuring the pressure at underwater since it is approximate the theory value of water pressure. The error shows in measurement for system two only ± 4 kPa (maximum error) compare to system one which is ± 5 kPa (maximum error). Other than that, from Percentage of error obtained, the results clearly shows that value of percentage error for system 1 is higher which is equal ±56.82%, while for system 2 is equal ±28.31%.
This system also shows that the pressure value on the lake water is higher than at water tank and pool due to its density of water. Other than that, water density also depends on temperature of water. Normally lake water gets denser as the temperature goes down compare to the water tank and pool that has higher temperature. This is happen because the lake water is in open area and it does affected by nature element.
7. RECOMMENDATION
UV can use the pressure sensor to measure the appropriate depth and conditions (water pressure, temperature and salinity) where the UV can safely be utilized without buckling. The improvement in the design, structure and components used for UV can vastly benefit the military. A Vibration SENSOR, can be installed in the UV as an added security.
Although the underwater vehicle can use the pressure sensor in order to prevent buckling and knowing its operating pressure, the improvement to this underwater vehicle can give many benefit to many parties such as military field for used to tracking any kind activities happen in the water. In order to improve this sensor performance, vibration sensor can be
implementing to the system. The operation of the vibration sensor is should be dividing by two sensing elements, which are first sense the vibration or unusual vibration situation around the underwater vehicle. This sensor can be categorized as an alarm function for the selected sensor system for the underwater vehicle. A vibrator sensor should be synchronized with the pressure sensor system that can generate the warning signal, then able to vibrate and send the information once the underwater vehicle has undergo the high limit of pressure.
ACKNOWLEDGEMENT
Special appreciation and gratitude to honorable University (UniversitiTeknikal Malaysia Melaka, UTeM and UniversitiTeknologi Malaysia, UTM) especially to the both Faculty of Electrical Engineering for providing the financial as well as moral support to complete this project successfully.
REFERENCES
[1] Dive and Discovery. “Underwater Research Vehicle”, www.divediscover.whoi.edu/ robotics vehicles. html. [Accessed 10 April 2011]
[2] Are B. Willumsen, Ove Kent Hagen, and Per Norvald Boge. (2007). Filtering Depth Measurement in Underwater Vehicles for Improved Seabed Imaging.
[3] Thomas Braunl, Adrian Boeing, Louis Gonzales, Andreas Koestler, Minh Nguyen, Joshua Pettit. (2004).
The Autonomous Underwater Vehicle Initiative-Project Mako. The university of Western Australia Parametric Array Acoustic Transducers for Sonar Applications”
[6] Federico Bianchi, Student Member, IEEE, Stephen J. Redmon, Member, IEEE, Michael R. Narayan, Student Member, IEEE, Sergio Cerutti, Fellow, IEEE, Barnko G. celler, Member, IEEE, Nigel H. Lovell, Senior Member, IEEE. (2009). Falls Event Detection using Triaxial Accelerometry and Barometric Pressure Measurement.
[7] Jennifer L. Laine, Scott A. Nichols, David K. Novick, Patrick D. O’Malley Daniel Copeland and Michael C. Nechyba (1999).
SubjuGator: A Highly Maneuverable, Autonomous Underwater Vehicle
[8] Felix Stephan Schill. (2007). “Distributed Communication in Swarms of Autonomous Underwater Vehicles”
[10] Julian Bell’albero, Anthony Mascheck, Matt Wintercorn “Autonomous Underwater Vehicle (AUV)”
[11] Vadim Gerasimov, Gerry Healy, Mikhail Prokopenko, Peter Wang, and Astrid Zeman . (2010). “Symbiotic Sensor Networks in Complex Underwater Terrains: a Simulation Framework”
[12] Erin Fischel, Tracy Cheung, Brian Mittereder, Conrad Petersen, James Brian Rajsky, Peter Sullivan “Flexible Mission Infrastructure for AutonomousUnderwater Vehicles”
[13] Uichin Lee, Paul Wang, Youngtae Noh, Luiz F. M. Vieir, Mario Gerla, Jun-Hong Cuis, Bell Labs, Alcatel-Lucent UCLA UFMG & University of Connecticut. IEEE INFOCOM (2010) “Pressure Routing for Underwater Sensor Networks”
[14] David Heeley. Sensor Product Division, Pheonix, Arizona“Understanding Pressure and Pressure Measurement”
[15] HyperPhysics. Department of Physics and Astronomy.
“Pressure Concepts” www.
hyperphysic.phy.astr.gsu.edu. [Accessed 10 April 2011]
[16] Carl T.F Ross. “Exploiting the Deep Oceans for Energy Resources”. [Accessed 18 May 2011]
[17] PC Hagan. “The cuttability of rock using a high pressure water jet”. http://www. mining. unsw.edu.au /Publications/publications_staff / Paper_Hagan_ WASM. htm. [Accessed 10 April 2011]
[18] B.J. He, Y. Zhang, G. L. Riskowski, T. L. Funk.
“Thermochemical conversion of swine manure:
![Fig. 1: Relation between Pressure and Depth [5]](https://thumb-ap.123doks.com/thumbv2/123dok/565088.66745/2.842.438.661.293.440/fig-relation-pressure-depth.webp)
![Fig. 2: Pressure versus Temperature [6]](https://thumb-ap.123doks.com/thumbv2/123dok/565088.66745/3.842.181.402.81.267/fig-pressure-versus-temperature.webp)