1.1 Background of the Problem
Although English has been taught at junior high school for three years, many students who
have graduated from SLTP still have low ability in applying English structure. This fact is
proved when the writer taught at SMK, even though the students learnt about preposition in
SMP, they did not have the ability to use them properly. For example, they did not know the
difference between on and above. In addition their average score for structure is low.
Gleanson (1975: 126) states that to learn language is to learn structure. Its means that if
students want to master a language especially English language, they must master the
structure.
Yogi (2008: 2) states that during his eight years’ experience of teaching junior and senior
high school students, he has seen that most of his students face difficulties in understanding
English structure. Related to Yogi’s statement, it is clear that student’s problem in learning
English is in the case of structure.
It is also supported by Lasmin (2000: 26) who has found in her research in SMP HANG
TUAH that 44.4% of students in her classes have low structure especially in preposition of
place. There are some factors which may cause the failure of the students, such as, the
number of preposition of place in English which are greater than the preposition of place in
Bahasa Indonesia.
A preposition of place in Bahasa Indonsia sometimes has more than one meaning in English.
orabove, and preposition of placedi bawah,in English we can use preposition of placeunder orbelow,but they have different situation in use.
Another factor is the teacher’s teaching technique. In this case, the teacher usually uses
translation in teaching preposition of place into Bahasa Indonesia, then she gives some
examples in the sentences, e.g., The cat is on the table (Kucing itu di atas meja), The bird
flies above the tree (Burung itu terbangdi atas pohon). From those example, it can be seen that preposition of place on and above have the same meaning in Bahasa Indonesia, that is di atas. However, they actually have different situations. Even though the students know the
meaning of preposition of place in Bahasa Indonesia, they are often confused which one
should be used. Therefore, they encounter difficulty in using and applying them in real
situation.
In teaching-learning process, it is understood that the teachers should present the materials to
their students well. The presentation will be more effective if the teacher uses tools or devices
that can help students catch the material taught easier. So the researcher tries to find a way to
make students enjoy their structure class and understand about preposition effectively and
efficiently.
Realia and picture are examples of media, which are frequently used, encourage students to
learn English in particularly prepositions of place. Realia or real objects are in many ways the
easiest kind of visual aid that can be applied in the classroom. Simple objects can be used not
only for teaching vocabulary but also as prompt to practice structure and develop situation
(Doff, 1988: 83). In other word, realia are real things that can be brought by the teacher to
make the situation or atmosphere in the classroom more meaningful. Moreover, realia also
can be used to teach structure, not to the least of which are promoting cultural insight and
great stimulus in the class, so that the students have great enthusiasm to learn preposition of
place.
Similarly, teaching structure through picture also can encourage students to reach the
objectives of learning. Wright (1984: 5) states that pictures can increase the achievement to
catch the meaning of each preposition by the students themselves. Wright’s statement raises
an idea that it will be easier for the students to understand preposition of place through
picture to increase students’ achievement in using preposition of place. Therefore, in this
study the researcher would like to investigate whether or not picture can be used to give a
positive influence on the student’s structure achievement. Moreover using pictures can help
the students learn the material more easily, as visual aid, particularly, picture has descriptive
representation and it can help them enjoy the lesson.
Based on the paragraphs above, realia and pictures can use for teaching prepositions of place
in order to attract students’ attention and to increase students’ motivation. Therefore, the
students will comprehend the materials more easily.
However, it is difficult to decide the more effective media between them. Thus, the two
teaching media, realia and picture were compared, to find out whether one or both of them
are effective or not for teaching preposition of place.
From the English teacher in SMPN 21 the writer found that the students had difficulty in
structure. It can be seen from the individual student’s score in structure; only 51.2% the
students reached the standard score of structure subject. The writer chooses SMPN 21 Bandar
Lampung because the writer wants to improve the student’s structure achievement and no
researcher is interested in comparing students taught through realia and taught through
picture to see whether any significant difference of the result between them. Therefore the
researcher titled the research “A Comparative study between students’ achievement in
preposition of place taught through realia and taught through pictures at the seventh grade of
SMPN 21 Bandar Lampung”
1.2 Identification of the Problems
Based on the researcher’s observation ,several problems can be identified:
1. Most of students find difficulties in learning structure especially preposition of place.
2. Student’spreposition mastery is still low.
3. Lack of motivation.
4. Lack of appropriate teaching media.
5. Some teacher cannot choose the appropriate technique or media that can be used in
teaching learning process.
1.3 Limitation of Problems
Based on the identification of the problems above, the researcher limits the problem about
media that is used by teacher; the researcher is interested in investigating whether there is any
difference of preposition of place achievement of students if they are taught by interesting
media in teaching preposition of place. Realia and pictures are two media that will be used to
teach preposition to investigate whether these media can be used to increase students’
preposition of place achievement. The researcher also wants to identify which one is better to
teach English grammar, realia or pictures. The researcher chooses teaching preposition of
Based on the limitation of the problems, the formulation of the problems is follows:
1. Is there any differenceof students’ achievement in preposition of place between those
who are taught through realia and those who are taught through pictures?
2. Which of the two teaching media is more effective for teaching preposition of place?
1.5 Objective of the Research
The objectives of the research are to investigate:
1. Whether there is a difference of students’ achievement in preposition of place
between those who are taught through realia and those who are taught through
picture;
2. To find out which one of the two teaching media is more effective for teaching
preposition of place.
1.6 Uses of the Research
The results of the research are expected to be beneficial not only theoretically but also
practically:
1) Theoretically, the results of the research can help to support the previous theories on
2) Practically, to inform English teachers that pictures and realia can be used to teach
preposition and give a positive influence on the students’ achievement of preposition
of place.
1.7 Scope of the Research
This research is a quantitative study. This research will be conducted at grade VII of SMP N
21 Bandar Lampung. The first year of SMP students is chosen since the preposition of place
is taught in the first year. The materials are based on the students’ book for grade VII of
Junior High School. The topics used are chosen based on the curriculum for the junior high
school and the pictures are from ‘picture’ collection retrieved from Junior high school
English books.
This research carried in six meetings that consisted of one meeting of try out, one meeting of
pretest, three meetings of treatments to both classes , and one meeting of posttest.
This research is focused on students’achievement. So, in collecting the data of this research,
the researcher will use tests. The data will be analyzed by using Independent Group T- Test
in which it is used compare the mean of two different data from different group that are also
taken in different situation. Finally, the researcher will compare the mean scoresof students’
III. RESEARCH METHOD
3.1 Research Design
This study is quantitative research. In conducting the research, the researcher
applied pretest posttest control group design to measure how far picture and realia
can increase the students’ achievement in preposition of place. There will be two
groups. The first is the experimental group which will receives the treatment of
realia. The second is control group which will receive the treatment of picture.
This design is believed in having a high internal and external validity. It is
because the samples are randomly chosen. The pretest is conducted to measure
student’s achievement in preposition before the treatment, and the pretest is
conducted to both groups to find out the students’ initial ability before the
treatment. The pretest can be also used to ensure whether the students are in equal
initial ability or not (Hatch and Farhady, 1982: 22).
The research design is being presented as follows:
G1 (random) = T1 X1 T2 G2 (random) = T1 X2 T2
In which: G1 : experimental class G2 : control class T1 : pretest T2 : posttest
2
X2 :control class treatment by using realia 3.2 Population and Sample
The population of the study is the first year students of SMP N 21 Bandar
Lampung in the 2010/2011 academic year. There are six classes of VII grade.
Two classes will be taken as the sample of the experimental class and control
class. There are seven classes of class VII, each class consists of 32-34 students.
The total numbers are 227 students. The researcher will use simple random
probability sampling, the class is selected randomly by using lottery, and it is used
based on consideration that every class has the same opportunity to be selected in
order to avoid the subjectivity in this research (Hatch and Farhady, 1982: 19). The
experimental class is VII F consists of 32 students, the control class is VII D
consist of 32 students and VII C which consists of 34 students is chosen as the try
out class.
3.3 Data
This research aims at gaining the data of students’ preposition of place
achievement before and after the treatments.
3.4 Research Procedures
1. Selecting materials
The materials, (preposition of place) are chosen from the students’ textbook and
internet. The selecting process considers materials that have been taught to the
2. Determining the population and sample
The population of research is all students of SMPN 21 Bandar Lampung at
Grade VII. And the sample is selected by usingsimple random probability
samplingThrough lottery, the researcher took three classes of class VII of SMP N 21 Bandar Lampung.
3. Trying out the instrument
The preposition of place test tried out to the students, in order to find
Out whether the test items are good or not in validity, reliability, level of
difficulty, as well as the discrimination power.
4. Conducting pretest
This test was given to experimental class 1 and experimental class 2 in order to
know the students’ background knowledge of preposition of place. This test is
done in 45 minutes.
5. Conducting the treatment
The preposition of place taught through picture and realia applied in
four weeks. The teacher gave the students three treatments using picture and
realia as had been explained in the prepared lesson plan.
6. Administering posttest
The post-test was administered after the application picture and realia. The
post-test was administered in 45 minutes and the aim is to find out the students’
ability in preposition of place after the implementation of picture and realia .
4
After conducting pretest and posttest, the researcher analyzed the data. The
data analyzed by using independent group T- Test. Independent group T-Test
formula is used to compare the means of the pretest ad posttest of both two
groups. The data is computed through the Statistical Package for Social
Sciences (SPSS) version 17.0.
3.5 Data Collecting Technique
The procedures of this research are as follows:
1. Try-Out Test
This step was done in order to known the level of difficulty and
discrimination power and also to found out the reliability of the test. Thus,
40 items was tested in the try out.
2. Pretest
The pretest was administered before the treatment for 45 minutes. It is
done to know the students’ achievement of preposition before the
application of picture and realia. The test used by researcher is an
objective test of multiple choice forms. The number in items of the test is
20 with four alternative answer for each ( A, B, C, and D), one is the
correct answer and the rest are distracters. The scoring system is that the
load of each correct answer is five points. So, if one participant answers all
items correctly, participant gets 100 point.
After conducting the treatment, the researcher gave post-test to both
classes. It was done in order to know the result of the experimental and
control class, whether they had development or not.
3.6 Criteria of a Good Test
In this research, to prove whether the test has good quality, it must be tried out
first. The test can be said having a good quality if it has a good validity,
reliability, level of difficulty, and discrimination power (Shohamy, 1985)
1. Validity
Validityrefers to the extent to which the test measure what is intended to measure. This means that it relates directly to the purpose of the test (Shohamy, 1985: 74).
There are four types of validity, namely face validity, content validity, construct
validity and empirical validity. To measure whether the test has a good validity,
the researcher used content validity and construct validity.
Content validity is concerned with whether the test is sufficiently representative and comprehensive for the test. In the content validity, the materials given are
suitable with the curriculum. In this case, the researcher uses the preposition of
place that is supposed to be comprehended by grade VII students. To fulfill this
validity, the researcher should see all the indicators of the instrument and analyze
them to see whether it has represented the material that measured or not. In this
research, the researcher arranged the instrument based on the material given. If
the measuring instrument has represented all the ideas that connected with the
6
of content validity. To know whether the test has a good validity, the items of the
test discussed with her advisors and her classmate and the English teacher of
SMPN 21 Bandar Lampung.
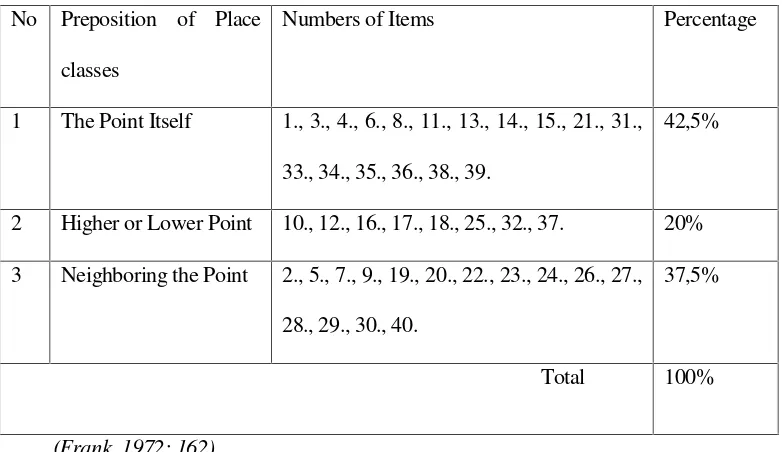
The content of the try out test is represented in the table of specification
below:
Table 3. Specification of the Try Out Test No Preposition of Place
classes
Construct validityexamines whether the test is actually in line with the theory,
meaning whether the test is in line with the school curriculum. Preposition of
place that is supposed to be comprehended by grade VII students of junior
high school (KTSP Kurikulum Tingkat Satuan Pendidikan 2006) will be used.
1. Reliability
Hatch and Farhady (1982: 243) say that reliability of a test can be defined as the extent to which a test produces consistent result when administered under
researcher will use split-half technique in order to know how far each
indicator will show the same result in measuring an aspect. To measure the
coefficient of the reliability between first and second half, the following
formula will be used:
rxy : coefficient of reliability between odd numbers and even numbers items
2x : the right answer of odd part
y2: the right answer of even part
xy : number of students who take part in the test(Lado: 1961 in Huges, 1991: 32)
Then “Spearmen Brown’s Prophecy Formula” will be used (Hatch and
Farhady, 1982: 286) to know the coefficient correlation of the whole items.
The formula is as follows:
rk =
rk : the reliability of the test
rl : the reliability of half test
8
The result of reliability of try out test in this research was 0.98 (see appendix
4). Seeing the criteria proposed above, the reliability of this test was moderate,
while a criterion for high reliability was in range 0.50-0.89. It could be
concluded that this instrument would give consistent result when it was
administered under similar condition to the same participant and in different
time (Hatch and Farhady, 1982: 247). Therefore, it could be stated that the test
had fulfilled the criteria of reliability. In other words, the test was reliable.
3. Level of Difficulty
To see the level of difficulty, the following formula will be applied:
LD = N R
Where:
LD : level of Difficulty
R : number of students who answer correctly
N : the total number of students following the test
The rest 30 items were in the level of average difficulty. The ten easy items
were dropped, while the rests were administered for the pretest and posttest.
4. Discrimination Power
To see the discrimination power, the following formula will be used:
D = correct U–correct L 1
/2N
D = Discrimination Power
Correct U = The number of upper group students who answer correctly
Correct L = The number of lower group students who answer correctly
N = The total number of students who take the test
The criteria are:
D: 0.00–0.20 = Poor items
D: 0.21–0.40 = Satisfactory items
D: 0.41–0.70 = Good items
D: 0.71–1.00 = Excellent items
D: - (Negative) = Bad items, should be omitted
(Heaton, 1975: 180)
Based on the calculation of discrimination index, the result of try out test showed
that there were 4 items (6, 9, 12, 22) had zero discrimination. It means that the
items could not discriminate the upper and lower students well. Therefore, those
items were dropped. Then items number 17 was also dropped since the ID result
was negative, which mean low level students answered more that the high level
students. Item numbers 20, 26, 31, 33 and 37 were also dropped since the result
were under 0.20. In short, 30 items had discrimination index above 0.20 and they
10
1, 2, 3, 4, 5, 7, 8, 10, 11, 13, 14, 15, 16, 18, 19, 21, 23, 24, 25, 27, 28, 29, 30, 32,
34, 35, 36, 38, 39 and 40. A further result of discrimination index is shown on
appendix 6.
5. Scoring System
In scoring students result of the test, the highest score is 100. The scores of
pretest and posttest are calculated by using formula as follow:
X =
(Lyman, 1971: 95) Where:
X : percentage of correct score
R : number of right answer
T : total number of items on test
3.7 Data Analysis
To know whether there is a significant increase of the students’ preposition of
place achievement, the data gained from the pre and the post tests will be
analyzed. The researcher analyzes the students’ structure achievement by doing
these activities:
1. Scoring the pretest and posttest
2. Tabulating the result of the test and calculating the mean of the pretest and
posttest.
T R
3. Drawing conclusion from the tabulated result of the pretest and posttest
administered, that is by statistically analyzing the data using statistical
computerization i.e. independent group T-Test of SPSS 17.0 for Windows
to test whether the increase of students’ gain is significant or not, The
significance is determined by p<0.05. The data come from the same
sample or known as paired data. (Hatch and Farhady, 1982: 114)
3.8 Data Treatment
The researcher computed the data through drawing conclusion from the tabulated
results of the pretest and posttest after having finished collecting the data. In doing
so, the researcher analyzed the data statistically by administering the normal
distribution, homogeneity test and hypothesis test.
1. Normal distribution test
This test was administered in order to find out whether the data from both groups
were normally distributed.
The hypothesis of the normal distribution test was:
Ho: The distribution of the data is not normal
H1: The distribution of the data is normal
In this research, the criterion for the hypothesis was:
The hypothesis is accepted if sign > α. In this case, the research uses the level of
12
2. Random Test
Random Test is used to ensure whether the data is random or not. One of the
assumption should be fulfilled in using T-Test is the data should be taken from
random sample in a population.
The criteria are:
H0 : (the data is random)
H1 : (the data is not random)
In this research, H0 was accepted if sign > α, and the researcher used the level
significant 0.05.
3. Homogenity Test
This test was used to determine whether the data fulfill the criteria of the quality
of variance. This test used T-test to analyze the data.
The hypothesis for the homogeneity of variance was as follows:
H0: there is no significant difference in the level of ability (equal)
H1: there is significant difference in level of ability (no equal)
In this research, the criterions for the hypothesis were:
H1is accepted if sign>α. In this case, the researcher used the level of significance
3.9 Hypothesis Testing
The researcher will test the hypothesis to prove whether the hypothesis proposed
by the researcher is accepted or not. The formulation of the hypothesis testing
X1 : mean of the experimental class
X2 : mean of the control class
S : Standard Deviation
N1 : the number of the students in experimental class
N2 : the number of the students in control class
The test criteria are:
If the T0 T-table, the H0is accepted.
If the T0 T-table, the Hais accepted.
(Hatch and Farhady 1982: 120)
14
difference of students’ achievementbetween those who are taught
through realia and those who are taught through pictures).
H1 :is accepted if t-ratio is higher than t-table (there is no significant
difference of students’ achievementbetween those who are taught
through realia and those who are taught through pictures).
Ho : Realiais not more effective than pictures in improving the students’
achievement in preposition of place
H1 : Realiais more effective than pictures in improving the students’
THROUGH REALIA AND TAUGHT THROUGH PICTURES
AT THE SEVENTH GRADE OF SMPN 21 BANDAR
LAMPUNG
(A Script)
By
PUJI RAHMAWATI NINGSIH
LAMPUNG UNIVERSITY
BANDAR LAMPUNG
A COMPARATIVE STUDY BETWEEN STUDENTS’
ACHIEVEMENT IN PREPOSITION OF PLACE TAUGHT
THROUGH REALIA AND TAUGHT THROUGH PICTURES
AT THE SEVENTH GRADE OF SMPN 21 BANDAR
LAMPUNG
By
PUJI RAHMAWATI NINGSIH
A script
Submitted in a Partial Fulfillment of The Requirements for S-1 Degree
in
The Language and Arts Department of Teacher Training and Education Faculty
LAMPUNG UNIVERSITY
BANDAR LAMPUNG
The writer was born in Bandar Lampung on October 2nd, 1987. She is the first
daughter of Mr.Heri Santoso and Mrs.Olga Saplena. She has one younger brother
and one younger sister, Riza Mandala Putra and Elmira Ratna Sari.
She went to a formal education institution for the first time at TK BUDI BHAKTI
kindergarten 1 in 1992 and graduated in 1993. She continued her study in primary
school at SD BUDI BHAKTI PERSIT II-5 Bandar Lampung for three years and
she entered elementary school in SDN 5 Sukarame in 1997 and graduated in 1999.
Then she continued to secondary school at SLTP Negeri 21 Bandar Lampung and
accomplished it in 2002. After that, she joined a state senior high school at SMU
Negeri 5 Bandar Lampung and graduated in 2005.
At the same year, 2005, she was registered as a student in S1 English Department
in the Teacher Training and Education Faculty, University of Lampung. At the
beginning of February, 2009, she did teaching practice program (PPL) at SMP
DEDICATION
I would like to dedicate this paper to:
My parents , Heri Santoso and Olga Saplena
My beloved brother and sister, Riza and Ira
My cousins, Andri, Tia, Marta, Fazar,HAfiz
My Aunts, Lia, Erna, Hesti, Eka
and Uncles, Endon, Krisnaga
THROUGH PICTURES AT THE SEVENTH GRADE OF SMPN 21 BANDAR LAMPUNG
Students’Name : Puji Rahmawati Ningsih
Students’Number : 0543042040
Department : Language and Arts
Program : English
Faculty : Teacher Training and Education
APPROVED BY
Advisory Committee
1stAdvisor 2ndAdvisor
Ujang Suparman, M.A., Ph.D. Dra. Rosita Simbolon, M.A.
NIP 19570608 198603 1 001 NIP 19480920 197503 2 001
The Head of
Language and Arts Education Department
ADMITTED BY
1. Examination Committee
Chairperson :
Ujang Suparman, M.A., Ph.D.
………Examiner :
Hery Yufrizal, M.A., Ph.D.
………Secretary :
Dra. Rosita Simbolon, M.A.
………2. The Dean of Teacher Training and Education Faculty
Dr. Bujang Rahman, M.Si.
NIP 19600315198503 1 003