Trop. For. Manage. J. VI (1) : 33-42 (2000)
MONITORING VEGETATION CHANGES IN URBAN AREA
USING LANDSAT TM IMAGERY
1)Pemantauan Perubahan Vegetasi di Daerah Perkotaan Menggunakan
Landsat
TM
I NENGAH SURATI JAYA2)
ABSTRAK
Paper ini mengulas tentang manfaat data penginderaan jauh, khususnya data Landsat TM untuk memantau dan mengumpulkan informasi tentang perubahan penutupan lahan di areal perkotaan yang mencakup perubahan penutupan yang terjadi antara tahun 1988 dan 1992 di sebagian kota Jakarta dan sekitarnya. Tiga metode deteksi perubahan yang diterapkan adalah :
Perbandingan paska-klasifikasi (PCC) Klasifikasi multiwaktu langsung (DMC)
Komponen utama multiwaktu 6-dimensi (6-D MPC)
Hasil kajian memperlihatkan bahwa ketiga metode di atas dapat diterapkan untuk mendeteksi perubahan penutupan lahan di daerah perkotaan dan sekitarnya. Dari ketiga metode tersebut, meskipun metode DMC memberikan akurasi sedikit lebih tinggi daripada metode 6-D MPC, namun metode 6-D MPC memberikan beberapa keunggulan, diantaranya (1) perubahan vegetasi dalam luasan kecil dapat dideteksi dengan mudah melalui evaluasi nilai-nilai “eigenvector”; (2) deteksi perubahan lahan dapat dilakukan menggunakan beberapa band sintetis dengan jumlah band lebih sedikit dibandingkan DMC dan merangkum perubahan-perubahan yang dikehendaki serta klasifikasi dapat dilakukan lebih cepat.
Penerapan metode PCC dikategorikan sebagai metode yang komplek, dimana untuk melokalisir lokasi perubahan, harus dibuat binary-mask perubahan terlebih dahulu. Kajian ini juga menerangkan bahwa Landsat TM multiwaktu dapat digunakan untuk mendeteksi perubahan-perubahan kecil di daerah perkotaan.
INTRODUCTION
To monitor land cover changes between short time interval by using conventional method of terrestrial survey seems impossible. The only possible way, is by using satellite
1)
A part of this paper had been presented jointly by Dr. I .N.S. Jaya, Mr. S. Hardjoprajitno & Mr. S.A. Jatmiko at the International Conference on Data Management and Modeling using Remote Sensing and GIS for Tropical Forest Land Inventory on October 26-29 in Jakarta , 1998
2) Lecturer and scientist at Laboratory of Forest Inventory, Faculty of Forestry, Bogor Agricultural
remote sensing which provides frequent coverage. Nowadays, existence of satellite remote sensing data with finer spatial, shorter temporal and better spectral resolutions is very useful for monitoring rapid changes such as in the urban area. Monitoring land cover changes within these complex urban and suburban areas using ground survey is time consuming and high cost. Beside composed of naturally preserved area, urban/suburban areas are often composed of diverse land covers that artificially arranged by human in a complex pattern to build housing, transportation systems, commercial buildings and recreational landscapes.
At the last decade of the twentieth century, Jakarta has become a center of fast
economical growth of Indonesia. It’s unavoidable that this high economic growth has brought its impact to land cover changes, particularly from agricultural land to settlement, industrial/housing estate, golf course that are more economic than the other land covers.
The successful application of change detection techniques very often depends upon land cover types and proportion of each cover type within the study site and data quality. A method that has been identified to be appropriate for one site would not be the same for another site.
In this study, three change detection techniques for detecting land cover changes between short time interval within the Jakarta city and its vicinity was evaluated. The study objectives are: (a) to evaluate the most appropriate technique for detecting changes within urban and suburban area; and (b) to identify the types of land cover change that could be recognized by multitemporal Landsat TM data.
MATERIALS AND METHODS
Site Description
The case study was carried out at small and rapidly changed area within the North Jakarta Coast, including 25 hectares of Muara Angke Natural Preservation Area. This
study, which encompassed of approximately 1154.49 ha is located between 106°40’45” and 05°54’40” East Longitude; and between 06°00’40” and 05°54’40” South Latitude. Land cover types within the study area are settlement, housing, recreational landscape, golf course, cottage, hotel, condominium and natural vegetation. Within the natural preservation area, predominant tree species of mangroves are Avicenia sp., Exocaria agalocha, Sonneratia alba and Rhizhopora mucronata (Jaya et. al., 1997).
Image and Supporting Data
Methods
To obtain accurate change detection map, map rectification and image-to-image registration were performed. For automatic change detection as described in this study, an accurate root mean square error (RMSE), of less than 0.5 pixels was obtained. Less accurate image registration may cause change detection error. Using the transformation equation obtained from a number of GCPs, the images were resampled by using nearest neighbor algorithm. The resampling size was 30 m x 30 m.
In this study, three change detection techniques, namely, (1) post classification comparison (PCC); (2) 6-dimensional multidate principal component analysis (6-D MPC) by applying brightness and greenness concepts; and (3) direct multidate classification (DMC) were applied. The concept behind the 6-D MPC method applied in this study is identic to the study of Jaya and Kobayashi (1994) and (1995b), in which they applied all twelve reflective multidate TM bands. The modification is on the number of band applied. This study used only three multidate bands of two different dates. Three-plus-three bands from two different were treated as a single data. The selected band to perform DMC and MPC analyses referred to the study results of Jaya and Kobayashi (1995a) in which they recommended to use at least one band from visible (TM band 1, 2 or 3), one band from near-infrared (TM band 4) and the other from middle infrared (TM band 5 or 7). The increase in biomes (vegetation cover) which is accompanied by an increase in near-infrared and (TM band 4) and a decrease in visible band (TM 1, 2 or 3) reflectances has led to the identification of vegetation indices that summarize vegetation changes. The study of Abe et al. (1996) to estimate vegetation cover ratio in urban area within urban area is also referred. Referring to our earlier studies, TM bands that used for the study are therefore TM bands 3 (red), 4 and 5.
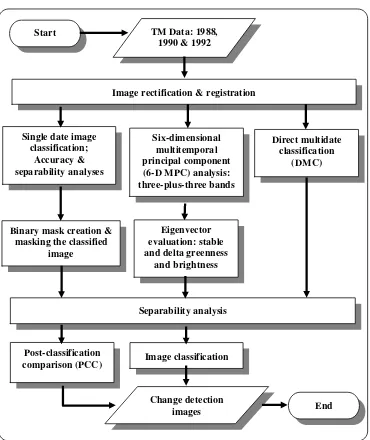
The PCC is the simplest change detection technique, which compares two classified images obtained from two different dates. The accuracy of this change detection technique is depending on the accuracy of land cover discrimination in each date. The DMC was applied to evaluate whether the method will be more reliable than the 6-D MPC. The results of these methods were also used as a reference to compare the effectiveness of other change detection technique. The 6-D MPC was examined to know whether the synthetic images created provide comparable change detection accuracy. In this method, the eigenvectors of the new axes were evaluated to identify where the change of greenness and brightness were summarized. The flow diagram of the study is depicted in Figure 1.
RESULT AND DISCUSSION
Post-classification Comparison (PCC)
Figure 1. Flow diagram of the study
Start TM Data: 1988, 1990 & 1992
Image rectification & registration
Single date image classification;
Accuracy & separabilityanalyses
Six-dimensional multitemporal principal component (6-D MPC) analysis: three-plus-three bands
Direct multidate classification
(DMC)
Binary mask creation & masking the classified
image
Eigenvector evaluation: stable and delta greenness
andbrightness
Separability analysis
Image classification
Change detection images Post-classification
comparison (PCC)
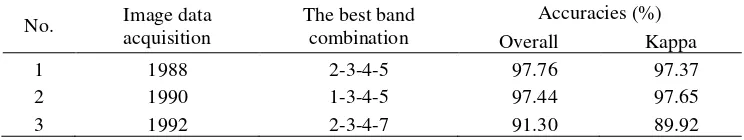
For image data acquired in 1988, the best separability was provided using four-band combination of 2-3-4-5. In this classification, there is no “poor” interclass separation found. For image data recorded in 1990 and 1992, the best results were also obtained using four-band combinations, i.e., 1-3-4-5 and 2-3-4-7, respectively. Each combination that had been identified to be the best combination was then used to classify the entire image of corresponding year. The recognized classes and classification accuracy provided using these band combinations are shown in Table 1 and 2.
The area estimates each cover type in each year is based upon pixel size of 30 m x 30 m.
Table 1. Area estimate of each cover type within the study area in 1988, 1990 and 1992
No. Cover Types 1988 1990 1992
(Ha) (Ha) (Ha)
1 Industrial area 383.9 129.2 127.8
2 Sparse mangrove 12.1 52.7 72.7
3 Dense Mangrove 184.5 107.4 77.9
4 Settlement/housing 216.9 418.5 376.1
5 Rice field 206.2 197.8 25
6 Shrub/bush 63.2 106.2 132
7 Fish pond 138.9 144.9 207
8 Bare land 18.4 - -
9 Grass land - 27.3 164.25
Table 2. The Overall and Kappa accuracies of classification of TM 1988, 1990 and 1992
No. Image data
acquisition
The best band combination
Accuracies (%)
Overall Kappa
1 1988 2-3-4-5 97.76 97.37
2 1990 1-3-4-5 97.44 97.65
3 1992 2-3-4-7 91.30 89.92
Source : Jaya et.al (1997)
Table 3. Accuracy of change/no-change binary mask
No. From-to binary mask Accuracy
Overall (%) Kappa (%)
1 1988-1990 95.75 90.87
2 1988-1992 99.38 98.75
3 1990-1992 98.57 97.12
These binary masks were then applied to map the areas of undergoing change. When the unchanged areas were masked out, the distribution and types of change between two dates were easily recognized, and the extend of changes could be estimated. In the post-classification comparison map, a judicious interpretation should be made. The types of changes that appear to be impossible should be ignored.
Based upon the accuracy of classified TM 1988, 1990 and 1992, as well as the
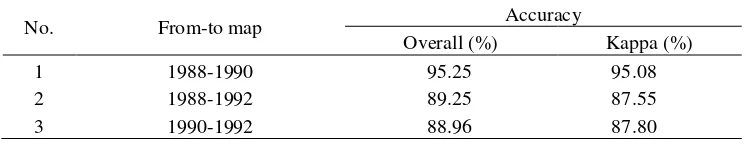
accuracy of binary mask for each date pair, the “from-to” change detection map could be estimated (Table 4). It was shown that the accuracies (Kappa) of change detection maps provided using PCC method, are ranging from 87.5% to 90.1%. From this comparison, it was found that mangrove vegetations are not underpressure between 1988 and 1990. Proportion of mangrove vegetation only decreased slightly of about 3.1%. From 1990 to 1992, the proportion of mangrove increased from 13.5% to 20%. In this study area, there is a change from bare land (establishment of new golf course) in 1988 to grass land (established golf course) in 1990 & 1992. From 1988 to 1990, the settlement had increased drastically from only 18% to 35% of the study area. In 1992, the decrease of settlement proportion is might due to misclassification error. Along the Muara Angke Beach, the extent of fish pond tend to increase. Field observation (Jaya et al., 1997) found that the land use for rice field has changed become more promising use such as fish pond. Proportion of fish pond is approximately 11.74% in 1988 and 17.5% in 1992.
Table 4. Change detection map accuracy using post classification comparison
No. From-to map Accuracy
Overall (%) Kappa (%)
1 1988-1990 95.25 95.08
2 1988-1992 89.25 87.55
3 1990-1992 88.96 87.80
Six-dimensional multitemporal principal component (6-D MPC)
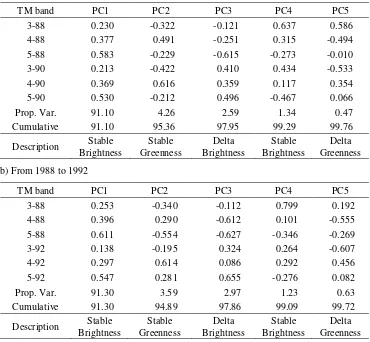
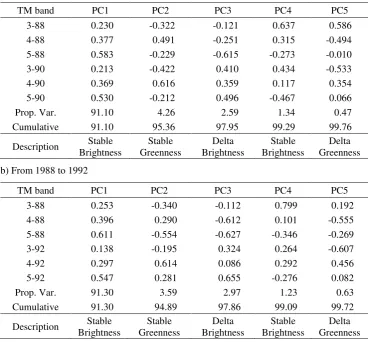
few components. As indicated by its eigenvector, the vegetation changes will be highlighted in delta greenness image. Delta brightness image specifically expresses changes that are dominated by changes in water contents of land cover. Although the variance of both delta brightness and greenness is very small, ranging from only 3% to 4%, the summarized change information was very useful to localize where changes took place.
Table 5. Eigenvectors and eigenvalues of MPC
c) From 1990 to 1992
In the change detection map provided using 6-D MPC, land use changes are mostly from fishpond to housing settlement located in northern side of highway of Soekarno Hatta Airport (Pantai Indah Kapuk Real Estate). For all date pairs (1988-1990, 1988-1992 and 1990-1992), the types of change detected are: (1) change from water surface to land that includes changes from fish pond to housing and from seashore to accumulation of garbage along side the Jakarta coast; (2) change from settlement to vegetation including establishment of urban forest (change from settlement to vegetation) and from bare land to shrub/bush; and (3) change from mangrove vegetation to settlement.
Within the study area, it was found that only small changes occurred from barren land to vegetation between 1988 and 1990. In this period, there is no significant regreenning program implemented. However, between 1988 and 1992, a high increase of changes from bare land to vegetation was found a long side of highway of Soekarno Hatta Airport. From 1990 to 1992, many of vegetated areas were converted to settlement
Direct multidate classification (DMC)
that the algebraic sign of eigenvector is consistent with the study of Jaya and Kobayashi (1994 and 1995b).
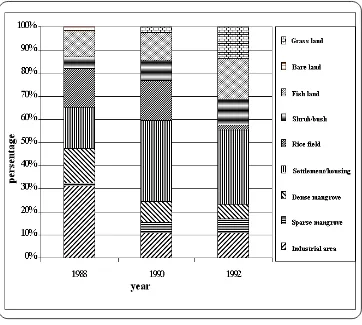
Figure 2. Proportion of each land cover in 1988, 1990 and 1992, obtained using Post-classification Comparison
CONCLUSION
From the study results it could be concluded that:
The PCC method appears to be more complicated, and therefore judious interpretation
should be made when impossible “from-to” change occurred. This irrational type of change could not be avoided, since a perfect registration is difficult to achieve.
Although 6-D MPC provides slightly less accurate of approximately 3% ~ 4% than the others, this technique was recognized to be simple and effective method to detect land cover changes and for computational efficiency 6-D MPC is reasonable enough. For a quite diverse covers such as urban and suburban area, the 6-D MPC method give relatively accurate results.
ACKNOWLEDGEMENT
The author would like to extend his appreciation to Miss Kuswibowoningsih and Mr. San Andre Jatmiko for their help during the ground survey and data analysis. Sincerely thanks are also extended to Mr. Soedari Hardjoprajitno and Mr. M. Buce Saleh, for their advices and invaluable help during the implementation of the study.
LITERATURES CITED
Abe, N., Jaya, I N. S. and H. Kamioka, 1996. Estimation of vegetation ratio in urban area using Landsat TM Images. Journal of Forest Planning, 2, 59-65.
Jaya, I N.S. and S. Kobayashi, 1994. Forest change detection using multitemporal algorithm. Proceeding of NAFRO seminar on sustainable forestry and its biological environment, pp. 19-34.
Jaya, I N. S. and S. Kobayashi, 1995a. Classification of detailed forest types based upon the separability algorithm: a case study in the Yahiko Mountain and Shibata Forest Areas, Niigata Prefecture. Journal of Remote Sensing Society of Japan, 15 (1): 40-53.
Jaya, I N. S. and S. Kobayashi, 1995b. Detecting Changes in Forest Vegetation using Multitemporal Landsat TM Data: a case study in the Shibata Forest Areas, Niigata Prefecture. Journal of Forest Planning, 1, 23-38.
Jaya, I N. S., S. Kobayashi and D. Nagamoto, 1996. Improving change detection accuracy using simple regression method. Proceeding of the Symposium on Forest Inventory and Monitoring in East Asia. Japan Society of Forest Planning Press. 95-104. Jaya, I.N.S., S. Hardjoprajitno and M.B. Saleh, 1997. The effect of the Rural Development
to the Forest Function: A case study in Muara Angke, Jakarta. Scientific Report Submitted to Osaka Gas Foundation, International Cultural Exhange. Faculty of Forestry, Bogor Agricultural Univeristy.
Jensen, J.R., 1986. Digital Image Processing. A Remote Sensing Persepective Prentice-Hall, Englewood Cliff, New Jersey 07632
Trop. For. Manage. J. VI (1) : 33-42 (2000)
MONITORING VEGETATION CHANGES IN URBAN AREA
USING LANDSAT TM IMAGERY
1)Pemantauan Perubahan Vegetasi di Daerah Perkotaan Menggunakan
Landsat
TM
I NENGAH SURATI JAYA2)
ABSTRAK
Paper ini mengulas tentang manfaat data penginderaan jauh, khususnya data Landsat TM untuk memantau dan mengumpulkan informasi tentang perubahan penutupan lahan di areal perkotaan yang mencakup perubahan penutupan yang terjadi antara tahun 1988 dan 1992 di sebagian kota Jakarta dan sekitarnya. Tiga metode deteksi perubahan yang diterapkan adalah :
Perbandingan paska-klasifikasi (PCC) Klasifikasi multiwaktu langsung (DMC)
Komponen utama multiwaktu 6-dimensi (6-D MPC)
Hasil kajian memperlihatkan bahwa ketiga metode di atas dapat diterapkan untuk mendeteksi perubahan penutupan lahan di daerah perkotaan dan sekitarnya. Dari ketiga metode tersebut, meskipun metode DMC memberikan akurasi sedikit lebih tinggi daripada metode 6-D MPC, namun metode 6-D MPC memberikan beberapa keunggulan, diantaranya (1) perubahan vegetasi dalam luasan kecil dapat dideteksi dengan mudah melalui evaluasi nilai-nilai “eigenvector”; (2) deteksi perubahan lahan dapat dilakukan menggunakan beberapa band sintetis dengan jumlah band lebih sedikit dibandingkan DMC dan merangkum perubahan-perubahan yang dikehendaki serta klasifikasi dapat dilakukan lebih cepat.
Penerapan metode PCC dikategorikan sebagai metode yang komplek, dimana untuk melokalisir lokasi perubahan, harus dibuat binary-mask perubahan terlebih dahulu. Kajian ini juga menerangkan bahwa Landsat TM multiwaktu dapat digunakan untuk mendeteksi perubahan-perubahan kecil di daerah perkotaan.
INTRODUCTION
To monitor land cover changes between short time interval by using conventional method of terrestrial survey seems impossible. The only possible way, is by using satellite
1)
A part of this paper had been presented jointly by Dr. I .N.S. Jaya, Mr. S. Hardjoprajitno & Mr. S.A. Jatmiko at the International Conference on Data Management and Modeling using Remote Sensing and GIS for Tropical Forest Land Inventory on October 26-29 in Jakarta , 1998
2) Lecturer and scientist at Laboratory of Forest Inventory, Faculty of Forestry, Bogor Agricultural
remote sensing which provides frequent coverage. Nowadays, existence of satellite remote sensing data with finer spatial, shorter temporal and better spectral resolutions is very useful for monitoring rapid changes such as in the urban area. Monitoring land cover changes within these complex urban and suburban areas using ground survey is time consuming and high cost. Beside composed of naturally preserved area, urban/suburban areas are often composed of diverse land covers that artificially arranged by human in a complex pattern to build housing, transportation systems, commercial buildings and recreational landscapes.
At the last decade of the twentieth century, Jakarta has become a center of fast
economical growth of Indonesia. It’s unavoidable that this high economic growth has brought its impact to land cover changes, particularly from agricultural land to settlement, industrial/housing estate, golf course that are more economic than the other land covers.
The successful application of change detection techniques very often depends upon land cover types and proportion of each cover type within the study site and data quality. A method that has been identified to be appropriate for one site would not be the same for another site.
In this study, three change detection techniques for detecting land cover changes between short time interval within the Jakarta city and its vicinity was evaluated. The study objectives are: (a) to evaluate the most appropriate technique for detecting changes within urban and suburban area; and (b) to identify the types of land cover change that could be recognized by multitemporal Landsat TM data.
MATERIALS AND METHODS
Site Description
The case study was carried out at small and rapidly changed area within the North Jakarta Coast, including 25 hectares of Muara Angke Natural Preservation Area. This
study, which encompassed of approximately 1154.49 ha is located between 106°40’45” and 05°54’40” East Longitude; and between 06°00’40” and 05°54’40” South Latitude. Land cover types within the study area are settlement, housing, recreational landscape, golf course, cottage, hotel, condominium and natural vegetation. Within the natural preservation area, predominant tree species of mangroves are Avicenia sp., Exocaria agalocha, Sonneratia alba and Rhizhopora mucronata (Jaya et. al., 1997).
Image and Supporting Data
Methods
To obtain accurate change detection map, map rectification and image-to-image registration were performed. For automatic change detection as described in this study, an accurate root mean square error (RMSE), of less than 0.5 pixels was obtained. Less accurate image registration may cause change detection error. Using the transformation equation obtained from a number of GCPs, the images were resampled by using nearest neighbor algorithm. The resampling size was 30 m x 30 m.
In this study, three change detection techniques, namely, (1) post classification comparison (PCC); (2) 6-dimensional multidate principal component analysis (6-D MPC) by applying brightness and greenness concepts; and (3) direct multidate classification (DMC) were applied. The concept behind the 6-D MPC method applied in this study is identic to the study of Jaya and Kobayashi (1994) and (1995b), in which they applied all twelve reflective multidate TM bands. The modification is on the number of band applied. This study used only three multidate bands of two different dates. Three-plus-three bands from two different were treated as a single data. The selected band to perform DMC and MPC analyses referred to the study results of Jaya and Kobayashi (1995a) in which they recommended to use at least one band from visible (TM band 1, 2 or 3), one band from near-infrared (TM band 4) and the other from middle infrared (TM band 5 or 7). The increase in biomes (vegetation cover) which is accompanied by an increase in near-infrared and (TM band 4) and a decrease in visible band (TM 1, 2 or 3) reflectances has led to the identification of vegetation indices that summarize vegetation changes. The study of Abe et al. (1996) to estimate vegetation cover ratio in urban area within urban area is also referred. Referring to our earlier studies, TM bands that used for the study are therefore TM bands 3 (red), 4 and 5.
The PCC is the simplest change detection technique, which compares two classified images obtained from two different dates. The accuracy of this change detection technique is depending on the accuracy of land cover discrimination in each date. The DMC was applied to evaluate whether the method will be more reliable than the 6-D MPC. The results of these methods were also used as a reference to compare the effectiveness of other change detection technique. The 6-D MPC was examined to know whether the synthetic images created provide comparable change detection accuracy. In this method, the eigenvectors of the new axes were evaluated to identify where the change of greenness and brightness were summarized. The flow diagram of the study is depicted in Figure 1.
RESULT AND DISCUSSION
Post-classification Comparison (PCC)
Figure 1. Flow diagram of the study
Start TM Data: 1988, 1990 & 1992
Image rectification & registration
Single date image classification;
Accuracy & separabilityanalyses
Six-dimensional multitemporal principal component (6-D MPC) analysis: three-plus-three bands
Direct multidate classification
(DMC)
Binary mask creation & masking the classified
image
Eigenvector evaluation: stable and delta greenness
andbrightness
Separability analysis
Image classification
Change detection images Post-classification
comparison (PCC)
For image data acquired in 1988, the best separability was provided using four-band combination of 2-3-4-5. In this classification, there is no “poor” interclass separation found. For image data recorded in 1990 and 1992, the best results were also obtained using four-band combinations, i.e., 1-3-4-5 and 2-3-4-7, respectively. Each combination that had been identified to be the best combination was then used to classify the entire image of corresponding year. The recognized classes and classification accuracy provided using these band combinations are shown in Table 1 and 2.
The area estimates each cover type in each year is based upon pixel size of 30 m x 30 m.
Table 1. Area estimate of each cover type within the study area in 1988, 1990 and 1992
No. Cover Types 1988 1990 1992
(Ha) (Ha) (Ha)
1 Industrial area 383.9 129.2 127.8
2 Sparse mangrove 12.1 52.7 72.7
3 Dense Mangrove 184.5 107.4 77.9
4 Settlement/housing 216.9 418.5 376.1
5 Rice field 206.2 197.8 25
6 Shrub/bush 63.2 106.2 132
7 Fish pond 138.9 144.9 207
8 Bare land 18.4 - -
9 Grass land - 27.3 164.25
Table 2. The Overall and Kappa accuracies of classification of TM 1988, 1990 and 1992
No. Image data
acquisition
The best band combination
Accuracies (%)
Overall Kappa
1 1988 2-3-4-5 97.76 97.37
2 1990 1-3-4-5 97.44 97.65
3 1992 2-3-4-7 91.30 89.92
Source : Jaya et.al (1997)
Table 3. Accuracy of change/no-change binary mask
No. From-to binary mask Accuracy
Overall (%) Kappa (%)
1 1988-1990 95.75 90.87
2 1988-1992 99.38 98.75
3 1990-1992 98.57 97.12
These binary masks were then applied to map the areas of undergoing change. When the unchanged areas were masked out, the distribution and types of change between two dates were easily recognized, and the extend of changes could be estimated. In the post-classification comparison map, a judicious interpretation should be made. The types of changes that appear to be impossible should be ignored.
Based upon the accuracy of classified TM 1988, 1990 and 1992, as well as the
accuracy of binary mask for each date pair, the “from-to” change detection map could be estimated (Table 4). It was shown that the accuracies (Kappa) of change detection maps provided using PCC method, are ranging from 87.5% to 90.1%. From this comparison, it was found that mangrove vegetations are not underpressure between 1988 and 1990. Proportion of mangrove vegetation only decreased slightly of about 3.1%. From 1990 to 1992, the proportion of mangrove increased from 13.5% to 20%. In this study area, there is a change from bare land (establishment of new golf course) in 1988 to grass land (established golf course) in 1990 & 1992. From 1988 to 1990, the settlement had increased drastically from only 18% to 35% of the study area. In 1992, the decrease of settlement proportion is might due to misclassification error. Along the Muara Angke Beach, the extent of fish pond tend to increase. Field observation (Jaya et al., 1997) found that the land use for rice field has changed become more promising use such as fish pond. Proportion of fish pond is approximately 11.74% in 1988 and 17.5% in 1992.
Table 4. Change detection map accuracy using post classification comparison
No. From-to map Accuracy
Overall (%) Kappa (%)
1 1988-1990 95.25 95.08
2 1988-1992 89.25 87.55
3 1990-1992 88.96 87.80
Six-dimensional multitemporal principal component (6-D MPC)
few components. As indicated by its eigenvector, the vegetation changes will be highlighted in delta greenness image. Delta brightness image specifically expresses changes that are dominated by changes in water contents of land cover. Although the variance of both delta brightness and greenness is very small, ranging from only 3% to 4%, the summarized change information was very useful to localize where changes took place.
Table 5. Eigenvectors and eigenvalues of MPC
c) From 1990 to 1992
In the change detection map provided using 6-D MPC, land use changes are mostly from fishpond to housing settlement located in northern side of highway of Soekarno Hatta Airport (Pantai Indah Kapuk Real Estate). For all date pairs (1988-1990, 1988-1992 and 1990-1992), the types of change detected are: (1) change from water surface to land that includes changes from fish pond to housing and from seashore to accumulation of garbage along side the Jakarta coast; (2) change from settlement to vegetation including establishment of urban forest (change from settlement to vegetation) and from bare land to shrub/bush; and (3) change from mangrove vegetation to settlement.
Within the study area, it was found that only small changes occurred from barren land to vegetation between 1988 and 1990. In this period, there is no significant regreenning program implemented. However, between 1988 and 1992, a high increase of changes from bare land to vegetation was found a long side of highway of Soekarno Hatta Airport. From 1990 to 1992, many of vegetated areas were converted to settlement
Direct multidate classification (DMC)
that the algebraic sign of eigenvector is consistent with the study of Jaya and Kobayashi (1994 and 1995b).
Figure 2. Proportion of each land cover in 1988, 1990 and 1992, obtained using Post-classification Comparison
CONCLUSION
From the study results it could be concluded that:
The PCC method appears to be more complicated, and therefore judious interpretation
should be made when impossible “from-to” change occurred. This irrational type of change could not be avoided, since a perfect registration is difficult to achieve.
Although 6-D MPC provides slightly less accurate of approximately 3% ~ 4% than the others, this technique was recognized to be simple and effective method to detect land cover changes and for computational efficiency 6-D MPC is reasonable enough. For a quite diverse covers such as urban and suburban area, the 6-D MPC method give relatively accurate results.
ACKNOWLEDGEMENT
The author would like to extend his appreciation to Miss Kuswibowoningsih and Mr. San Andre Jatmiko for their help during the ground survey and data analysis. Sincerely thanks are also extended to Mr. Soedari Hardjoprajitno and Mr. M. Buce Saleh, for their advices and invaluable help during the implementation of the study.
LITERATURES CITED
Abe, N., Jaya, I N. S. and H. Kamioka, 1996. Estimation of vegetation ratio in urban area using Landsat TM Images. Journal of Forest Planning, 2, 59-65.
Jaya, I N.S. and S. Kobayashi, 1994. Forest change detection using multitemporal algorithm. Proceeding of NAFRO seminar on sustainable forestry and its biological environment, pp. 19-34.
Jaya, I N. S. and S. Kobayashi, 1995a. Classification of detailed forest types based upon the separability algorithm: a case study in the Yahiko Mountain and Shibata Forest Areas, Niigata Prefecture. Journal of Remote Sensing Society of Japan, 15 (1): 40-53.
Jaya, I N. S. and S. Kobayashi, 1995b. Detecting Changes in Forest Vegetation using Multitemporal Landsat TM Data: a case study in the Shibata Forest Areas, Niigata Prefecture. Journal of Forest Planning, 1, 23-38.
Jaya, I N. S., S. Kobayashi and D. Nagamoto, 1996. Improving change detection accuracy using simple regression method. Proceeding of the Symposium on Forest Inventory and Monitoring in East Asia. Japan Society of Forest Planning Press. 95-104. Jaya, I.N.S., S. Hardjoprajitno and M.B. Saleh, 1997. The effect of the Rural Development
to the Forest Function: A case study in Muara Angke, Jakarta. Scientific Report Submitted to Osaka Gas Foundation, International Cultural Exhange. Faculty of Forestry, Bogor Agricultural Univeristy.
Jensen, J.R., 1986. Digital Image Processing. A Remote Sensing Persepective Prentice-Hall, Englewood Cliff, New Jersey 07632