82 ©Ikatan Sarjana Oseanologi Indonesia dan Departemen Ilmu dan Teknologi Kelautan, FPIK-IPB
SKIPJACK TUNA IN RELATION TO SEA SURFACE TEMPERATURE AND CHLOROPHYLL-A CONCENTRATION OF BONE BAY USING REMOTELY
SENSED SATELLITE DATA
Mukti Zainuddin
Faculty of Marine Science and Fisheries, Hasanuddin University
ABSTRACT
Skipjack tuna is an important species targeting by pole and line fishery in Bone Bay. The distribution and abundance of this species tended to aggregate to the preferred bio-physical environments. To describe the short term relationship between skipjack tuna and oceanographic conditions and to visualize the predicted high catch areas, remotely sensed satellite based-oceanographic sea surface temperature (SST) and chlorophyll-a together fisheries data were used. Results indicated that the highest skipjack CPUEs were mainly found in coastal areas of Palopo and Kolaka both in 2007 and in 2009 during the period of study. The high tuna concentrations corresponded well with chlorophyll-a of 0.15-0.40 mg mg-3 and SST of 29.0-31.5 °C. The preferred ranges provide a good indicator for initially detecting potential skipjack fishing grounds. This study suggested that thermal and chlorophyll fronts as well as upwelling may important mechanisms in explaining the temporal and spatial dynamics of skipjack tuna distribution and abundance in Bone Bay.
Keywords: skipjack tuna, potential fishing grounds, satellite images and fronts
I. INTRODUCTION
The importance of sea surface temperature for operational fisheries oceanography is due mainly to the fact that it can be used as an (indirect) indicator of areas of fish forage concentration, that are also potential favorable zones for fish aggregation and migration (Santos, 2000). sea surface temperature (SST) can influence the geographical range of marine species, the observed association of albacore with ocean thermal structures cannot be explained by temperature per se, but involve also other behavioural mechanisms linked with feeding activity (Laurs, 1984). The oceanographic parameter is one of important oceanographic parameters to study skipjack tuna habitat in tropical region (Bertignac et al., 1998).
Skipjack tuna is the most important species targeting by local fishermen in
the Bay of Bone, South Sulawesi. The distribution and migration of this species are strongly influenced by oceanographic factors such as distributions of SST and chlorophyll-a (hereafter Chl-a) density (Zainuddin and Jamal, 2009; Zainuddin, 2009). The distribution of the 29°C SST isotherm is a reasonable proxy to detect the region of highest skipjack CPUEs (frontal area) in western Pacific Ocean (Lehodey et al., 1997). The highest skipjack CPUEs off the southern Brazilian coast occur in waters of SST 22°-26.5°C, although that relationship varied seasonally (Andrade and Garcia, 1999). The migration route and feeding habitat for albacore in North Pacific Ocean have been detected using chl-a of 0.2 mg m-3 (Polovina et al., 2001).
Jurnal Ilmu dan Teknologi Kelautan Tropis, Vol. 3, No. 1, Juni 2011 83 migratory tuna. Significant information
of oceanographic conditions of SST and satellite data are determinant factors in predicting tuna forage and their habitat in Western North Pacific Ocean (Polovina
et al., 2001; Zainuddin et al., 2004;
Zainuddin et al., 2008). Therefore, the objectives of this study are to explore the short term relationship between oceanographic factors and skipjack tuna abundance, and to predict potential fishing grounds using SRS data and GIS techniques.
II. METHOD
The physical and biological environmental data used to describe the oceanographic conditions at the fishing ground were SST and Chl-a data derived from Aqua/MODIS. The NASA distributes Standad Mapped Image (SMI) level 3 binary data with HDF
(Hierarchical Data Format) format.
This study used the satellite data with monthly temporal resolution during May-June 2007 and 2009, at 0.044° of longitude and latitude spatial resolution. The data were processed using IDL
(Intercative Data Language) software
package to get image data throughout the study area. The pole and line fishery data consisted of fishing ground position in latitude and longitude (using portable GPS/ Garmin 60), SST fishing boat (using digital thermometer) and daily CPUE (catch per unit effort) data. All the data were collected by following pole and line fishing operations as many as 281 trips. We compiled the daily data into monthly to match with the satellite data temporal resolution. The oceanographic data were linked to fishery
data to estimate and extract SST and Chl-a Chl-at Chl-and Chl-around fishing grounds.
In this study, firstly the fishing data were plotted on SST and Chl-a image maps. Then the oceanographic data around the fishing positions were extracted to understand the spatial and temporal distribution pattern of skipjack fishing grounds relative to the oceanographic conditions. To describe the relationship between oceanographic conditions of SST, chl-a, and skipjack CPUE, first, this study used histogram graphs of high catch data (the skipjack CPUEs more than quartile 3). Second, this study analyzed the stronger association between all the oceanographic variables and skipjack CPUE high catch data using empirical cumulative distribution function (ECDF) analysis. In this analysis, it used three
84 http://www.itk.fpik.ipb.ac.id/ej_itkt31 oceanographic variables in a fishing trip
i, t : an index, ranging the ordered observations from lowest to highest value of the oceanographic variables, yi : the CPUE obtained in a fishing trip i,
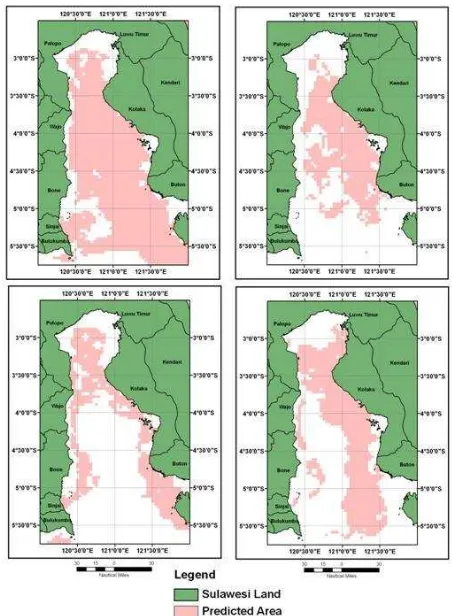
Predicted potential fishing ground was constructed from the significant and favorable ranges of the environmental variables (SST and chlorophyll-a). The map consisted of binary output in which the white color represents non predicted area, and the pink color denotes high probability area of finding skipjack. The potential fishing ground map was computed by combining the favorable oceanographic conditions of satellite images (significant variables) into a single map with the same spatial and temporal scale for each grid satellite data using ArcGIS Spatial Analyst.
III. RESULTS AND DISCUSSION
3.1. Results
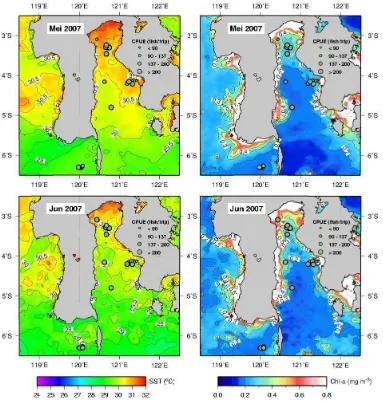
Distribution pattern of skipjack fishery showed that During May-June 2007 there were two main productive fishing grounds, i.e, northern area (Palopo region) and south eastern part of Bone Bay (Kolaka coastal waters) (Figure 1). Satellite data in May indicated that tuna concentrate in waters of 30.5-31.0°C SST and 0.20-0.30 mg m
-3
chlorophyll-a density. In June skipjack fishing grounds remain well form in the two productive fishing areas. The highest CPUEs associated with 30.5°C SST isotherm and 0.3 mg m-3 Chl-a isopleth either in northern or in southeastern area. It is clearly that during May-June, skipjack migrate to the southeastward of the Bone bay.
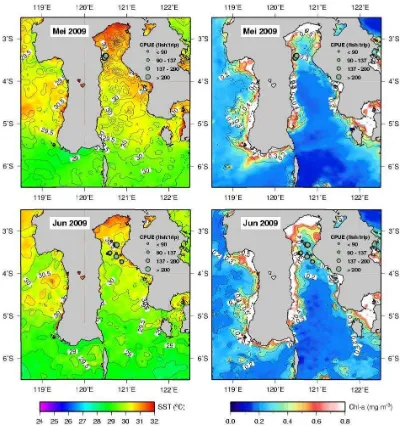
The spatial distribution of skipjack in May 2009 showed that the fish well aggregated near coastal waters of Palopo. The fish occupied the areas of 30.5 -31.5°C SST and 0.2 -0.3 mg m-3 chlorophyll-a concentration (Figure 2). In June, the actual fishing grounds chlorophyll-a than in the previous month. The catch data tended to occur in areas of relatively high SST and Chl-a variability.
The frequency of fishing days (trip) in relation to both SST and Chl-a derived from satellites showed that there are varied from 29.0 to 31.5°C and from 0.15 to 0.40 mg m-3, respectively. The preliminary study found that the relationship between SST fishing boat and SST satellite data was statistically significant (P <0.0001, n=460). Therefore, this study used SST satellite data together with Chl-a as input data on the prediction map to generate potential fishing zones for skipjack in the bay of Bone.
Jurnal Ilmu dan Teknologi Kelautan Tropis, Vol. 3, No. 1, Juni 2011 85 Figure 1. The Spatial Distribution of Skipjack CPUE (Skipjack/Fishing-Boat Days)
From Pole and Line Fishery Overlain on MODIS SST in May (a) and June (c) and MODIS Chl-a in May (b) and June (d) 2007.
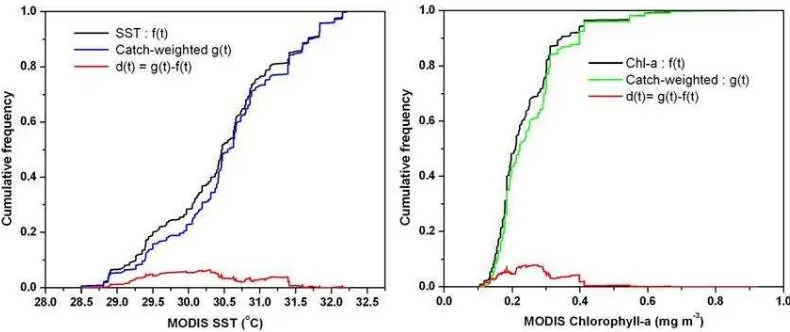
association between CPUE and the variables, SST ranging from 29.0 to 31.5ºC and Chl-a ranging from 0.15 to 0.40 mg m-3. The strongest associations between CPUE and the variables occurred at 30 ºC SST and 0.25 mg m-3 chlorophyll concentration, respectively. Skipjack CPUEs tended to decrease in areas of outside those favorable ranges.
Figure 5 shows distribution patterns of predicted potential fishing ground for skipjack from May to June 2007 and 2009 in Bone Bay. The catch
86 http://www.itk.fpik.ipb.ac.id/ej_itkt31
Figure 2. The spatial distribution of Skipjack CPUE (Skipjack/Fishing-Boat Days) from Pole and Line fishery overlain on MODIS SST in May and June (left) and MODIS Chl-a in May and June (right) 2009.
3.2. Discussion
Skipjack tuna spatial distributions in the Bone Bay are non random. They tend to aggregate within the preferred environmental conditions ( see Figures 1 and 2). Skipjack fishermen seem to rely on previous experience when they lead to fishing ground and search the suitable natural signatures such as ocean color and flying seabird schools for setting fishing gear. Although it appears that there is a non random sampling of fishing ground
Jurnal Ilmu dan Teknologi Kelautan Tropis, Vol. 3, No. 1, Juni 2011 87 Figure 3. Skipjack fishing frequency in relation to MODIS sst (left) and chl-a (right),
during May-June 2007 and 2009
Figure 4. Empirical cumulative distribution frequencies for (right) MODIS chlorophyll-a, (left) MODIS SST, and SST and chlorophyll-a as weighted by skipjack catch during May-June 2007 and 2009.
0.15-0.40 mg mg-3 and SST of 29.0-31.5 °C ) can be regarded as an initial indication of areas with highest probability of finding skipjack tuna in the Bone Bay. These SST and chlorophyll-a ranges represent the optimum oceanographic preferences particularly during May-June in the Bone Bay and are very similar to that suggested for skipjack and tuna fishery in another seasons and locations (Stretta, 1991; Zainuddin et al., 2008; Zainuddin and Jamal, 2009). In the study area,
88 http://www.itk.fpik.ipb.ac.id/ej_itkt31
Figure 5. The spatial distribution of the predicted area of potential fishing grounds for skipjack tuna produced by ECDF analysis in May (upper left), June (upper right) 2007 and in May (lower left) and June (lower right) 2009
oceanographic structures such as front and upwelling areas which could be observed by SST and Chl-a images. Therefore, the combined SST and chlorophyll-a could be considered as a reasonable index of the oceanographic conditions enhancing the occurrence of pole and line skipjack fishing days in the study area.
This study suggests that confluence of these two proxy indicators creates preferable water masses (fronts) known as a predicted area for skipjack where availability of food may be enhanced (Figure 5). It indicates that the catch data tended to occur in areas of relatively high SST and Chl-a variability (Figures 1 and 2). Skipjack tuna are commonly known to consume a wide range of epipelagic prey items ranging from larger zooplankton such as euphausiids,
Jurnal Ilmu dan Teknologi Kelautan Tropis, Vol. 3, No. 1, Juni 2011 89 another oceanographic parematers such
as SST. Therefore, all these synoptic ranges can be used as reliable proxies for detecting potential tuna fishing ground during the study period. These may represent the optimum combination of chlorophyll-a and temperature fronts, which are capable of creating potential fishing ground (Figure.5). During the period of study, the potential skipjack fishing grounds develop near Palopo area, along the coast of South Sulawesi and Kolaka coastal waters. The areas are clearly predicted using satellite images.
The potentially productive fishing areas may also be linked with the development of upwelling activity in Banda Sea (Wirtky, 1961). This study hypothesizes that during the east season, the southeast monsoon drives current direction westward in Bone Bay, transporting nutrient rich-water to area, subsequently good skipjack fishing grounds well form.
IV. CONCLUSIONS
The potential fishing grounds for skipjack may correspond well with the dynamics of thermal and chlorophyll front which could be identified by synoptically preferred oceanographic conditions of SST, Chl-a. This study suggests that the preferred ranges of the oceanographic conditions provide a good indicator of initially detecting the potential fishing grounds for skipjack tuna in the Bone Bay. This short descriptive study illustrates that these findings could be as a preliminary nature of results in identifying potential skipjack fishing grounds using satellite images.
REFRENCES
Andrade, H.A. and A.E. Garcia. 1999. Skipjack tuna in relation to sea surface temperature off the southern
Brazilian coast. Fish. Oceanography, 8(4):245-254.
Bertignac, M., Lehodey, P and Hampton, J. 1998. A spatial population dynamics simulation model of Tropical tunas using a habitat index based on environmental parameters.
Journal of Fisheries Oceanography.
7:326-334.
Olson, R. J., and C. H. Boggs. 1986. Apex predation by yellowfin tuna (Thunnus albacores): Independent estimates from gastric evacuation and stomach contents, bioenergetics and cesium concentrations, Can. J.
Fish. Aquat. Sci., 43:1755– 1760.
Gower, J. F. R. 1972. A survey of the uses of remote sensing from aircraft and satellites in oceanography and hydrography, Pac. Mar. Sci. Rep.72-3, 39 pp., Inst. Ocean. Sci., Sidney, Canada.
Laurs, R.M., P.C. Fielder, and D.R. Montgomery .1984. Albacore tuna catch distributions relative to environmental features observed from satellites. Deep-Sea Res., 31(9): 1085-1099.
Lehodey, P., Bertignac, M., Hampton, J., Lewis, A. and Picaut, J. 1997. El
forage distributions in the equatorial Pacific using a coupled dynamical bio-geochemical model. Fish.
Oceanogr. 7: 317-325. Polovina, J.J.,
Howel, E., Kobayashi, D.R. and Seki, M.P. 2001. The transition zone chlorophyll front, a dynamic global feature defining migration and forage habitat for marine resources.
Progress in Oceanogr., 49:469-483.
90 http://www.itk.fpik.ipb.ac.id/ej_itkt31 review. Fisheries Research,
49:1-20.
Stretta, J.M. 1991. Forecasting models for tuna fishery with aerospatial remote sensing. Inter. J. Remote
Sensing, 12(4):771-779.
Zainuddin, M., K. Saitoh and S. Saitoh. 2004. Detection of potential fishing ground for albacore tuna using synoptic measurements of ocean color and thermal remote sensing in the northwestern North Pacific.
Geophys. Res. Letters, 31, L20311,
doi:10.1029/2004GL021000.
Zainuddin, M., K. Saitoh and S. Saitoh. 2008. Albacore tuna in relation to oceanographic condition in the northwestern North Pacific using remotely sensed satellite data.
Journal of Fisheries Oceanography.
17(2):61-73.
Zainuddin, M. 2009. Estimating Total Allowable Catch and Mapping Potential Pelagic Fishing Ground in
Selayar Waters Using
AQUA/MODIS Satellite Imagery.
Journal of Torani, 19(1):36-42.
Zainuddin, M. and M. Jamal. 2009. Satellite remote sensing and geographic information system of potential fishing zone for skipjack tuna in Bone Bay, South Sulawesi. International Proceeding of World Ocean Conference, Manado 15-20 Mei 2009