VEHICLE BRAKE LIGHT DETECTION USING HYBRID COLOR MODEL
MOHD FIDZRIN BIN MOHD HAMIZAZ
This report is submitted in partial of the requiremnets for the award of Bachelor of Electronic Engineering (Computer Engineering) With Honours
Faculty of Electronic and Computer Engineering Universiti Teknikal Malaysia Melaka
UNIVERSTI TEKNIKAL MALAYSIA MELAKA
FAKULTI KEJURUTERAAN ELEKTRONIK DAN KEJURUTERAAN KOMPUTER
BORANG PENGESAHAN STATUS LAPORAN
PROJEK SARJANA MUDA II
Tajuk Projek : VEHICLE BRAKE LIGHT DETECTION USING HYBRID COLOR MODEL
Sesi
Pengajian : 1 3 / 1 4
Saya MOHD FIDZRIN BIN MOHD HAMIZAZ (HURUF BESAR)
mengaku membenarkan Laporan Projek Sarjana Muda ini disimpan di Perpustakaan dengan syarat-syarat kegunaan seperti berikut:
1. Laporan adalah hakmilik Universiti Teknikal Malaysia Melaka.
2. Perpustakaan dibenarkan membuat salinan untuk tujuan pengajian sahaja.
3. Perpustakaan dibenarkan membuat salinan laporan ini sebagai bahan pertukaran antara institusi
pengajian tinggi.
4. Sila tandakan ( √ ) :
SULIT* *(Mengandungi maklumat yang berdarjah keselamatan atau kepentingan Malaysia seperti yang termaktub di dalam AKTA RAHSIA RASMI 1972)
TERHAD** **(Mengandungi maklumat terhad yang telah ditentukan oleh
organisasi/badan di mana penyelidikan dijalankan)
TIDAK TERHAD
Disahkan oleh:
__________________________ ___________________________________ (TANDATANGAN PENULIS) (COP DAN TANDATANGAN PENYELIA)
iv
“I hereby declare that this report is the result of my own except for quotes as cited in the references”
Tandatangan : ………...
iv
“I hereby declare that I have read this report and in my opinion this report is sufficient in terms of the scope and quality for the award of Bachelor of Electronic Engineering (Computer
Engineering) With Honours”
Tandatangan : ………...
vi
ACKNOWLEDGEMENT
vii
ABSTRACT
viii
ABSTRAK
ix
CONTENTS
CHAPTER CASE PAGE
PROJECT TITLE i
DECLARATION iii
SUPERVISOR AUTEHNTICATION iv
DEDICATION v
ACKNOWLEDGEMENT vi
ABSTRACT vii
ABSTRAK viii
CONTENTS ix
TABLE LISTS xi
FIGURE LIST xii
I INTRODUCTION
1.1 Introduction 1
1.2 Problem Statement 2
1.3 Objective of Study 3
1.4 Scope of Work 3
1.5 Significant of Study 3
1.6 Thesis Organization 4
II LITERATURE REVIEW
2.1 Previous Research on Vehicle Brake Light Detection 5
2.1.1 Color Model Based Concept 6
2.1.2 Sensor Based Concept 10
2.2 Previous Research on Segmentation Method 12 2.2.1 Otsu’s Method of Segmentation 12 2.2.2 Clustering Techniques of Segmentation 13
2.3 Comparison of Color Model 13
2.4 Discussion 15
III METHODOLOGY
3.1 Project Flow Chart 17
x
3.3 RGB and HSI Color Model 19
3.4 Otsu’s Method 21
3.5 Algorithm Development 22
3.4.1 First Stage: Image Preprocessing 23 3.4.2 Second Stage: Evaluation of Threshold 24 3.4.3 Third Stage: Morphological Operations 25
IV RESULTS 27
4.1 Results 27
4.1.1 First Case: Morning 27
4.1.2 Second Case: Noon 31
4.1.3 Third Case: Evening 34
4.1.4 Fourth Case: Raining 37
4.2 Analysis of the System 40
4.3 Performance Comparison 41
V CONCLUSION AND RECOMMENDATION 43
5.1 Conclusions 43
5.2 Recommendations 44
REFERENCES
x
LIST OF TABLE
NO TITLE PAGE
1.1 Number of drivers involved in road accidents 2
2.1 Performance of Vehicle Lights Detection 6
2.2 The detection rate evaluated using two cases 7 2.3 The detection rate evaluated using the dataset of four categories 8
2.4 Comparison between two projects 8
2.5 The accuracy of the rear-end collision risk estimation 10 2.6 Performance Rate of Vehicle Tracking and Restoration 12
2.7 Comparison of color model 15
4.1 Case one: Morning 38
4.2 Case two: Noon 38
4.3 Case three: Evening 38
4.4 Case four: Raining 38
4.5 Mean for the Analysis of Overall Performance for Each Cases 38
xi
LIST OF FIGURES
NO TITLE PAGE
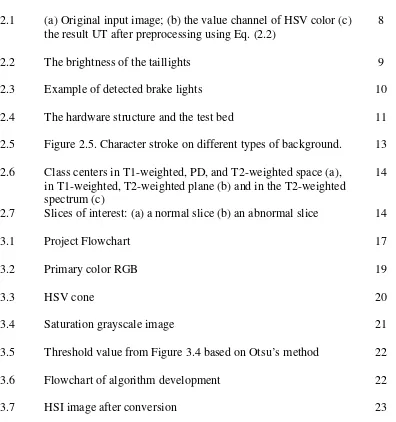
2.1 (a) Original input image; (b) the value channel of HSV color (c) the result UT after preprocessing using Eq. (2.2)
8
2.2 The brightness of the taillights 9
2.3 Example of detected brake lights 10
2.4 The hardware structure and the test bed 11
2.5 Figure 2.5. Character stroke on different types of background. 13 2.6 Class centers in T1-weighted, PD, and T2-weighted space (a),
in T1-weighted, T2-weighted plane (b) and in the T2-weighted spectrum (c)
14
2.7 Slices of interest: (a) a normal slice (b) an abnormal slice 14
3.1 Project Flowchart 17
3.2 Primary color RGB 19
3.3 HSV cone 20
3.4 Saturation grayscale image 21
3.5 Threshold value from Figure 3.4 based on Otsu’s method 22
3.6 Flowchart of algorithm development 22
Chapter I
INTRODUCTION
1.1 Introduction
In automobile industry, safety issue is the most important aspect that needs to be considered for the manufacturer and the designer in designing the vehicle. However, with current safety feature there are still accidents happened and increasing by years. In our opinion, despite of being focus on the safety feature of the material of the vehicles they should focus more on the safety feature of the vehicles system.
2 Thanks to recent technology which can be used to develop the image processing algorithm to detect color based which is reliable when to detect vehicle brake, traffic light, etc. With this approach, we come up with a project named ‘Vehicle Brake Light Detection using Hybrid Color Model’.
In the next section, we will have a view of problem statement, objective of study, scope of work, significant of study and thesis organization.
1.2 Problem Statement
There are quite high numbers of accident in Malaysia. Table 1.1 show the number of drivers involved in road accidents acquires from Polis Diraja Malaysia and also shows that accidents in Malaysia are increasing from 2007 to 2011. The highest number of accidents in Malaysia is in year 2007 which is 26691. One of the causes of the accidents is the attitude or behavior of the driver that does not follow the law while driving. Furthermore, not following safety distance driven by the driver is also one of the causes. The more the distance travelled, the higher the chance to get into an accident because the driver will be tired. Thus, this project is proposed and it also can be applied in an intelligent vehicle in the future to reduce the numbers of accidents in Malaysia.
Table 1.1: Number of drivers involved in road accidents [1] Type of Vehicles 2007 2008 2009 2010 2011
Total 26691 25274 24960 22527 25570
Bus 73 70 50 46 225
Jeep 229 245 209 235 495
Trailer/Lorry 550 487 455 400 654
Motorcars 3514 3303 3556 3003 4868
Motorcycle 18151 17533 17172 15726 16240
Van 281 241 191 213 364
Bicycle 979 818 785 613 598
Pedestrian 2738 2399 2367 2161 1859
3 1.3 Objective of Study
The objectives of this project are:
(a) To detect vehicle brake light by using combination of RGB color model and HSI color model.
(b) To analyze the overall performance of the systems in terms of percentage of detection and time consumption.
1.4 Scope of Work
The scopes of this project are:
(a) MATLAB software will be used to develop the algorithm.
(b) Four weathers will be considered as condition in image capturing which are morning, noon, evening and raining.
(c) Canon Power Shot A2500 16 Megapixels camera will be used to capture the sample images.
1.5 Significant of Study
4 help driver in safety driving and help the automobile industry to growth. Therefore, the number of accident in Malaysia can be reduced.
1.6 Thesis Organization
This report consists of five chapters. The summary of each chapter will be explained as follow.
Chapter 1 will describe about introduction of the vehicle brake light detection, problem statement that describe the reason for developing the project, objective of the project, scope of work, significant of study and thesis organization.
Chapter 2 is about review on previous research by other researcher in other countries. Various methods and approaches that related to this project have been discussed and reviewed.
Chapter 3 explains about method that will be used in this project. RGB color model, HSI color model and Otsu’s method will be described in this chapter. Segmentation and filtering of sample images also will be carried out in this chapter.
Chapter 4 explains about result of the simulation from the five weathers condition. Next, results will be analyzed and percentage of detection and time consumption will be computed.
Chapter II
LITERATURE REVIEW
This chapter explains about the background research which related to this project. Brief explanation about the perspective and methods used in the previous research is present in this chapter. We also show how this project is related with the available research and how it is different from the others.
2.1 Previous Research on Vehicle Brake Light Detection
6 prevention of otherwise deadly accidents. In the next section, we will have a view of this method and perspective used in previous research.
2.1.1 Color Model Based Concept
Color model is an abstract mathematical model describing the way colors can be represented as tuples of numbers, typically as three or four values or color components. When this model is associated with a precise description of how the components are to be interpreted, the resulting set of colors is called color model [10].
Cabani et al. proposed color-based detection of vehicle lights as an approach in the conception of a vision system dedicated to the detection of vehicles in reduced visibility conditions. The development of the system which detects vehicle lights consists of five major steps which are transformation RGB to L*a*b*, the choice of L*a*b* color space, rear-lights and rear-brake-lights detection, flashing-light detection and reverse-light and headlight detection. The results of the experiment of this project is tabulated in Table 2.1, performance of vehicle light detection. False detection of white color are often due to reflection of headlights on the road. Non detection of red color correspond to rear lights of far vehicles. False detection of orange color are due to saturation of rear lights in the image [2].
Table 2.1: Performance of Vehicle Lights Detection [2] Color Detection white red orange Number of processed images 426 426 236
Total number of lights 660 382 47 Total number of detected lights 631 184 30
False detection 24 2 3
7 vehicle in shape. This methods they are using consists of two major stages which are candidate regions detection using YCbCr color model, frequency domain analysis of taillight regions and brake-light detection in frequency domain. The sample image taken is converted from RGB color model to YCbCr color model. Then the luminance channel of YCbCr is used to detecting tail lights. For the result of this project, the sample image captured under different situation is set to 320 x 240 resolution value. The sample image can be separated into two different cases which are one is the condition that one major vehicle appears in front and case two is the condition that multiple major vehicles are present in the camera field of view. The overall detection rate is about 73.7% and details quantitative evaluation of detection rare is shown in Table 2.2 [3].
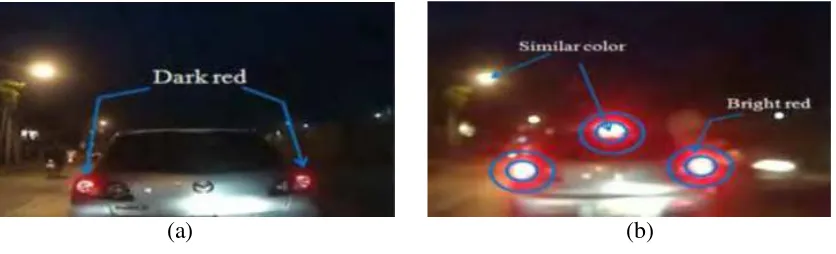
A year after that, Chen et al. also introduced a new approach that can detect brake lights at night by analyzing the taillights based on Nakagami-m distribution. This time they use RGB color model, HSV color model and Nakagami-m distribution for the brake light detection. First, the original video frame is transformed from RGB color model to HSV color model due to the characteristic of the contrast of V-channel between taillights and the background environment are large. Next Eq. (2.1) and Eq. (2.2) will be applied in preprocessing the sample image in Figure 2.1(a) Original input image of RGB color model, (b) the value channel of HSV color model in grayscale and (c) the result after segmentation process. The result for this project will be show in the Table 2.3 [4]. Table 2.3 shows the detection rate evaluated using dataset of four categories. The improvement from this project is shown in Table 2.4. Table 5 summarize the effectiveness in detection rate for both project.
Table 2.2: The detection rate evaluated using two cases [3]
Ground Truth
Number of
Detected Detection Rate
Case 1 13 10 76.90%
Case 2 17 12 70.50%
� (�) =�1, ��� ≥0.4
0, ��ℎ������ , (2.1)
8
Figure 2.1: (a) Original input image; (b) the value channel of HSV color(c) the
result UT after preprocessing using Eq. (2.2) [4]
Table 2.3: The detection rate evaluated using the dataset of four categories [4] Video Classification Ground
Truth Number of Detected Detection Rate Averag e Cas e Distanc e No. of Vehicles 1
closer 29 29 27 93.10%
86.30%
2 25 25 23 92%
3
further 26 26 21 80.80%
4 29 29 23 79.30%
Table 2.4: Comparison between two projects [5]
Project Average of Detection Rate
Frequency-Tuned Nighttime
Brake Detection 73.7 %
Scattering-based Brake Light
9 Thammakaroon and Tangmchit used taillight characteristics such as area of red lights, size of the largest brake lights and prediction of a brake warning approach based on distance estimated from analysis of taillights in front. The algorithm uses a threshold obtained from statically collection of 50 sample images to detect red color on an RGB color model. RGB color model is used as the first step to ready the images so that it can be used in the next step. These researchers observed the light source by using camera. The camera is placed one meter away from the camera and the light source. Then, they use HSI color model is used to adjust the camera’s gain based on the intensity value of the (I) channel. The brightness of the taillights were captured and the difference between active and inactive taillights gained from the camera will be recorded. Figure 2.2 shows the brightness of taillights for inactive and active taillights.
(a) (b)
Figure 2.2: The brightness of the taillights. (a) Inactive taillights. (b) Active taillights [5]
10 morphological method, they indicate the detected brake lights by the bounding boxes as shown in Figure 2.3 (b). Figure 2.3 shows the example of detected brake lights.
(a) (b)
Figure 2.3: Example of detected brake lights. (a) The group of white pixels. (b) The detected brake lights are indicated by the bounding boxes [5]
Results from this system can attained a high accuracy about 90% detection in the driver’s action prediction. The hypothesis, the collision risk, which derived from the taillights, has a close relationship with the actual brakes is supported. The experimental result accuracy will be tabulated in Table 2.5 [5]. Table 6 shows the accuracy of the rear-end collision risk estimation.
Table 2.5: The accuracy of the rear-end collision risk estimation [5]
Results Percentage
Correct predictive 89.9997%
False positive 5.603%
False negative 4.400%
11 Kim et al. presented front and rear vehicle detection and tracking in the day and night using vision and sonar sensor. The use of sonar sensor is for detection and distance estimation within 10 m and use of image sensor is for over 10 m range. These researchers proposes a simple method that can be determine the light condition by observing several images and light condition is used by selecting one of several detection methods. Figure 2.4 will show how the system is implemented into the vehicle. These researchers uses two cameras so that it can detect vehicles in two different range, medium and far range. The cameras were installed by the side of a rear-view mirror and at the ceiling above the back seats. Meanwhile, the two sensors were installed at the front and rear bumpers.
Figure 2.4: The hardware structure and the test bed [6]
12
Table 2.6: Performance Rate of Vehicle Tracking and Restoration [6] Sample\ Detection result Vehicle Non-Vehicle
Vehicle 96% 4%
Non-Vehicle 2% 98%
2.2 Previous Research on Segmentation Method
In image processing, there are few steps involve in order to detect the color from an image and one of the method is image threshold. Thresholding is an important part in image segmentation, where we want to extract the object from the background. When we do the image processing which involve image segmentation, one of the common method of thresholding is Otsu’s method [11]. In the next section, we will have a view of this method and perspective used in previous research.
2.2.1 Otsu’s Method of Segmentation
Xiangyu et al proposed stroke-model-based character extraction from gray-level document images. In order to describe the local features of object as double-edges in predefined size, a stroke model must be implemented. By using gray-level thresholding techniques, they can choose which pixels are having gray levels lower than threshold value and which are not. For the pixels that lower than threshold value, it will labelled as black, else white. Eq.2.3 will shows the pixels output with some condition applied [7].
�(�,�) =�1, ���(�,�) <�(�,�) ����(�,�) >�∅
![Table 1.1: Number of drivers involved in road accidents [1]](https://thumb-ap.123doks.com/thumbv2/123dok/518933.59388/14.595.144.493.573.750/table-number-drivers-involved-road-accidents.webp)
![Table 2.1: Performance of Vehicle Lights Detection [2]](https://thumb-ap.123doks.com/thumbv2/123dok/518933.59388/18.595.162.475.587.674/table-performance-of-vehicle-lights-detection.webp)
![Table 2.4: Comparison between two projects [5]](https://thumb-ap.123doks.com/thumbv2/123dok/518933.59388/20.595.168.472.72.195/table-comparison-between-two-projects.webp)
![Table 2.5: The accuracy of the rear-end collision risk estimation [5]](https://thumb-ap.123doks.com/thumbv2/123dok/518933.59388/22.595.161.504.144.292/table-accuracy-rear-end-collision-risk-estimation.webp)
![Figure 2.4: The hardware structure and the test bed [6]](https://thumb-ap.123doks.com/thumbv2/123dok/518933.59388/23.595.135.498.317.434/figure-hardware-structure-test-bed.webp)
