Optimum Network Reconfiguration and
DGs Sizing With Allocation Simultaneously
by Using Particle Swarm Optimization
(PSO)
M. N. M. Nasir a,1, N. M. Shahrin a,2, M. F. Sulaima a,3 Mohd Hafiz Jali a,4, M. F. Baharom a,5
a
Hang Tuah Jaya 76100 Durian Tunggal Melaka
Faculty of Electrical Engineering Universiti Teknikal Malaysia Melaka 1
Abstract—This paper presents three stages of methodology. The first stage is to identify the switching operation for radial network configuration while observe the power losses and the voltage profile without Distributed Generation (DG). The second stage is based on previous paper which is feeder reconfiguration for loss reduction with DGs. The last stage is sizing and allocation DGs at buses with low voltage profile resulted from the first stage to improve the power losses and voltage profile also comparing the result with the second stage. The objective of this method proposed is to show that allocation of DGs simultaneously based on low voltage profile can improve network power losses and improvement of voltage profile. The result shows that improvement on network power losses is 54.92% from Distribution Network Reconfiguration (DNR) method. All three stages were tested on standards IEEE 33 bus system by using Particle Swarm Optimization (PSO) technique in MATLAB software. This method proved that improvement of power losses and voltage profile by switching and DGs allocation method.
Keyword-Distributed Generation, switching operation, loss reduction and voltage profile.
I. INTRODUCTION
Distribution Generation is a small scale technology use to provide source of active power. It is located near end user of customer or near to the load in the distribution network. Distribution resources is a demand and supply side resources that can be deployed along electric distribution system as set apart from the transmission system to encounter the energy requirement and reliability as needed by the customers. Distributed resources consist of two aspects. First is distributed generation and second are demand side resources. Distributed generation located at any bus along distribution system or on customer site. Demand side resources also known as load management system which is to move electricity from peak period to off peak periods to reduce the overall electricity demand. In other words, demand-side resources not only based on local generation within distribution system on customers side but also mean to reduce customer demand [1]. To give the maximum use of DG, it has to be installed with optimum sizing and suitable location. Fail to do so will make load node voltage along the feeder to increase [2].
Distribution network generally designed in closed loop and operated in open loop and it involves large quantity of section switches and small amount of tie-switches. IEEE 33-Bus radial system was illustrated as distribution network for this method. Distribution Network Reconfiguration (DNR) is the process of changing the open/close status of sectionalizing and tie switches in the distribution network. Two types of switches were used in distribution system which is sectionalizing-switches and tie-switches. Sectionalizing-switches are a type of switch that normally opens while tie-switch is vice versa. Objective of DNR is to reduce power losses and relieve overload in the network. In the proposed method, the present of DG with network reconfiguration to improved losses in the system and improve voltage profile. There are three problem-solving algorithms to solve this problem; a) the classical mathematical optimization algorithm. b) heuristic algorithms. c) artificial intelligence (AI) based algorithms such as simulated annealing (SA), tabu search (TA), family eugenics based evolution algorithm (FEBE), genetic algorithm (GA), immune algorithm (IA), and Particle Swarm Optimization (PSO). These algorithms perform well to find the best optimal solution [3-6].
example to search food. The group with this relative behavior including bee swarm, fish school and bird flock. Some of advantages PSO technique over other optimization techniques is it can handle objective function with stochastic nature and does not require any good initial solution to start the iteration process. However PSO also got some disadvantages which is it needs more parameter for tuning also required programming skills to develop and modify the algorithm to suit different optimization problems [8-9].
There are many ways to do allocation and sizing methods. One of the ways that proposed by [10-14] is located the DG at all busses with using PSO method. Author [11] proposed the method with two DGs allocation at all bus and examine the total harmonic distortion percentage can be reduced with two DG installation. In the other hand, author [13] stated that the location of DG depend on load demand. So, the size of DG will be varying according to the load demand. Other than that, [15] proposed a combination of PSO and GA method in order to find optimal placement and sizing of DG. Genetic algorithm (GA) method were used to find the placement of DG because GA provides great flexibility and suited in solving complex optimization problems [16-17]. After that, the results from GA simulation used in PSO to find optimize the sizing for DG. DG allocation and sizing also can be done by using other algorithm method such as Immune Algorithm as in [18]. IA is a biometric intelligent calculation by imitating the behavior of biological immune system. The comparison of Evolutionary Programming (EP), Artificial Immune System (AIS) and Particle Swarm Optimization were carried out to find the best techniques for allocation and sizing of the DG. It is proved that PSO technique better than EP and AIS in terms of voltage stability and voltage profile minimization [19]. Optimum allocation and DG sizing can enhance efficiency in the distribution system. Analysis method by [20] is implemented in two IEEE distribution test system. First is three phase unbalanced component model and the second is IEEE 123 node test feeder. The analysis been made conclude that loss reduction and maintaining voltage limit can be possible by allocating and sized DG unit in optimum way to make distribution system more efficient.
II. PROBLEM FORMULATION
The objective for DNR is to find radial network structure in order to minimize power losses. The problem can be formulated as follows [9].
Min Plosses =∑ =nn 1Ii 2kiRi i∈N (1)
N= total number of branches,
= resistance of branch i,mmmk,lkm9oijjuii9ujuuuu
ki
A. Radial Network Constraint
= variable that represent the topology status of the branches (1= close, 0= open).
Radial network structure was composed in considering in the distribution network
B. Node Voltage Constraint
Voltage magnitude Vi V
at each node must be within its range to maintain power quality. min≤ Vbus≤ Vmax
The minimum voltage is 0.95 and maximum voltage is 1.05 (±5%).
(2)
C. Generator Operation Constraint
All DGs units are allowed to operate within acceptable limit where Pimin and Pimax P
= maximum current capability of branch k.
i. the current positions. ii. the current velocities.
iii. the distance between the current position and pbest. iv. the distance between the current position and gbest [8].
Fig. 1: Concept of modification of searching point by PSO [10]
Fig 2: Flowchart of PSO algorithm [10]
The modification of the particle’s position can be modeled by using equations (5) and (6).
vik+1=wvik +c1r1(pbesti −s1k)+c2r2(gbest −sik) (5)
sik+1= sik +vik+1 (6)
Where, 2 , 1c
c : The weighting factor,
2 , 1r
r : The random numbers between 0 and 1,
ω
: The weighting function,k
v
1 : The current velocity of particle i at iteration k, 11 +
k
k
s1 : The current position of particle iat iteration k,
1 1 +
k
s : The modified position of particle i,
i
pbest : The personal best of particle i,
i
gbest : The global best of the group.
The weighting function is set according to equation (7).
t
t
= maximum number of iterations,t
= current iteration number,max
ω
=maximum inertia weight,min
ω
= minimum inertia weight.The procedure of PSO implementation is as follows:
Step 1: The input data including network configuration, line impedance and status of DGs and switches are to be read.
Step 2: Set up the set of parameters of PSO such as number of particles N, weighting factors and C1 and C2. The initial population is determined by selecting the tie switches and DG size randomly from the set of the original population. The variable for tie switches represented by Pg.The proposed particles can be written as:
Step 3: Calculate the power loss using distribution load flow based on Newton-Raphson method.
Step 4: randomly generates an initial population (array) of particles with random positions and velocities on dimension in the solution space. Set the iteration counter k=0.
Step 5: For each particle, if the bus voltage is within the limits, calculate the total loss using distribution load flow. Otherwise, the particle is infeasible.
Step 6: Record and update the best value. The two best values are recorded in the searching process. Each particle keeps track of its coordinate in the solution space that is associated with the best solution it has reached so far. This value denoted as Pbest. Another best value denoted as Gbest, which is the overall best value obtained so far by any particle. Pbest and Gbest are the generation of switches, DG sizes and power loss. This step also updates Pbest and Gbest. At first, the fitness of each particle compare with its Pbest. If the current solution is better than its Pbest, then replace Pbest by the current solution then the fitness of all particles is compared to Gbest. If the fitness of any article is better than Gbest, then replace Gbest
Step 7: Update the velocity and position of particles. Equation (5) is applied to update velocity of the particles. The velocity of a particle is representing as the movement of the switches. Meanwhile, equation (6) is to update the position of the particles.
.
Step 8: End conditions.
Check the end condition, if it is reached the algorithm stop or else repeat step 3-7 until the end condition is satisfied.
IV.CASE STUDIES
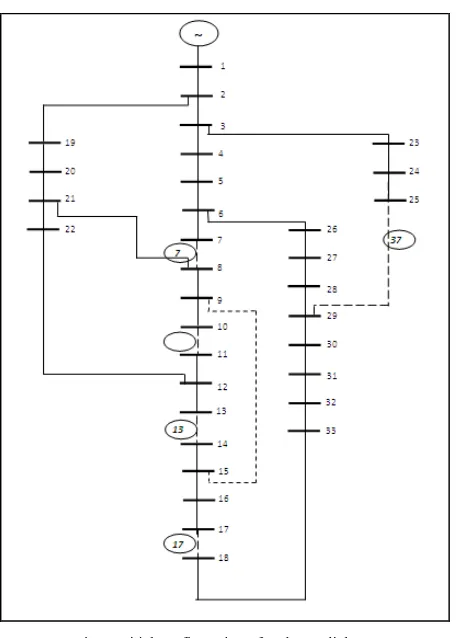
The system used for this method is tested on standard IEEE 33 bus test system as shown in Fig. 3. The system load is assumed to be constant with Sbase= 100MVA and Vbase
Case 1: The system with DNR by switches with radial configuration.
=12.66kV. The load and line data is referred in [21]. The total load of the system is 3715kW and 2300kVar. The maximum sizing for DG is set to 5MW and the population for test system is 50. All calculation is in per unit. Three cases are considered for this:
Case 2: Feeder reconfiguration with allocation and sizing DG based on [9].
Case 3: DNR and DG sizing and allocation based on lowest voltage profile on case 1.
Fig. 3.Initial configuration of 33 bus radial system
V. RESULTS AND DISCUSSIONS
The simulations were carried out by using MATLAB software and 20 results were collected. The result with minimum power loss is selected as shown in Table I. The result consists of 5 opened switches, total power losses, voltage profile and four DGs sizing.
Table I: Results of case study.
Items Case 1 Case 2 Case 3
Power loss (kW) 219.1 206.3 93
Loss reduction (%) - 5.84 54.92
CPU time (s) 24.4 17.3 40.3
Switches 13 9 26 6 33 33 6 4 12 9 7 31 9 28 14
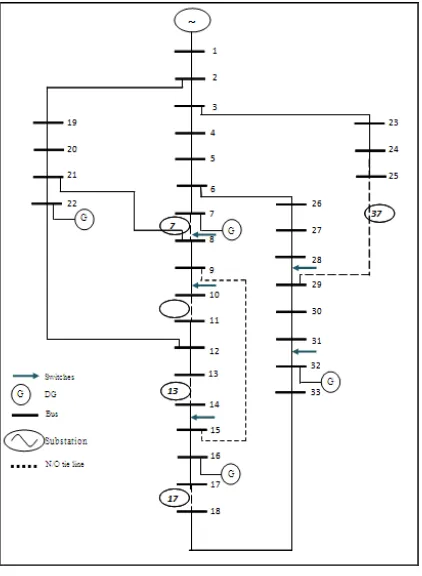
Figure 4: Network reconfiguration with allocation of DG
Table II DGs sizing for case 2.
No of DGs Location (bus no) DGs size (MW)
DG 1 6 1.2329
DG 2 16 0.5795
DG 3 22 1.5391
DG 4 29 2.0315
Table III DGs sizing for case3.
No of DGs Location (bus no) DGs size (MW)
DG 1 7 1.2217
DG 2 16 0.6416
DG 3 22 1.5618
DG 4 32 2.0300
Fig. 5. Voltage profile for case 1
Fig. 6. Voltage profile for case 2
Fig. 7. Voltage profile for case 3
Fig. 5, Fig. 6 and Fig. 7 shows the voltage profile for case 1, case 2 and case 3. It shows that allocation DG based on voltage profile can improved the voltage profile for the system as in Fig. 7. The minimum voltage profile for case 1 and case 2 is 0.997 compared to minimum voltage profile for case 3 is 0.999. Voltage profile for case 3 is more stable because the range is only between 0.999 and 1 compared to case 1 and case 2.
In the other hand, allocation and sizing of DG also improves voltage profile because DG were located at bus with low voltage profile. This method has improved voltage profile slightly about 0.07% from case 1. For case 1, the minimum voltage profile is 0.997 occur at bus 7, 8, 9, 14, 15, 16 and 17. For case 2, the minimum voltage profile is 0.997 at bus 7, 8, 9, 13, 14, 15 and 33 meanwhile for case 3, the minimum voltage profile is 0.999.
VI.CONCLUSIONS
ACKNOWLEDGMENT
The authors would like to acknowledge Centre of Excellence UTeM (CeRIA) and Universiti Teknikal Malaysia Melaka for the financial support of this research. This research is supported under the Research Acculturation Collaborative Effort Grant Scheme (RACE) with project code: FRGS(RACE)/2013/FKE/TK3/3/F00204.
REFERENCES
[1] Thomas Ackermann, Goran Anderson and LennartSoder, “Distributed Generation: a definition,” Electrical Power System Research 57 (2001) 195-204.
[2] Honghai Kuang, Shengqing Li, Zhengqiu Wu, “Discussion on Advantages and Disadvantages of Distributed Generation Connected to the Grid,” 978-1-4244-8165-1/11/$26.00 ©2011 IEEE.
[3] Yuan-Kang Wu, Ching-Yin Lee, Le-Chang Liu, Shaou-Hong Tsai, “Study of Reconfiguration for the Distribution System with Distributed Generators,” IEEE Transaction on Power Delivery, Vol.25, No.3, July 2010.
[4] B. Esmailnezhad, H. Shayeghi, “Simultaneous Distribution Network Reconfiguration and DG Allocation for Loss Reduction by Invasive Weed Optimization Algorithm,” Conference on Smart Electrics Technology (SEGT2012), December 18-19, 2012, Tehran, Iran.
[5] R. Srinivasa Rao, K. Ravindra, K. Satish, S.V.L. Narasimhan,”Power Loss Minimization in Distribution System Using Nework Reconfiguration in the Presence of Distributed Generation,” IEEE Transaction on Power System, Vol. 28, No.1, February 2013. [6] Zhenkun Li, Xingying Chen, Kun Yu, Yi Sun, Haoming Liu, “A Hybrid Particle Swarm Optimization Approach For Distribution
Network Reconfiguration Problem,” ©2008 IEEE.
[7] N. Phuangpornpitak, W. Prommee, S. Tia and W. Phuangpornpitak, “A Study of Particle Swarm Technique for Renewabble Energy Power Systems”.
[8] Yan Zhe-Ping, Deng Chao, Zhou Jia-Jia, Chi Dong-Nan, “A Novel Two-subpopulation Particle Swarm Optimization,” Proceedings of the 10th World Congress on Intelligent Control and Automation, July6-8,2012, Beijing, China.
[9] Wardiah Mohd Dahalan, Hazlie Mokhlis, “Network Reconfiguration for Loss Reduction with Distributed Generation Using PSO,” IEEE International Conference on Power and Energy (PEcon), 2-5 December 2012, Kota Kinabalu, Sabah, Malaysia.
[10] Krischonme Bhumkittipich and WeerachaiPhuangpornpitak, “Optimal Placement and Sizing of Distributed Generation for Power Loss Reduction using Particle Swarm Optimization,” 10th Eco-Energy and Materials Science and Engineering (EMSES2012). Energy Procedia 34 (2013) 307-317.
[11] Mohsen Sedighi, ArazhghelichIgderi and Amir Parastar, “Sitting and Sizing of Distributed Generation in Distribution Network to Improve of Several Parameters by PSO algorithm,” IEEE 2010.
[12] M.Padma Lalitha, V.C. Veera Reddy, V.Usha, “Optimal DG Placement for Minimum Real Power Losses in Radial Distribution System Using PSO,” Journal of Theoretical and Applied Information Technology ©2005-2010 JATIT.
[13] R.K. Singh and S.K. Goswami, “Optimum Allocation of Distributed Generation based on Nodal Pricing for Profit, Loss Reduction, and Voltage Improvement including Voltage Rise Issue,” Electrical Power and Energy System 32 (2012) 637-644.
[14] Mohammad ShahabArkan and HamedSalehi, “Application of Particle Swarm Optimization for Optimal Distributed Generation Allocation to Voltage Profile Improvement and Line Losses Reduction in Distribution Network,” Research Journal of Applied Sciences, Engineering and Technology, 5(20):4791-4795, 2013.
[15] M.H. Moradi and M. Abedini, “A Combination of Genetic Algorithm and Particle Swarm Optimization for Optimal DG location and Sizing in Distribution System,” Electrical Power and Energy System 34 (2012) 66-74.
[16] PengfeiGuo, Xuezhi Wang and Yingshi Han, “The Enhanced Genetic Algorithms for the Optimization Design,” 3rd International Conference on Biomedical Engineering and Informatics (BMEI 2010).
[17] Gabor Renner and AnikoEkart, “Genetic Algorithms in Computer Aided Design,” Computer-Aided Design 35 (2003) 709-726. [18] MA Junjie, Wang Yulong and Liu Yang, “Size and Location of Distributed Generation in Distribution System Based on Immune
Algorithm,” System Engineering Procedia 4 (2012) 124-132.
[19] Nor Rul Hasma Abdullah, Nurul Hidayah Mohamad Abdul Aziz,Nur Fadzillah Harun,Hazrina Mohd Kamal, “Allocation And Sizing Of Distributed Generation Using EP, AIS, And PSO,” Proceedings Of Malaysian Technical Universities Conference On Engineering &Technology (MUCET) 3-4 December 2013, Kuantan, Pahang.
[20] Adnan Anwar and H.R. Pota, “ Optimum Allocation and Sizing of DG unit for Efficiency Enhancement of Distribution System,” 2012 International Power Engineering And Optimization Conference (PEOCO/2012), Melaka, Malaysia:6-7 June 2012.
![Fig 2: Flowchart of PSO algorithm [10]](https://thumb-ap.123doks.com/thumbv2/123dok/519505.59493/3.595.186.409.284.548/fig-flowchart-of-pso-algorithm.webp)