FLOOD DETECTION DESIGN USING TELEMETRY SYSTEM TO
PROTECT AGRICULTURAL AREAS FROM FLOOD
Abstract
In the rainy season Indonesia have some agricultural areas hit by floods every year, it causes huge losses for some citizens. We can used the designed tool of flood detection using telemetry system based wireless Xbee PRO, it’s a tool that can give a warning to citizens to close irigation channel when flood happens. The sensor we used are Ping ultrasonic sensors. The frequency emitted is 42.076 to 47.9542 KHz. While the maximum distance that can be detected is 3 meters. The wireless XBee PRO maximum distance for the outdoor area is 380 meters. The highest value for packet loss when we gave obstacle is 76.67% which is at a distance of 150 meters, while the lowest packet loss is 53.3% when the distance is 75 meters. If the water level rises above 2.5 meters then the sirene will be ringing, it is the signal telling that the situation is a danger. Every data detected will be displayed using the interface which is delphi in the form of graphs and stored in the database. Delphi interface will also sound an alarm when the water level exceeds 2.5 meters.
Keywords: Flood Detector, Telemetry Systems, Wireless Communication, Packet Loss, Xbee PRO
INTRODUCTION
Indonesia is a country with great natural potential according to the geographical and geological conditions. Floods do not only occur in big cities with densely populated. Even, it happens small towns whose inhabitants were also often flooded. However, It causes Indonesia to become the country prone to disasters. To reduce the impact of disasters, information and communication technology has a lot of potential. It will predict the disaster especially in the dissemination of disaster management, assistment in making decisions related to the disaster, warning of disaster spreading to the community, and the management of disaster victims when disaster itself already happened. [1]
The flood disaster commonly occurs almost every year. the disaster struck in rainy season in several cities in East Java. Flooding generally occurs because existing channel are not able to accommodate the overflow of water, on a relatively flat area and near the watershed.
Often, several regions in Indonesia flooded every year causing huge losses for residents affected by the floods and the government. The damage was widespread both structural and much infrastructure was damaged, the victims fell some may even dying as a result of the disaster. Areas that are usually affected by flooding during the rainy season although It is not as severe as that occurred in the capital. Still, flood danger are harmful and dangerous to humans.
Flooding does not care with time. It can be happenned suddenly and it impossible to predict when it will come. Therefore, it is necessary to design flood detector which can detect flooding remotely in real time, so that the signs of impending floods could we know as early as possible in order to reduce and minimize the losses that
occur. Beside, it can prevent the public from the dangers of flooding that can be dying.
The rapid development in technology provides many benefits including the fast delivery of information, so that any information can be monitored in real time or at a moment's notice. It has been done to obtain an accurate information. Wireless is one of the communication techniques to convey information using radio waves and to replace cables that connect computers to the network. The computer can communicate with the network more effectively and efficiently in an adequate speed. The another benefit is a very supportive utilization of wireless as a medium that is used to access information in real time.
Previously, The research was conducted by Suprato (2010) on River Water Front Telemetry System using GSM Modem Based AVR Microcontroller ATmega 32 to get signs of flooding as early as possible accurately. However, there was still some shortcomings ie. data transmission was done using sms so that data can not be known in real time, using a sensor that is susceptible to damage when exposed to water, and many other shortcomings. Therefore, the Design Tool Flood Detection Using Wireless Telemetry System Based XBee PRO will enhance the previous research.
LITERATURE REVIEW
Such a device installed at the location near the river in the Pace Village, Silo Subdistrict in Jember.[2]
Telemetry is the process of measuring the parameters of an object (object, space, natural conditions) that results measurement send it to another place through the process of sending data using either wired or wirelessly. Telemetry word derived from the Greek tele means remote while metron meaning measure. By the term telemetry is defined as a field of engineering that utilizes an instrument for measuring heat, radiation, altitude, speed or other property and transmit measurement data to a receiver that is located far away physically, are outside of the reach of the observer or user. The media delivery system with telemetry using a cable or wirelessly (wireless), then the data can be used directly or need to be analyzed. In general, the telemetry system consists of six parts, namely supporting the object measuring sensor, transmitter, transmission channel, receiver and display. [3]
Wireless communications (wireless) as the medium of communication on the computer network has been very popular and has been common at this time. Thus the data exchange process will be easier and less complicated. In the mean time, wireless communication will be used for communication between the microcontroller as well. Therefore, this led to the data communication between the microcontroller becomes easier.
Wireless technology, it is enabling one or more devices to communicate without a physical connection, ie without the need for network or cable equipment. Wireless technology uses radio frequency transmission as a means to transmit data, while the cable using cable technology. Wireless technology range from complex systems such as Wireless Local Area Network (WLAN) and cellular phones to simple equipment such as wireless headphones, wireless microphones and other equipment that does not process or store information. Wireless Local Area Network (WLAN) is a relationship between one computer to computer and / or other peripherals by using fewer wires. The computer network using radio waves as a medium for data transmission. Information (data) is transferred from one computer to another using radio waves. WLAN is often referred to as a Wireless Network or Wireless Network as seen in figure 1. Here also includes equipment such as infra-red remote control, wireless computer keyboard and mouse, and a hi-fi stereo headsets wirelessly, all of which require a direct line of sight between the transmitter and receiver to make the connection. (JannerSimamarta, 2014). [4]
Gambar 1.Wireless Xbee PRO
Packet Loss is a parameter that describes a condition that indicates the total number of packets lost, may occur due to collisions and congestion on the network and it affects all applications because retransmissions will reduce overall network efficiency despite ample amount of bandwidth available to applications the. Generally, network devices have a buffer to hold the data received. If congestion occurs long enough, the buffer will be full, and the new data will not be accepted.
Packet loss calculation is done by comparing the data sent by the computer in less data received ole computer, and then calculated the percentage of missing data can be calculated by the formula [5] :
Packet loss % = ×100% (1)
Figure 2. Sensor of Paralaax Ping
Then the microcontroller measure the pulse width and converted in the form of distance was calculated as follows:
Distance=(PulseWidth/29.034us)/2(cm) (2)
or
Jarak = (PulseWidth x 0.034442) /2 (cm) Because of 1/29.034 = 0.344
Error Level of the difference between the actual sensor readings to readings can be determined by the formula:
Error % = ×100% (3)
Dimana : HT = Teory Value (actual value) HP = Practical Value (measured value)
METHODOLOGY
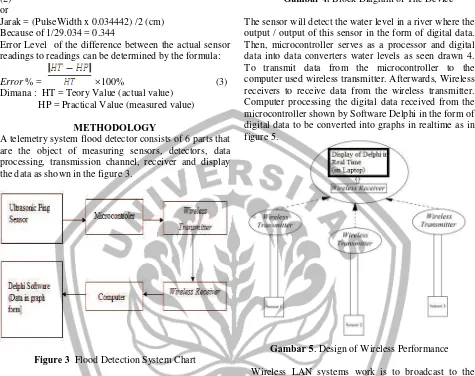
A telemetry system flood detector consists of 6 parts that are the object of measuring sensors, detectors, data processing, transmission channel, receiver and display the data as shown in the figure 3.
Figure 3 Flood Detection System Chart
The object is measured using a water level sensor ping as a detector. Microcontroller serves as a processor and digital data into data converters water level. Wireless transmitter used to transmit data from the microcontroller to the computer. Wireless receiver is used to receive data from the wireless transmitter. Computer serves to process digital data received from the microcontroller. Delphi Software as a viewer of digital data to be converted into graphics in realtime.
Gambar 4. Block Diagram of The Device The sensor will detect the water level in a river where the output / output of this sensor in the form of digital data. Then, microcontroller serves as a processor and digital data into data converters water levels as seen drawn 4. To transmit data from the microcontroller to the computer used wireless transmitter. Afterwards, Wireless receivers to receive data from the wireless transmitter. Computer processing the digital data received from the microcontroller shown by Software Delphi in the form of digital data to be converted into graphs in realtime as in figure 5.
Gambar 5. Design of Wireless Performance Wireless LAN systems work is to broadcast to the wireless receiver sender. After the broadcast is received wireless sender, for example wireless receiver send a broadcast code 1, then the data transmission is wireless sender 1. Furthermore, if the wireless receiver 2 then the character broadcast data transmission is wireless sender 2, and then as it was so. It shows the topology used is topology (star), centralized control, all clients must pass through the center channel data to all nodes or client chooses. Central node called the primary station / server, while the other is called the secondary station / client server.
RESULT AND DISCUSSION
In this discussion, described the results of research and testing in accordance with the parameters - parameters that have been determined. Starting with the frequency of testing sensors, sensor testing, wireless testing, testing of data transmission, packet loss testing, as well as software testing software Delphi. The test results of frequency of the sensor can be seen in the Table 1.
No. distance (meter)
Hasil Pengujian Frequency Counter (KHz)
1 2,52 42,076
2 2,54 42,4902
3 2,57 42,847
4 2,75 45,8494
5 2,79 46,5451
6 2,84 47,4956
7 2,87 47,9542
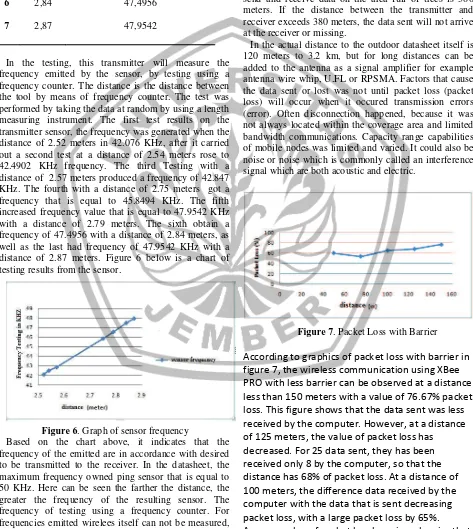
In the testing, this transmitter will measure the frequency emitted by the sensor, by testing using a frequency counter. The distance is the distance between the tool by means of frequency counter. The test was performed by taking the data at random by using a length measuring instrument. The first test results on the transmitter sensor, the frequency was generated when the distance of 2.52 meters in 42.076 KHz, after it carried out a second test at a distance of 2.54 meters rose to 42.4902 KHz frequency. The third Testing with a distance of 2.57 meters produced a frequency of 42.847 KHz. The fourth with a distance of 2.75 meters got a frequency that is equal to 45.8494 KHz. The fifth increased frequency value that is equal to 47.9542 KHz with a distance of 2.79 meters. The sixth obtain a frequency of 47.4956 with a distance of 2.84 meters, as well as the last had frequency of 47.9542 KHz with a distance of 2.87 meters. Figure 6 below is a chart of testing results from the sensor.
Figure 6. Graph of sensor frequency
Based on the chart above, it indicates that the frequency of the emitted are in accordance with desired to be transmitted to the receiver. In the datasheet, the maximum frequency owned ping sensor that is equal to 50 KHz. Here can be seen the farther the distance, the greater the frequency of the resulting sensor. The frequency of testing using a frequency counter. For frequencies emitted wirelees itself can not be measured, because according to the datasheet of the XBee PRO
itself, namely the frequency of 2.4 GHz, while the counter has a maximum frequency of 1.3 GHz.
The test results on the wireless outdoor conditions and measured on an area that has a lot of trees where the receiver is placed 30 cm above the ground. Tests carried out without the use of additional antennas and wireless transmitter position is not higher than 2.5 meters. Here wireless testing performed by a margin of 10 meters, the results of the data shows when the distance 210-380 meters, the experiments performed successfully. This indicates that wireless communication occurs very well. XBee PRO maximum distance that used to be able to send and receive data on the area full of trees is 380 meters. If the distance between the transmitter and receiver exceeds 380 meters, the data sent will not arrive at the receiver or missing.
In the actual distance to the outdoor datasheet itself is 120 meters to 3.2 km, but for long distances can be added to the antenna as a signal amplifier for example antenna wire whip, U.FL or RPSMA. Factors that cause the data sent or lost was not until packet loss (packet loss) will occur when it occured transmission errors (error). Often disconnection happened, because it was not always located within the coverage area and limited bandwidth communications. Capacity range capabilities of mobile nodes was limited and varied. It could also be noise or noise which is commonly called an interference signal which are both acoustic and electric.
is equal to 64.4%, it indicates that the value of
packet loss can be categorized as very bad because
it has exceeded 25%. This indicates that wireless
communication using XBee PRO with the barrier is
not optimal for a distance of 150 meters or more.
So, the farther the distance to the computer, then
the value of packet loss will be even greater.
In the measurement of packet loss, there were several factors that influence it, among others, there was a wall, a barrier of trees, noise, or noise, limited bandwidth and distance. The larger the bandwidth, the more long-distance transmission. The amount of traffic that flows in the network exceeded the capacity of existing bandwidth, so that policing traffic control would discard the existing excess.
CONCLUSION
After planning and manufacturing system then testing and analysis, from the results of several conclusions can be drawn as follows:
1. The frequency generated by the Ping sensor is equal
to 47.9542 KHz 42.076 KHz.
2. The Maximum distance of XBee PRO to be able to
work in an area full of trees (Outdoor) is 380 meters. 3. The average value of packet loss to be a barrier that is equal to 64.4%, with the highest value of packet loss is 76.67% which is at a distance of 150 meters, while the lowest packet loss is 53.3% at a distance of 75 meters.
ACKNOWLEDGEMENT
The author would like to thank the Higher Education as funders and all those who have helped in the completion of this study.
REFERENCES
[1]. Frans, Richard. 2009. Aplikasi Penentuan Status
Gunung Berapi menggunakan Telemtri Suhu.
Yogyakarta : UPN “Veteran” Yogyakarta.
[2]. Djefri, Himawanda. 2014. Rancang Bangun Alat Pendeteksi Banjir Menggunakan Sistem Komunikasi Wireless. Jember : Universita Jember.
[3]. Heri, Susanto. 2013. Perancangan Sistem Telemetri Wireless Untuk Mengukur Suhu Dan Kelembaban Berbasis Arduino Uno R3 Atmega328p Dan XBee PRO. Tanjung Pinang : Universitas Maritim Raja Ali Haji
[4]. Janner, Simamarta. 2014. Keamanan Jaringan
Wireless. (Materi Kuliah. Com Diakses 1 Maret 2014)