TRADE INTEGRATION AND BUSINESS CYCLE
SYNCHRONISATION BETWEEN INDONESIA AND ASEAN+6
RIZKI PRAMITASARI
POSTGRADUATE SCHOOL
BOGOR AGRICULTURAL UNIVERSITY
BOGOR
STATEMENT OF ORIGINALITY
I, Rizki Pramitasari, hereby declare that the master thesis entitled “Trade Integration and Business Cycle Synchronisation between Indonesia and ASEAN+6” is my original work under the supervision of Advisory Committee and has not been submitted in any form and another higher education institution. This thesis is submitted independently without having used any other sources or means states therein. Any source of information originated from published and unpublished work already stated in the part of references of this thesis. Herewith I passed the thesis copyright to Bogor Agricultural University.
Bogor, August 2016
Rizki Pramitasari
iv
RINGKASAN
RIZKI PRAMITASARI, Integrasi Perdagangan dan Sinkronisasi Siklus Bisnis antara Indonesia dan ASEAN+6. Dibimbing oleh IMAN SUGEMA dan FLORIAN PLOECKL.
Dalam beberapa tahun terakhir, sinkronisasi siklus bisnis telah menimbulkan kekhawatiran di antara para pembuat kebijakan global. Penelitian ini sangat penting dalam memutuskan apakah kerjasama regional menciptakan serikat mata uang atau tidak. Manfaat dalam membuat area mata uang optimum akan maksimal ketika siklus bisnis dari negara-negara anggota kelompok memiliki kemiripan karakteristik. Hal ini diyakini bahwa faktor utama yang mempengaruhi harmonisasi siklus bisnis adalah integrasi perdagangan. Saluran ini secara langsung dapat mempengaruhi siklus ekonomi melalui perdagangan intra industri dan intensitas perdagangan.
Sebagai negara berkembang, Indonesia memiliki tujuan untuk memperluas kerjasama dengan beberapa mitra dagang, yaitu ASEAN+6. Teori menunjukkan dua kesimpulan yang berbeda tentang pengaruh integrasi perdagangan pada sinkronisasi siklus ekonomi. Peningkatan perdagangan dengan negara-negara lain dapat menyebabkan siklus bisnis mereka bergerak di divergen atau konvergen. Hal ini tergantung pada dominasi perdagangan antar-industri dan perdagangan intra industri karena integrasi perdagangan dapat dihitung dari perdagangan intra industri ataupun intensitas perdagangan. Perdagangan antar-industri mengarah untuk mengurangi korelasi siklus ekonomi antara mitra dagang.
Integrasi perdagangan dapat diestimasi dengan perhitungan perdagangan intra industri dan indeks intensitas perdagangan. Perdagangan intra industri diukur dengan indeks Grubel-Lloyd (indeks GL), berdasarkan SITC (Standard International Trade Classification) yang dibuat oleh Perserikatan Bangsa-Bangsa (PBB) dan digunakan untuk mengklasifikasikan ekspor dan impor suatu negara yang dapat dibandingkan di tahun yang berbeda. Sedangkan, intensitas perdagangan adalah seberapa intens negara dalam menjalin perdagangan bilateral. Pendekatan ini dapat diukur menggunakan data ekspor bilateral, data impor bilateral dan gabungan keduanya.
Beberapa studi menunjukkan bahwa implikasi dari peningkatan perdagangan dengan beberapa negara lainnya akan menyebabkan kenaikan pertumbuhan pendapatan yang membawa sinkronisasi dalam siklus bisnis antar negara tersebut. Siklus bisnis atau juga dikenal sebagai siklus ekonomi diyakini akan bergerak sepanjang waktu sebagai dampak dari globalisasi. Pengaruh dari mitra dagang negara lain telah menjadi faktor penting untuk menentukan fluktuasi siklus bisnis karena hubungan perdagangan yang lebih intensif antara negara akan mempercepat ekspor dan impor. Akibatnya, siklus bisnis berfluktuasi dan ini terjadi karena peningkatan pendapatan negara. Hal ini berdampak pada permintaan barang dari luar negeri yang juga meningkat.
yang diharapkan memiliki dampak positif yang besar dan meningkatkan pertumbuhan ekonomi.
Oleh karena itu, penelitian ini bertujuan untuk menyelidiki adanya hubungan antara integrasi perdagangan dan siklus bisnis antara Indonesia dan ASEAN+6 selama periode 1990-2013 dengan menggunakan model panel fixed effect. Hasil penelitian menunjukkan bahwa integrasi perdagangan Indonesia dan ASEAN+6 masih lemah. Perdagangan intra industri menyebabkan dampak negatif dari sinkronisasi siklus bisnis antara Indonesia dan ASEAN+6.
Selain itu, penelitian ini menemukan bukti pengaruh yang tidak signifikan dari intensitas perdagangan antara Indonesia dan ASEAN+6 dengan sinkronisasi siklus bisnis. Hasil ini, dengan demikian, menunjukkan bahwa peningkatan daya saing intra industri yang lebih efektif dan efisien, sangat diperlukan untuk memberikan dampak positif dari sinkronisasi siklus bisnis antara Indonesia dan ASEAN+6. Akhirnya, pertimbangan ini bisa menciptakan konvergensi siklus ekonomi antara negara-negara anggota Indonesia dan ASEAN+6.
vi
SUMMARY
RIZKI PRAMITASARI, Trade Integration and Business Cycle Synchronisation between Indonesia and ASEAN+6, Under supervision of IMAN SUGEMA and FLORIAN PLOECKL.
In recent years, business cycle synchronization has gained interest and caused concern amongst policy makers globally. This study is essential in deciding whether regional partnership creates a currency union or not. Benefit in making optimum currency area outweighs when the business cycle of the member countries of a group is more similar. It is believed that the main factor affecting harmonisation of business cycle is trade integration. This channel could directly influence economic cycle through intra industry trade and trade intensity.
As an emerging country, Indonesia has a purpose to expand cooperation to some trading partners, namely ASEAN+6. Theorists have prompt to draw the two different conclusions about the effect of trade integration on synchronization of economic cycle. An increasing trade with other countries could cause the business cycle they move in divergent or convergent. It depends on the dominance of inter-industry and intra inter-industry. Inter-inter-industry trade leads to reduce the correlation of economic cycles between trading partners. For example if the trade occurs as the theory of Heckser-Ohlin or Ricardo, the greater industry specialization result in less synchronised of the business cycle because trade integration can be proxied from intra industry trade and trade intensity. However, when intra-industry trade is more dominated, the correlation of business cycles is more synchronize in the region.
Trade integration can be estimated by Intra industry trade (IIT) and trade intensity index (TII). IIT is measured by Grubel-Lloyd index (GL index), determining specific industry, owned by a country in a given year. This specific industry is based on SITC (Standard International Trade Classification) is a classification of goods created by the United Nations (UN) and used to classify exports and imports of a country which can be compared in a different year. Whereas, trade intensity is how intense of countries in generating bilateral trade. This approach can be measured using bilateral export data, bilateral import data and the last is that mix of them.
Some studies suggest that an important implication of the rapid increase in trade with some other countries is on an architecture of integrated trade, then the latter, will lead to the rise in growth of revenue which bring synchronization in business cycle. The business cycle or also known as the economic cycle is believed to be moving all the time as the impact of globalization. The influence from important country trading partners has become an essential factor to determine business cycle fluctuations. The more intensive trade relation between countries will accelerate the export and import. Consequently, the business cycle fluctuates and this occurs owing to the increase of income of country. As a result, demand of goods from abroad also increases.
Currently, this cooperation is larger and the member is added into ASEAN+6 which is expected to have big positive impacts and boost the economic growth.
Therefore, this study aims to investigate the existence of relationships between trade integration and business cycle co-movement between Indonesia and ASEAN+6 over the period 1990 to 2013 using a panel fixed effect model. The results indicate that trade integration of Indonesia and ASEAN+6 is still weak. Intra industry trade leads to negative impact of business cycle coherence between Indonesia and ASEAN+6. Also, this study finds insignificant impact of the trade intensity index between Indonesia and ASEAN+6 nations to business cycle coherence.
Since there was a contrary effect in this study, it is important to change the trade pattern to alter the impact on business cycles from negative to positive. Otherwise, increase in trade integration between Indonesia and ASEAN+6 will lead to negative impacts on business cycle harmonisation among these nations. Finally, these considerations could create convergence of economic cycle between Indonesia and ASEAN+6 member countries.
viii
@Copyright belongs to IPB, 2016
All rights Reserved Law
Prohibited quoting part or all of this paper without including or mentioning the source. The quotation is only for educational purposes, research, scientific writing, preparation of reports, writing criticism, or review an issue; and citation are not detrimental to the interest of IPB.
TRADE INTEGRATION AND BUSINESS CYCLE
SYNCHRONISATION BETWEEN INDONESIA AND ASEAN+6
RIZKI PRAMITASARI
Master Thesis
As a requirement to obtain a degree Master of Science in
Economics Program
POSTGRADUATE SCHOOL
BOGOR AGRICULTURAL UNIVERSITY
BOGOR
x
Thesis Title : Trade Integration and Business Cycle Synchronisation between Indonesia and ASEAN+6
Name : Rizki Pramitasari
NIM : H151137154
Approved
Advisory Committee
Agreed
Coordinator of Major Economics
Dr. Lukitawati Anggraeni, SP, M.Si
Dean of Postgraduate School
Dr. Ir. Dahrul Syah, M.Sc, Agr
ACKNOWLEDGEMENT
"Say, "Indeed, my prayer, my rites of sacrifice, my living and my dying are for Allah , Lord of the worlds." [6:162], hereby I would like to express my greatest gratitude to God Almighty for His blessing which bring me to accomplish this mini dissertation. I would also like to extend my gratitude towards my supervisor, Dr. Ir. Iman Sugema, M.Sc and Dr. Florian Ploeckl, for their excellent support, guidance and brilliant contribution for this dissertation.
Additionally, I would express my warm thanks to Australia Awards Scholarship, Ministry of Trade, Bogor Agricultural University and the University of Adelaide for providing sponsorship to undertake my study.
I am thankful to my parents, my nuclear family, my mother in law and my beloved husband, Ami Suhelmi for support me spiritually and cheer me up when I gave up in writing my thesis.
Also, I thank my relatives, my peers, my big Indonesian family in Adelaide and anybody who has supported and encouraged me throughout my study.
Last but not least, I also wish to thank my fellow colleagues, Aksa Nugraha and Amelia Sitohang.
Bogor, August 2016
vi
Business Cycle Synchronisation 8
Measuring Trade Integration and Determinants of Business Cycle 11
Link Between Trade Integration and Business Cycle 12
Research Hypothesis 16
Setup Model Specification 20
Estimation and Methodology 21
Fixed Effects 21
Random Effect 22
Hausman Test 22
Wooldridge Test 23
4 RESULTS AND DISCUSSIONS 24
Intra Industry Trade between Indonesia and ASEAN+6 24
Trade Intensity Index between Indonesia and ASEAN+6 25
Panel Regression Model Test 27
Policy Implications for Indonesia 29
5 CONCLUSION 31
REFERENCES 33
LIST OF FIGURES
1 Intra-Regional Trade of ASEAN, ASEAN+3 and ASEAN+6 2
2 Intra-Industry Trade between Indonesia and ASEAN+6 5
3 Forms of Economic Integration (Griffin &Pustay 2010) 7
4 The Business Cycle Phases (Schmidt 2004) 8
5 Business Cycle Synchronisation Channel (Mizstal 2013) 9
6 Intra Industry Trade between Indonesia and ASEAN+6 24
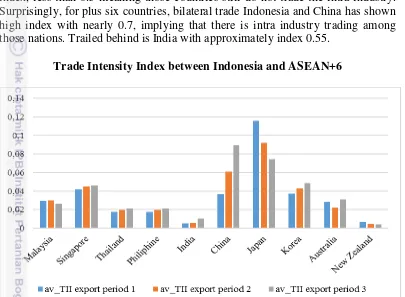
7 Trade Intensity Index between Indonesia and ASEAN+6 (export) 25
8 Trade Intensity Index between Indonesia and ASEAN+6 (import) 26
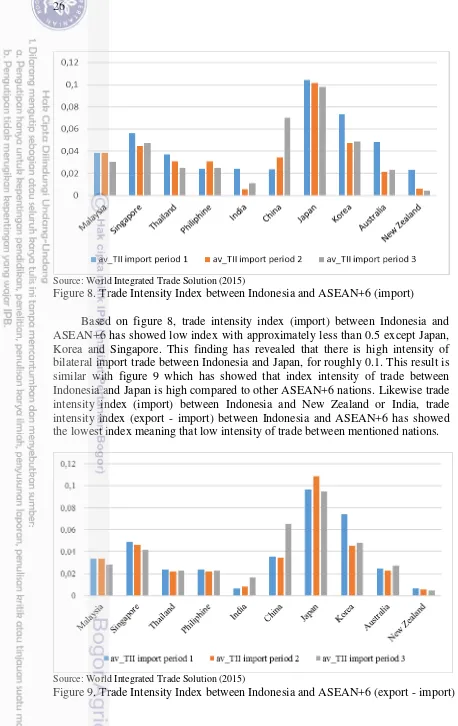
9 Trade Intensity Index between Indonesia and ASEAN+6 (export - import) 26
LIST OF TABLES
1 Data Types 18
LIST OF APPENDIXS
1 Result of Wooldridge Test 36
2 Result of Hausman Test 36
3 Panel Fixed Effect Regression Results 37
4 Panel Fixed Effect with Time Dummies Regression Results 38
8
1 INTRODUCTION
Background
For over half a century, expansion of international trade activity has made a
substantial contribution to Indonesia’s economic growth. The influence from important trading partners such as ASEAN+6 has become an essential factor for
Indonesia’s pattern of growth, and could lead to stronger economic integration. Trade integration leads to wider market access and more effective trade and, ultimately, has a positive impact on macroeconomic variables, resulting in economic growth.
According to Misztal (2013), increased trade with other countries can cause their business cycles to diverge or converge. Business cycle implies the long-term cyclical part of output growth, which moves constantly because of globalisation (Haan et al. 2008). Studies on business cycles or economic cycles have been taken into account in an increasingly integrated global economy. As a consequence, one internal or external variable shock will lead to worldwide economic fluctuations. In the long term, the degree of this dynamic co-movement will form an economic cycle known as the business cycle (Jansen and Stockman 2014).
There are several channels through which the harmonisation of business cycles between two or more countries can be increased. One of these is through trade integration. Many researchers believe that there is a strong correlation between trade integration and the business cycle. When integrated nations have highly dominating intra-industry trade, a cross-country spill over effect may reduce the potential for asymmetric shock and create business cycles that are more synchronised. However, if inter-industry trade dominates the trade pattern, less harmonisation of the cycles would be expected.
Source: World Development Indicator, 2014
9
In today’s globalised world, regional integration partnerships have tremendous benefits, accelerating large markets and trade scale cooperation, and developing vital aspects for economic growth, especially in trade in services and merchandise and investment (Sen et al. 2013). EEU is the first role model which successfully improve its members output. This regional partnership has inspired other regions to embrace established integration partnership.
Problem Formulation
Indonesia is one of the largest countries in ASEAN and internationally is considered to have high economic potential. This country has a strong commitment to enhancing trade cooperation through a regional partnership. The aim of this new formation, which is called ASEAN+6, is to accelerate economic growth, through larger markets and scale of trade, and cooperation in energy, foods and other vital aspects of economic development. This regional trade network is considered the most suitable union for improving regional economic performance, especially in trade and investment (Sen et al. 2013). As shown in Figure.1, the share of intra-regional trade in ASEAN, ASEAN+3 and ASEAN+6 has shown a moderate rise in recent years, from about 16.97% in 1990 to around 24.01% in 2014 for ASEAN and from 33.04% in 1990 to 42.25% in 2014 for ASEAN+6. The intra-regional trade share increased throughout the two decades. In the future it is expected to rise and reach the integrated economic goal of
ASEAN+6. Because of Indonesia’s increased trade volume with ASEAN+6, it is
important to examine whether this has led to more integration in trade and
affected Indonesia’s business cycle coherence with ASEAN+6 member countries.
Research Objective
The aim of this study is to explore the impact of trade integration on the business cycle synchronisation between Indonesia and ASEAN+6.
Research Benefit
The results of this research will be beneficial to the Indonesian and ASEAN+6 partnership in deciding the next step in the integration, in particular, to policy makers and the government of the Republic of Indonesia in boosting the trade sector, and to societies in charge within the trade sector and practitioners who run businesses within the ASEAN+6 boundaries.
Scope of Research
10
Zealand. The variables were intra-industry trade, trade intensity index, demand spill over, and fiscal and monetary coordination policies from 1990 to 2013. Variables were analysed using panel data with econometrics software E-Views 8 and Stata 13 to investigate the influence of these variables on the business cycle synchronisation between Indonesia and ASEAN+6.
This study is structured in six sections, starting with the introduction. Section 2 provides the background of Indonesia and ASEAN+6 and an overview of trade integration, intra-industry trade and synchronisation of business cycles. Next, Section 3 reviews the theories on trade integration and business cycle synchronisation. Section 4then presents the main specifications and data used in the panel data, and Section 5 discusses the results of the analysis. Finally, Section 6 provides the final conclusions, including how the results can be used as policy options to cope with the existing issues.
2 LITERATURE REVIEW
To begin with, it is important to outline Indonesia and ASEAN+6, trade integration and business cycles, to increase understanding when assessing the effects of trade integration on business cycle synchronisation between Indonesia and ASEAN+6.
Indonesia and ASEAN+6
Indonesia is ranked as the ninth largest economy in the world (World Bank
2015). By the end of 2014, Indonesia’s gross domestic product (GDP) had reached US$ 2.55 trillion. This position surpassed the GDP of the United Kingdom, which was only US$ 2.4 trillion in 2014. Along with this improvement, Indonesia strongly supports the establishment of economic integration among the countries of Southeast Asia. ASEAN economic integration is a form of economic cooperation among countries in Southeast Asia that was created by establishing the ASEAN Free Trade Area. Currently, this cooperation has been expanded by members being added to form ASEAN+6, which is expected to have a positive impact and boost economic growth (Hamanaka 2014).
11
Source: World Integrated Trade Solution, 2015
Figure 2. Intra-Industry Trade between Indonesia and ASEAN+6
Trade Integration
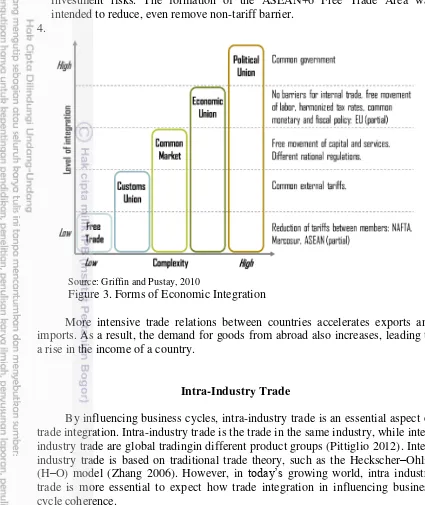
Moneta (2006) stated that economic integration has the same principles and mechanisms as free trade, which refers to the elimination of national trade boundaries. There are five different stages of economic integration, as documented in Figure 3. Marrewijk (2007) asserted that the highest degree of economic integration is political union, followed by economic union, common market, custom union and free trade area. A deeper integration scheme such as the European Union (EU) could be classified as a common market (Schwarze, 2006), whereas a shallow integration, for instance, ASEAN+6, is integrated as a free trade area, which can change in structure to become intense trade ties and closer economic links. Factors in forming regional trade integration are:
1. Establishing security and policies to ensure trade diplomacy for neighbouring countries. For example, the formation of the European Economic Community was conducted through a trade cooperation policy in the region (Pentecote et al. 2015; Rose and Stanley 2005). Trailing far behind is ASEAN+6 in a free trade zone, established to reform mixed policies with a comprehensive pact involving trade facilitation.
2. Managing the global value chain and trade friction. A feature of the ASEAN+6 trade scheme is its intra-regional production network approach. Indonesia, the largest country among the ASEAN countries, has increased the efficiency and effectiveness of trade production. China, Japan and Korea are among the strongest economic powers in East Asia and are considered to be strengthening the ASEAN+6 partnership. Similarly, India plays a prominent role in enhancing this integration because it accounts for a large trade share within the ASEAN countries. The remaining countries, Australia and New Zealand, have liberalised their trade with ASEAN and its neighbours.
12
productivity and competitiveness as well as reducing costs and trade and investment risks. The formation of the ASEAN+6 Free Trade Area was intended to reduce, even remove non-tariff barrier.
4.
Source: Griffin and Pustay, 2010
Figure 3. Forms of Economic Integration
More intensive trade relations between countries accelerates exports and imports. As a result, the demand for goods from abroad also increases, leading to a rise in the income of a country.
Intra-Industry Trade
By influencing business cycles, intra-industry trade is an essential aspect of trade integration. Intra-industry trade is the trade in the same industry, while inter-industry trade are global tradingin different product groups (Pittiglio 2012). Inter-industry trade is based on traditional trade theory, such as the Heckscher–Ohlin (H–O) model (Zhang 2006). However, in today’s growing world, intra industry trade is more essential to expect how trade integration in influencing business cycle coherence.
13
access to a more diverse choice of products and lower prices as a result of productivity improvement through economies of scale.
Business Cycle Synchronisation
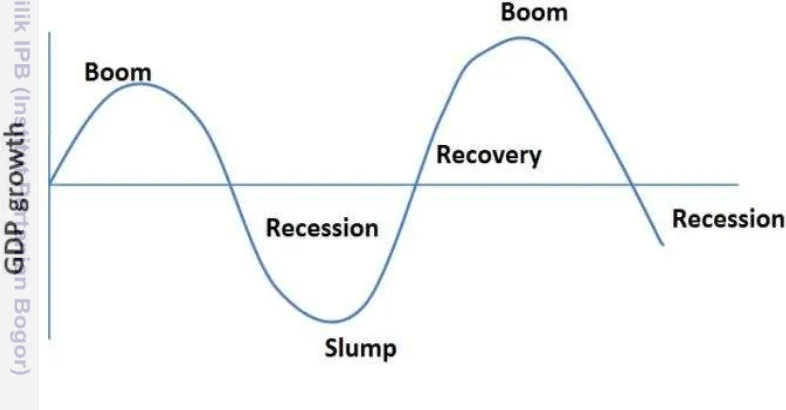
Studies about business cycles or economic cycles have been taken into account amongst researchers in an increasingly integrated global economy. Business cycle implies the long-term cyclical part of output growth (Haan et al. 2008), where the real GDP of each country is used as the indicator. This measurement relates to a global economy. As a consequence, one internal or external variable shock will lead to worldwide economic fluctuations. In the long term, this dynamic co-movement will form an economic cycle known as the business cycle (Jansen and Stockman 2014). The business cycle can also be defined as the deviation of output against expansion and contraction trends (Botha 2004; Misztal 2013).
Source: Schmidt, 2004
Figure 4. The Business Cycle Phases
As shown in Figure 4, the red line is the trend of potential GDP, calculated from the blue line, which is the actual real GDP. Each cycle has two types of turning points, the peak and the trough (Camacho et al. 2008). The peak point shows the positive output gap, and the negative output gap is shown from the trough or depression. Both turning points indicate the direction of the cyclical movement, which becomes an indicator of change in contraction or expansion from period to period. Schmidt (2004) stated that there are four stages in an economic cycle, namely, the depression stage, the expansion phase, the phase of contraction and the recovery phase. The first stage is the depression period, that is, a period of rapid decline in aggregate demand, followed by a low level of output and high unemployment rates, which gradually reaches the lowest point.
14
production rise, leading to a rise in inflation and interest rates. Business expansion thereby reaches a peak followed by a phase of contraction, when production factors such as sales, prices and employment begin to decline. The last phase is the phase of recovery, when economic activity advances to a new period of expansion and a rise in the business cycle. Recovery is a transitional phase beginning from the lowest economic point and then returning to the original starting point. In general, the strongest growth occurs in the recovery phase, but the duration is shorter than a recession (Botha 2004).
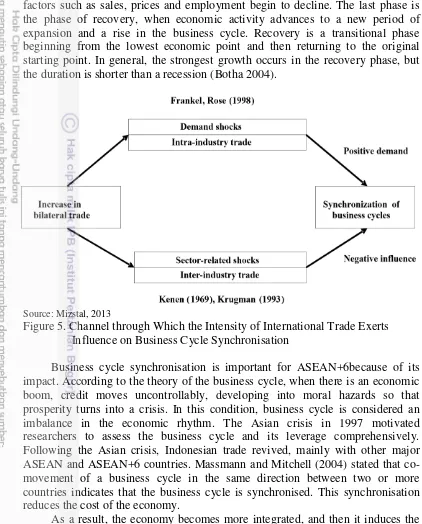
Source: Mizstal, 2013
Figure 5. Channel through Which the Intensity of International Trade Exerts Influence on Business Cycle Synchronisation
Business cycle synchronisation is important for ASEAN+6because of its impact. According to the theory of the business cycle, when there is an economic boom, credit moves uncontrollably, developing into moral hazards so that prosperity turns into a crisis. In this condition, business cycle is considered an imbalance in the economic rhythm. The Asian crisis in 1997 motivated researchers to assess the business cycle and its leverage comprehensively. Following the Asian crisis, Indonesian trade revived, mainly with other major ASEAN and ASEAN+6 countries. Massmann and Mitchell (2004) stated that co-movement of a business cycle in the same direction between two or more countries indicates that the business cycle is synchronised. This synchronisation reduces the cost of the economy.
As a result, the economy becomes more integrated, and then it induces the fluctuation of business cycle. The theory of traditional trade predicts that trade openness can lead to specialisation in production (Song 2011). Therefore, integrated economy will result in a decline in the correlation of business cycles. However, if trade is dominated by intra-industry trade, the business cycle will become more symmetric (Dees and Zorell 2012).
15
same effect on economic sector in different countries. Differences between
countries’ business cycles can occur for many reasons. Despite experiencing the same shocks, each country may have a different effect or response, such as in the reaction to national output. As the economies of Indonesia and ASEAN+6 are forecasted to become more integrated, this investigation is needed to pursue outstanding growth among the members.
Measuring Trade Integration and Determinants of Business Cycle
The baseline model of trade integration is approached by using trade intensity and intra-industry trade (Misztal 2013). Trade intensity is the intensity of countries in generating bilateral trade. This approach can be measured using bilateral export data, bilateral import data or a mix of these. For bilateral exports, trade intensity can be calculated as the bilateral export divided by the total exports of both countries. Likewise, trade intensity for imports can be calculated as the bilateral import divided by the total imports of both countries. Similar calculations for export and import are done by dividing the bilateral export and import by the total exports and imports of both countries.
Another parameter to measure trade integration is the intra-industry trade index. It was observed by Reinert (2012) that approximately one-third of world trade takes place as intra-industry trade, especially in manufactured goods among the developed or high-income countries of the world, where it probably accounts for up to 70% of trade. Globally, intra-industry trade is also becoming more important over time, particularly in Asia. Intra-industry trade arises if a country simultaneously imports and exports similar types of goods or services (Shelburne 2002). To measure intra-industry trade, the most commonly used method is the GL index (Greenaway and Milner 1986), based on the standard international trade classification (SITC). The SITC is a classification of goods created by the United Nations (UN) used to classify the exports and imports of a country, which can be compared across different years.
16
Link Between Trade Integration and Business Cycle
The theories of trade integration and business cycles have led to an increase in the attention paid to these empirical questions. Krugman (1991), who follows the Heckscher–Ohlin trade theory, asserted that growing trade activity has led to higher specialisation of production. Krugman added that this trade pattern has resulted in different direction co-movement of business cycles. Hence, trade integration has a diverging effect on business cycles.
In contrast, a substantial number of empirical studies have documented a significant and clear positive relationship between trade integration and business cycle synchronisation. Research by Cortinhas (2007), who adopted the modified variation of the Frankel and Rose (1998) model, led to an empirical result that countered that of Krugman (1991). Corthinhas found that intra-industry trade is the main factor leading to more harmonised business cycles in the economies of ASEAN without Indonesia. He examined the effect of intra-industry trade on business cycle synchronisation in five ASEAN countries over the period 1962– 1996, using panel two-stage least squares (TSLS) estimations. The developed independent variables for intra-industry trade were the log of distance and a dummy for land borders. According to his empirical findings, although it is the largest economy, Indonesia appeared to be less integrated than other smaller member countries. Hence, Cortinhas ignored Indonesia in his alternative combinations, unless the trade would lead to reducing the correlation of business cycles.
Similarly, Shin and Wang (2003) emphasised that an increase in whole trade should be accompanied mainly by intra-industry trade; it can then induce more positively converged business cycles. The data used in their paper were the annual GDP from 12 Asian economies over two decades, from 1976 to 1997, and trade volume data. They set up four coefficients in the regression: bilateral trade
intensity, employing Frankel and Rose’s (1998) model; intra-industry trade intensity, adopting Grubel and Lloyd’s (1975) equation; and two policy coordination channels. These policy shocks were split into the degrees of coordination of fiscal and monetary policy. The fiscal coordination channel was investigated by calculating the budget deficit ratio to GDP, and the degree of monetary coordination was constructed by examining the correlation of the M2 growth rates. Consistent with recent investigations, in this empirically analysed paper, these authors concluded that a rise in intra-industry trade between Korea and other Asian countries has strengthened business cycle coherence.
17
by intra sector in East Asia. This finding relates to the authors’ previous work, in
2003, that found that intra-industry trade is the primary channel for fostering business cycle coherence between Korean and Asian countries.
Following this study by Shin and Wang (2005), Rana (2007) reviewed the importance of intra-industry trade and, to a lesser extent, monetary coordination in synchronising business cycles in East Asia. The methods used in this paper were value at risk (VAR) and pooling regression. Using the annual GDP data of 11 ASEAN+3 nations spanning a decade, between 1989 and 2003, and the H–P filter, the author found similar results to those of Shin and Wang (2005). He also used a different proxy by correlating short-term real interest rates to estimate financial channels.
For the sake of comparison, Park (2013) revealed that monetary aggregate was a key aspect in explaining business cycles in East Asia, notably in Korea, Malaysia and the Philippines. Data used in this study were quarterly real GDP data, real private consumption expenditure, real gross capital formation, real stock of M2, real government expenditure, productivity, oil price, and total export and import in eight nations of East Asia. Unlike previous literature on the bilateral trading nexus, this study modified the dynamic factor model of Crucini, Kose and Otrok (2011), which measures time-varying dynamic conditional relationships.
Departing from the existing study, Duval et al. (2014) proposed an integrated trade and business cycle nexus in Asia by using 34 advanced countries and 29 emerging economies over two decades. By retaining the dynamic factor model with a gravity and panel approach, these authors found that worldwide factors can explain business cycle evolution. Additionally, by examining trade intensity, trade specialisation and intra-industry trade as a proxy for trade integration, and banking and portfolio integration as a proxy for financial integration, they found that statistically examined trade integration has driven business cycles in Asia. Specifically, its impact in crisis periods outweighs that in tranquil times. This result was confirmed in a later empirical approach by Dai (2014). The method used in his paper was panel regression. Dai focused on how newly industrialising economies, ASEAN-4, and Asian business cycles have co-moved with the business cycles of China, Japan and the United States. He attempts that trade and financial linkage indicate the importance of Japan, China and the United States in Asian business cycles.
In line with this finding, Inklaar et al. (2008) stated that trade intensity, financial similarities and specialisation (intra-industry trade) have robust effects on business cycle coherence in certain Organisation for Economic Co-operation and Development (OECD) countries. These effects were not as great as those reported by Frankel and Rose (1998). Instead of using instrument variables, they constructed a multivariate model. This approach enabled them to highlight specialisations and degrees of economic policy similarities. The measures of economic activity used in this study were the monthly Index of Industrial Production and the quarterly GDP determined by the H–P filter.
Kumakura (2006) noted that the electronic industry as a specific manufacture positively enhances business cycle coherence. He followed Frankel
18
Hence, growing trade with no industry-specific shock influencing the business cycle does not necessarily transform an optimum currency area in Asia–Pacific nations.
According to Saiki and Kim (2014), business cycle co-movement affected by intra-industry trade and vertical intra-industry trade increased in both Europe and East Asia. However, increased intra-industry trade and vertical intra-industry trade in East Asia were faster than those in the Eurozone because of the role of the supply chain. The data used covered four decades, from 1970 to 2011. The pattern of the business cycle was explained by quarterly real GDP filtered using year over year growth, the Baxter–King filter and the H–P filter, and a detailed investigation of intra-industry trade and vertical intra-industry trade were calculated using the GL index. A separate empirical study by Rana, Cheng and Chia (2011) had a similar empirical finding. The fixed effect panel method was used to estimate trade and business cycles, whereas gravity equation was used to calculate the trade pattern of countries.
However, a number of empirical studies suggest that an important channel contributing to business cycle co-movement is trade integration. By estimating a simultaneous equation model based on the six variables panel approach within the 27 EU countries from 1995 to 2012, Antonakakis and Tondl (2014) verified that trade and foreign direct investment have fostered business cycle co-movement, whereas specialisation has an insignificant impact on business cycles. In addition, these writers found that poor fiscal coordination and exchange rate fluctuations have impeded economic cycle synchronisation in the EU. This leads to further policy implications.
In essence, business cycles have been playing a crucial role in the globalised economy. In this regard, intra-industry trade is the most obvious parameter for approaching trade integration. It is closely related with business cycle co-movement. In contrast, influences from other channels, namely, financial and policy channels, are not as strong as trade channels. A review of empirical literature about trade integration and business cycles from different countries indicates that the economic characteristics of member countries have an influence on the strength and nature of the impact of trade integration on business cycle harmonisation.
Research Hypothesis
Based on asymmetric information, an increase of trade will cause an increase of business cycles synchronisation between Indonesia and ASEAN+6.
3 DATA AND METHODOLOGY
19
Data
This investigation used secondary annual, cross-sectional annual time series data for 11 countries for the period 1990 to 2013. The data were obtained from International Financial Statistics and the International Monetary Fund (IFS-IMF), and World Integrated Trade Solution and the World Bank (WITS-World Bank). The data set analysed in this study includes real GDP, total nominal exports, total nominal imports, bilateral exports between countries, and bilateral imports between Indonesia and ASEAN+6 countries. ASEAN-5 (Indonesia, Philippines, Singapore, Malaysia and Thailand) were analysed; the other ASEAN countries were not included in this study because of their low level of bilateral trade with Indonesia, small economies and limitations of the source. In addition, the study included the other six partner countries, namely, Japan, China, India, South Korea, Australia and New Zealand. These countries were added to determine the degree of trade integration of the six countries, in line with the background of economic cooperation expansion of ASEAN into ASEAN+6.
Two models were constructed in this investigation. The first used three subsample periods of equal length, 1990–1997, 1998–2005 and 2006–2013, and the second model used three similar sub sample periods but excluded the year 1998/1999. These years are considered outliers, leading to potentially distorted results. Each model was divided into two sub models to compare the significance of the trade variables, that is, one model with policy variables and one model without policy variables.
Operational Definition
This study has obtained data from International Financial Statistics (IFS) and World Integrated Trade Solution (WITS)–World Bank. All data types used in this study and the definitions are mentioned in Table 1.
Table 1.Data Types
The difference between government spending (G) and government revenue from taxes (T) within a certain period
20
Dependent Variable
The dependent variable in this regression is the bilateral correlation of business cycles between Indonesia and other ASEAN+6 countries. Business cycle is measured using the H–P filter. HP filter is flexible and detrending method commonly used in economic research to remove the cyclical component of a time series from raw real GDP data. In HP filter, a series of data can be separated into two components, trend and cycle. It is used to obtain a smoothed-curve representation of a time series, which is more sensitive to long-term than to short-term fluctuations. Correlation of this output cycle can be calculated in each sub
values of country j’s import to Indonesia. The index ranges from zero to one. Zero point means no intra-industry trade, while one implies its maximum level of trade of intra industry. Intra-industry trade goes up when nations concurrently merchandise similar types of trading services or goods. The same sector classification is identified using the UN standard, namely, SITC.
Following Rose and Frankel (1998), three different proxies were used to test how the intensity of bilateral trade between Indonesia and other ASEAN+6 countries affects the business cycle. The first is export data, the second is import data and the last is a mix of these. This is also called the trade intensity index. The trade intensity index is counted on an actual bilateral trade nexus between any given two countries. The following equation uses the three options to measure TII (trade intensity index):
21
Additionally, to compare the significance levels of trade integration in influencing business cycles, two policy variables were added to this model. These variables are fiscal and monetary policies, included to differentiate how significant integration of trade is positively affecting economic cycles. Fiscal linkage was approached using demand spill over and budget deficit. The other policy variable, monetary policy, is the correlation of the M2 growth rates and real
GDP of the trading partner country. throughout 1990–2013. This research adapted the model developed above. Trade integration between Indonesia and ASEAN+6 was expected to improve the synchronisation of business cycles of these countries. Since trade integration consists of two proxies, namely, IIT (intra-industry trade) and TII (trade intensity index), adapted from the Shin and Wang model (2003), fiscal and monetary policy variables were used to represent the level of significance and accuracy in the previous model:
Corr (ind,j)t = α0 + α1 IIT (ind,j)t + α2 TII (ind,j)t + α3D_Spill(ind,j)t +
α4BD_fiscal(ind,j)t + α5mon(ind,j)t + εkt (5)
where Corr (ind,j)t is the business cycle nexus between Indonesia (nation ind) and
other ASEAN+6 countries (country j) in period t. IIT (ind,j)t is the intra-industry
trade between Indonesia (country ind) and other ASEAN+6 countries (country j) in
period t, and TII is the trade intensity index between Indonesia (country ind) and
other ASEAN+6 countries (country j) in period t. D_Spill(ind,j)t is the demand
spill over between Indonesia (country ind) and other ASEAN+6 countries (country j), which TII is multiplied with ratio of the real GDP of other ASEAN+6
countries. The remaining variables are fiscal and monetary variables.
BD_fiscal(ind,j)t is the correlation of the budget deficit and real GDP of the
trading partner country. The remaining variable, monetary variable, mon(ind,j)t, is the correlation of the M2 growth rates of Indonesia and real GDP of the its trading
22
Estimation and Methodology
Before regressing the model, a classical assumption test was performed to determine whether the data consisted of multicollinearity, heteroscedasticity or autocorrelation. This classical assumption test was necessary to obtain a linear unbiased estimator with minimum variance (best linear unbiased estimator = BLUE), meaning the regression model does not contain a problem.
After obtaining a fit model, regression could be carried out. There are two forms of panel regression, namely, balanced panel data and unbalanced panel data. If each unit cross-section has the same time series pattern, then the model is called a balanced panel. However, if there is a different number of observations of time series in each unit cross-section because of missing data within an individual unit, then it is called an unbalanced panel. These are often encountered in the economic field.
Three methods were used in this preliminary estimation technique, namely, pooled OLS, fixed effects and random effects. To select between these, an F-test and a Hausman test were used.
Fixed Effects
Fixed effect model is a model with a different intercept for each subject (cross-section), but the slope of each subject does not alter over time (Gujarati 2012). This model assumes that the intercept of each subject is different, while the slope of each subject remains the same. In this regression, the distinguished intercept between cross-section individuals in the regression model is due to its own characteristics. The basic model is:
Yit = i +βXit+ εit (6)
In distinguishing the fixed effect intercept a dummy variable can be used, as follows:
23
Random Effect
Random effect model is an alternative model to the fixed effects model. This method assumes that there is a random intercept, with the mean value constant. Hence, each individual intercept will be seen above the mean value constant of cross-section deviation from the initial modelling. This model estimates that the residual variable of the panel data is suspected of having a link with the independent variable over time. According to Gujarati (2012), random effect models are used to overcome the disadvantages of fixed effect models. An initial model written above is:
Wit is the time series and cross-section error combination; therefore, this model is also known as an error components model.
Hausman Test
24
Wooldridge Test
Autocorrelation arises due to correlated residuals (Gujarati 2012). It is caused by an individual error that tends to influence other variables in the next period. Autocorrelation problems often occur in panel data. Autocorrelation in panel data can be detected by using the Wooldridge test in Stata. The objective of the classical assumption test of the Wooldridge test for autocorrelation in panel data is to determine whether there is an underestimated result variable owing to correlation between an individual error and other variables. In determining and comparing the alpha of the critical value (p-value) at the level of 5% and prob > F using the Stata software, there was no autocorrelation. The results of the classical assumption test analysis of the autocorrelation test revealed that prob > F of all models was much higher than the 5% p-value, implying that none of the models contained autocorrelation. Therefore, the estimated panel models could be regressed using either fixed effect models or random effect models.
4 RESULTS AND DISCUSSIONS
To analyse the linkage of integrated commerce and business cycle harmonisation between Indonesia and ASEAN+6 from 1990 to 2013, this study conducted a detailed investigation following the outlined methodology, starting from the classical assumption test and panel regression test and opting for the best panel regression model test. The results of the empirical study are analysed in this chapter. Whereas, intra industry trade and trade intensity index result are shown below.
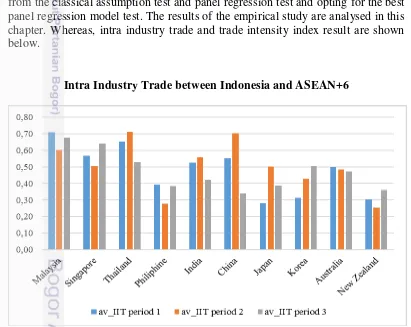
Intra Industry Trade between Indonesia and ASEAN+6
Source: World Integrated Trade Solution (2015)
25
As figure 6 shown, intra industry trade between Indonesia and ASEAN+6 varies each nations. The results reveal that overall, intra industry trade between Indonesia and core countries of ASEAN is higher than intra industry trade between Indonesia and plus six nations. This implies that Indonesia has long established trade relationship with main ASEAN member countries. However, bilateral intra industry trade between Indonesia and Philippine has showed low index, less than 0.5 meaning those countries still do not trade the intra industry. Surprisingly, for plus six countries, bilateral trade Indonesia and China has shown high index with nearly 0.7, implying that there is intra industry trading among those nations. Trailed behind is India with approximately index 0.55.
Trade Intensity Index between Indonesia and ASEAN+6
Source: World Integrated Trade Solution (2015)
Figure 7. Trade Intensity Index between Indonesia and ASEAN+6 (export)
26
Source: World Integrated Trade Solution (2015)
Figure 8. Trade Intensity Index between Indonesia and ASEAN+6 (import)
Based on figure 8, trade intensity index (import) between Indonesia and ASEAN+6 has showed low index with approximately less than 0.5 except Japan, Korea and Singapore. This finding has revealed that there is high intensity of bilateral import trade between Indonesia and Japan, for roughly 0.1. This result is similar with figure 9 which has showed that index intensity of trade between Indonesia and Japan is high compared to other ASEAN+6 nations. Likewise trade intensity index (import) between Indonesia and New Zealand or India, trade intensity index (export - import) between Indonesia and ASEAN+6 has showed the lowest index meaning that low intensity of trade between mentioned nations.
Source: World Integrated Trade Solution (2015)
27
Panel Regression Model Test
With regard to the panel regression model, three methods were utilised in this study. The models were fixed effect panel regression, fixed effect time dummies panel regression and random effect panel regression models. In terms of the fixed effect with time dummies regression, even though there were only a few sub periods, time dummies corrected the result models when there were shocks affected by independent variables. For the random effect models, there were inconsistent significant results. Based on the Hausman test, most of the models fit with the fixed effect models. As shown in the appendixs, panel regression models and fixed effect panel regression were the best fit models. Looking from the R square value in fixed effect panel regression, model without 97/98, with policy variable is the best model. These models have high R square value with a consistent value. By looking from result of Hausman Test, IIT export and IIT exim in model without 97/98, with policy variable fit with fixed effect panel regression, while IIT import fits with random effect panel regression model.
Variable intra-industry trade, which is the main variable in the model, reflects that when intra-industry trade between Indonesia and ASEAN+6 increased 1 point, business cycle declined −2.7 points. This result may appear surprising. It implies that an increase in intra-industry trade leads to less synchronisation of the business cycles of Indonesia and ASEAN+6.
In the result of fixed effect panel regression model for IIT export and IIT exim in model without 97/98, with policy variable, statistically showed a negative result, with a consistent result, −4.04 and −3.9. In line with that, TII variable in both export and exim in model without 97/98, with policy variable, statistically and consistently showed an insignificant result. Whereas, in the result of random effect panel regression model for II import in model without 97/98, with policy variable, statistically showed negatively significant result, similar with IIT export and IIT exim in model without 97/98, with policy variable. Also, TII variable shows insignificant result, similar with TII export and TII exim in model without 97/98, with policy variable.
All these results in the best model in model without 97/98, with policy variable reveal that an increase in intra-industry trade leads to less synchronisation of the business cycles of Indonesia and ASEAN+6. These findings are slightly different than those of Shin and Wang (2003). Following and modifying the initial model by Rose and Frankel (1998) using instrumental variables and time dummies, these authors found a significantly positive result for intra-industry trade between Korea and other Asian countries. However, the remaining variables showed mostly insignificant results.
28
intensity did not affect the synchronisation of business cycles between Indonesia and ASEAN+6.
This outcome corresponds with results reported by Cortinhas (2007) in an examination of ASEAN countries. This finding is because countries tend to have different characteristics. As a big and densely populated nation, Indonesia tends to have different economic conditions from those of the ASEAN+6 group (Cortinhas 2007). Consequently, Indonesia is less integrated with ASEAN+6, leading to unsynchronisation in business cycles.
Overall, the results indicate that greater trade integration, in particular, intra-industry trade between Indonesia and ASEAN+6, results in less synchronisation of business cycles among these nations. This might be because higher trade integration causes greater specialisation, leading to asymmetric shock on business cycle correlation. The remaining variables, trade intensity index had an insignificant effect on business cycle synchronisation between Indonesia and ASEAN+6. These refer that change in trade intensity index has no effect on business cycle coherence.
Policy Implications for Indonesia
In the previous section, it was clearly shown that intra-industry trade diverges business cycle co-movement between Indonesia and ASEAN+6. Therefore, appropriate interventions, effective policies and suitable regulations may bring positive effects to encourage integrated trade in synchronising economic cycles between Indonesia and ASEAN+6.
Generally, intra-industry trade should have impacts on less industry specialisation, affecting on more diversified economy and more harmonised business cycle. Nonetheless, according to Shin and Wang (2003), since there was a contrary effect in this study, it is important to change the trade pattern to alter the impact on business cycles from negative to positive. Otherwise, increase in trade integration between Indonesia and ASEAN+6 will lead to negative impacts on business cycle harmonisation among these nations. In terms of trade intensity index, Indonesia can increase intensity of trade with trading partner country in ASEAN+6 intensively.
These results followed Paul Krugman’s view (1991). According to him, there is another feature of the dynamics of trade with economies of scale that may make trade integration lower synchronisation of business cycle. Intra industry trade and trade intensity that occurs as a result of economies of scale also leads to regional concentration of industrial activities. The idea is that when barriers to trade decline, this has two opposing effects on the localisation of industries. It makes it possible to produce closer to the final markets, but it also makes it possible to concentrate production so as to profit from economies of scale. This explains why trade integration may in fact lead to less harmonisation of business cycle.
29
currency is not straightforward. A common currency area requires the joining country members to have similar economic patterns, like in the EU, because to meet this condition the cost of currency needs to be reduced. Otherwise, a common currency area will be not optimum. However, currently, according to the results of this investigation, ASEAN+6 are clearly not forming an optimum currency area.
5 CONCLUSION
Over the past decade, global trade has integrated beyond the borderline of the region. Therefore, the increase in international global trade activity has motivated a growing body of literature examining the result of integrated commerce on economic cycle co-movement among nations.
As the degree of regional trade integration in ASEAN+6 can strengthen or weaken over time, the challenge is how to encourage trade integration effectively among the members to bring about positive effects on business cycle coherence. By regressing panel data models, and using annual trade volume data, intra-industry trade by SITC 2 digit, H–P filter, real GDP, money supply, budget deficit and growth, and demand spill over from 12 ASEAN+6 economies, five main ASEAN countries and six added members over two decades, from 1990 to 2013, Indonesian trade with other ASEAN+6 countries was found to be less integrated, resulting in negative impact on business cycle coherence, following Krugman’s view (1991). This investigation was confirmed by the panel regression model. Instead of using instrument variables, this model was also constructed with an extended time dummy to fix up shock from one variable in one time period.
Intra-industry trade between Indonesia and ASEAN+6 negatively affects business cycle coherence. The results obtained by employing Frankel and Rose’s (1998) model and Grubel and Lloyd’s (1975) equation reveal that the trade intensity index has an insignificant impact on business cycle synchronisation between Indonesia and ASEAN+6. The different shifts and effects of trade integration on business cycles among ASEAN+6 nations can occur for many reasons. Each country may have a different effect or response despite experiencing the same shocks, such as differences in reaction to national output.
30
REFERENCES
Antonakakis, N &Tondl, G 2014, Does integration and economic policy coordination promote business cycle synchronization in the EU? Empirica, vol. 2014, no. 14, pp. 541 – 575.
Botha, I 2004, Modelling the business cycle of South Africa: Linear vs non linear methods, Disertation, R and Afrikans University.
Camacho, M, Quiros, GP, &Saiz, L 2008, Do European business cycles look like one? Journal of Economic Dynamics & Control, vol. 32, no. 1, pp. 2165 – 2190.
Cortinhas, C, 2007 Intra-industry trade and business cycles in ASEAN, Applied Economics, vol. 2007, no. 39, pp. 893–902.
Dai, Y, 2014 Business Cycle Synchronization in Asia: The Role of Financial and Trade Linkages, ADB Working Paper Series on Regional Economic
Integration, no. 139.
Dees, S & Zorell, 2012 Business cycle synchronization: Disentangling trade and financial linkages, Open Economic Review, vol. 23, no. 1, pp. 623 – 643. Duval, R, Cheng, K, Oh, KH, Saraf, R &Seneviratne, D 2014, Trade Integration
and Business Cycle Synchronization: A Reappraisal with Focus on Asia,
IMF Working Paper.
Frankel, J & Rose, A 1998, The endogeneity of the optimum currency area criteria, Economic Journal, vol. 108, no. 1, pp. 1009 – 1025.
Friedrich, C, Schnabel, I, & Zettelmeyer, J 2013, Financial integration and growth - is emerging Europe different? European Bank for Reconstruction and
Development, Working Paper, no. 123, pp. 1 - 42.
Greenaway, D & Milner, CR, 1986, The Economics of Intra-industry Trade, Blacwell, Oxford.
Grubel, HG & Lloyd, PJ, 1975, Intra-Industry Trade: The Theory And
Measurement Of International Trade In Differentiated Products, The
Macmillan Press, London.
Gujarati, D 2012, Basic Econometrics, Fourth Edition, Columbia University, New York.
Haan, JD, Inklaar, R & Pin, RJA, 2008, Will business cycle in the Euro Area converge? A critical survey of empirical research, Journal of Economic Surveys, vol. 22, no. 2, pp. 234 – 273.
Hamanaka, S 2014, Trans-pacific partnership versus comprehensive economic partnership: control of membership and agenda setting, ADB Working
Paper Series on Regional Economic Integration, no.146, pp.1 - 30.
Hausman, JA, 1978, Specification tests in econometrics. Econometrica, vol. 46, no. 6, pp. 1251-1271.
Jansen, WJ &Stokman, CJ, 2014, International business cycle co-movement: The role of FDI, Applied Economics, vol. 46, no. 4, pp. 383 – 393.
Krugman, PR, 1991, Rethinking International Trade, MIT Press, Massachusetts. Kumakura, M, 2006, Trade and business cycle co-movements in Asia-Pacific,
Journal of Asian Economics, vol. 17, no. 2006, pp. 622 - 645.
Lancaster, KJ, 1980, Intra-industry trade under perfect monopolistic competition,
31
Marrewijk, CV, 2007, International Economics: Theory, Application, and Policy, Oxford University Press, New York.
Massmann, M & Mitchell, J, 2004, Reconsidering the evidence: Are Euro area business cycle converging? Journal of Business Cycle Measurement and
Analysis, vol. 2004, np.3, pp. 275 – 307.
Misztal, P, 2013, International trade and business cycle synchronization in Poland, the European Union and the Euro Zone, Contemporary Economics, vol. 7, no. 3, pp. 65 – 78.
Moneta, F & Ruffer, R, 2006, Business Cycle Synchronisation in East Asia,
European Central Bank Working Paper Series, vol. 671.
McKinnon, R 1963, Optimum currency areas, American Economic Review, no. 53, pp. 717–724.
Mundel, R 1961, A theory of optimum currency areas, American Economic
Review, no. 51, pp. 509–517.
Park, YJ, 2013. Policy regional business cycles in East Asia: Synchronization and its determinants. Journal of East Asian Economic Integration, vol.17, no. 2, pp. 103 – 128.
Pentecote, JS, Poutineau, JC &Rondeau, F, 2015, Trade integration and business cycle synchronization in the EMU: The negative effect of new trade flows,
Open Economic Review, vol. 26, no. 1, pp. 61 – 79.
Pittiglio, R, 2012, Horizontal and vertical intra-industry trade: An empirical test of
the “homogeneity hypothesis”, The World Economy, vol. 10, no. 1, pp. 919
– 945.
Rana, P, 2007, Economic integration and synchronization of business cycle in East Asia, Journal of Asian Economics, vol. 18, no. 2007, pp. 711 – 725. Rana, P, Cheng, TW, & Chia, M, 2011, Trade intensity and business cycle
synchronization: East Asia versus Europe. Journal of Asian Economics, vol. 23, no. 6, pp. 701 – 706.
Reinert, KA, 2012, Perspectives on globalization and development — an introduction to the special issue, Journal of International Commerce,
Economics and Policy, Vol.03, no. 01, pp. 1-11.
Rose, AK & Stanley, TD, 2005, A meta-analysis of the effect of common currencies on international trade, J Econ Survey, vol. 19, no. 3, pp. 347 – 365.
Saiki, A & Kim, SH, 2014, Business cycle synchronization and vertical trade integration: A case study of the Eurozone and East Asia, DNB Working
Paper, no. 407.
Salvatore, D, 1995, International Economics, Mc. Millan, New York.
Schmidt, M, 2004, Business Encyclopedia, Solution Matrix Ltd. Boston USA. Schwarze, J, 2006, The development of the European Union from a common
market to a political union, Ritsumeikan Law Review, no.23, pp.91-98. Sen, R, Srivastava, S & Pacheco, G, 2013, The early effects of preferential trade
agreement on intra-regional trade within ASEAN+6 members, Journal of
Southeast Asian Economies, vol. 30, no. 3, pp. 237 – 249.
32
Shin, K & Wang, Y, 2003, Trade integration on business cycle co-movements: the case of Korea with other Asian countries, Japan and the World Economy, vol. 16, no. 1, pp. 213 – 230.
Shin, K & Wang, Y, 2005, The impact of trade integration on business cycle co-movements in Europe, International Journal of Finance & Economics, vol. 14, no. 1, pp. 104 – 123.
Song, EY, 2011, On gravity, specialization and intra-industry trade, Review of
International Economics, vol. 19, no. 3, pp. 494 – 508.
Van, C & Wijk, M, 2002, International Trade &The World Economy, Oxford University Press, Oxford.
World Bank 2015, World GDP Ranking, The World Bank, viewed 23 June 2016, <http://data.worldbank.org/data-catalog/GDP-ranking-table>.
33
35
Appendix.3. Panel Fixed Effect Regression Results
Variable Three Periods with Policy Variables
Three Periods without Policy
Variables Without 97/98, with Policy Variables
Without 97/98, without Policy Variables
Ex Im Exim Ex Im Exim Ex Im Exim Ex Im Exim
Panel Regression with Fixed Effect
Av_IIT -3.29007** -3.280139 -3.32335** -2.6936*** -2.7833** -3.0510** -4.037782* -3.820987* -3.939233* -3.1953** -2.9526** -3.0510** (1.233656) (1.201611) (1.226844) (1.36882) (1.354848) (1.19675) (1.135403) (1.147412) (1.147482) (1.19910) (1.175376) (1.196752)
av_M2 1.222577** 1.187101 1.206353** 0.7477867** 0.7041584*** 0.729097***
(0.439939) (0.4317033) (0.4372466) (0.3627931) (0.3827215) (0.3752314)
av_BD_GDP -0.4038633 -0.4133586 -0.4291727 0.2584586 0.2696756 0.2724239
(0.4732892) (0.4364401) (0.4496828) (0.2982699) (0.2821786) (0.29389)
av_TII_EX -7.178375 2.87651 -1.845016 -1.05711
(21.66561) (11.43456) (19.76555) (9.937358)
av_TII_IM -12.64546 0.9434577 2.79026 4.04229
(13.30205) (9.550623) (13.12007) (8.28801)
av_TII_EXIM -12.89429 2.063589 1.764682 2.063589
(17.84139) (9.499792) (17.31527) (9.499792)
D_SPIL_EX 0.0846567 -0.2069988
(0.9647817) (0.8391425)
D_SPIL_IM 0.465704 -0.2663734
(0.7529858) (0.6961424)
D_SPIL_EXIM 0.3647683) -0.2945341
(0.8656397) (0.7885323)
Num.ofobs 30 30 30 30 30 30 30 30 30 30 30 30
R2 0.5041 0.5242 0.5148 0.2248 0.2225 0.3096 0.5353 0.5249 0.5293 0.3082 0.3168 0.3096
36
Appendix. 4. Panel Fixed Effect with Time Dummies Regression Results
Variable Three Periods with Policy Variables
Three Periods without Policy
Variables Without 97/98, with Policy Variables
Without 97/98, without Policy Variables
Ex Im Exim Ex Im Exim Ex Im Exim Ex Im Exim
Panel Regression with Fixed Effect and time dummies
Av_IIT
-3.1837*** -0.6419367 -3.2189*** -2.413*** -2.423*** -2.403075 -4.037782** -3.82098** -3.74307** 2.8828*** -2.6198*** 0.3096
(1.547794) (0.9197064) (1.593473) (1.61623)
(1.554484) (1.612161) (1.393896) 1.539379 1.525193 (1.550336) (1.590639) (1.603833)
av_M2