63:1 (2013) 75–79 | www.jurnalteknologi.utm.my | eISSN 2180–3722 | ISSN 0127–9696
Teknologi
Elevated Temperature Fatigue Life Investigation of Aluminium Alloy
based on the Predicted S-N Curve
K. A. Zakariaa*, S. Abdullaha, M. J. Ghazalia
aDepartment of Mechanical and Materials Engineering, Universiti Kebangsaan Malaysia, 43600 UKM Bangi, Selangor, Malaysia
*Corresponding author: [email protected]
Article history
Received :15 January 2013 Received in revised form : 6 June 2013
Accepted :15 June 2013
Graphical abstract
Abstract
This paper discusses a methodology used to predict the stress-life (S-N) curve at elevated temperatures based on the normal S-N curve. Fatigue tests were performed under stress control at room temperature in accordance with the ASTM E466 standard to obtain a normal S-N curve. In addition, the tests were performed at both room and elevated temperatures using constant-amplitude, high-to-low sequence, and low-to-high sequence loadings to investigate the effect of the load sequence at elevated temperatures on fatigue life. Three elevated temperature regimes at 70 to 250C were chosen based on the maximum temperature of the engine mount bracket and the cylinder head that can be reached during normal service. The results show that the fatigue lives were significantly affected by the load sequences at both room and elevated temperatures. Furthermore, the existing fatigue data obtained at elevated temperatures can be used to predict the corresponding S-N curves.
Keywords: Aluminium alloy; elevated temperature; fatigue life; load sequences; S-N curve
Abstrak
Kertas kerja ini membincangkan satu kaedah yang digunakan untuk meramalkan lengkung hayat-tegasan (S-N) pada suhu yang ditingkatkan berdasarkan kepada lengkung S-N normal. Ujian lesu telah dijalankan di bawah kawalan tegasan pada suhu bilik mengikuti piawaian ASTM E466 bagi mendapatkan lengkung
S-N normal. Tambahan lagi, ujian lesu telah dilakukan pada kedua-dua suhu bilik dan juga suhu yang ditingkatkan menggunakan pembebanan amplitud malar, pembebanan dengan turutan tinggi ke rendah dan pembebanan dengan turutan rendah ke tinggi untuk menyiasat kesan turutan pembebanan ke atas hayat lesu pada suhu yang ditingkatkan. Tiga aras suhu yang ditingkatkan pada 70 ke 250C telah dipilih berdasarkan kepada suhu maksimum bagi pendakap penetap enjin dan kepala silinder yang boleh dicapai semasa operasi biasa. Keputusan menunjukkan bahawa hayat lesu dipengaruhi oleh turutan pembebanan pada kedua-dua suhu bilik dan suhu yang ditingkatkan. Tambahan pula, data lesu sedia ada yang diperolehi pada suhu yang ditingkatkan boleh digunakan untuk meramalkan lengkung S-N yang berkaitan.
Kata kunci: Aloi aluminium; suhu ditingkatkan; hayat lesu; turutan pembebanan; lengkung S-N
© 2013 Penerbit UTM Press. All rights reserved.
1.0 INTRODUCTION
Fatigue failure may occur in any engineering component that subjected to cyclic loading below the ultimate strength of a material. A progressive degradation of material properties occurs under this cyclic loading and caused to an eventual failure to the components. In fatigue life assessment, most of the fatigue characterisation of material is performed under the constant-amplitude loading (CAL) [1]. However the great majority of structures and components in applications are subjected to stress of variable amplitude [2]. Thus, it is a great important to understand the failure mechanism associated with variable amplitude loading (VAL) and to have a capability of quantifying the fatigue lives under the VAL [3].
The fatigue life of a material at elevated temperatures decreases compared with that at room temperature [4]. Fatigue at elevated temperatures produces a larger strain deformation, contributes to the crack initiation process, and accelerates the crack growth rate. Materials or structures subjected to cyclic loading at elevated temperatures may fail in modes that are different from normal fatigue fracture [5]. Therefore, the strength of a material at various high-temperature regimes becomes a critical issue that must be considered.
CAL is plotted on a semi-log or log-log scale that contains few experimental data. It is recommended that a minimum of six test samples required to generate the S-N curve for research and development tests [6]. The number of test samples need to be used will increase for various level of testing temperature which also will increase the testing cost.
This paper proposes a method to predict the S-N curve at elevated temperatures based on the minimum number of samples used in the experiment. Fatigue tests were conducted according to an ASTM E466 standard using a servo-hydraulic fatigue testing machine. Fully reverse axial loading fatigue tests were performed at room temperature to develop the normal S-N curve. Several samples were then used to study the effect of the load sequence at elevated temperatures. The number of cycles to failure was expected to be affected by the type of load sequence and test temperatures.
2.0 METHODOLOGY
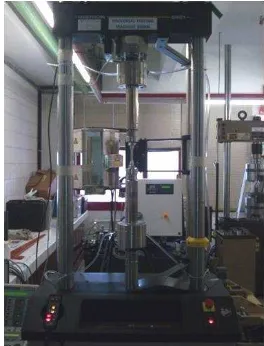
The fatigue samples were made of an aluminium alloy, AA 6061-T6, which is cylindrical in sections and has a gauge diameter of 10 mm and a gauge length of 30 mm. The exact geometric dimensions are based on the information in the American Society for Testing and Materials (ASTM) E466 [7] and shown in Figure 1. A tensile test was performed on the sample prior to fatigue test in order to determine the mechanical properties of the as-received material. The fatigue tests were performed according to the ASTM E466 standard using the 100 kN servo-hydraulic testing machine, as shown in Figure 2. The tests were conducted using a fully reversed axial loading (R=-1) under stress control at room temperature to obtain the normal S-N curve. In addition, three types of loadings i.e., CAL, high-to-low sequence loading, and high-to-low-to-high sequence loading were used at 27, 70, 150, and 250C to study the effect of the load sequence on fatigue life. The elevated temperature range was choose based on the maximum temperature of the engine mount bracket and the extreme temperature of the cylinder head that can be reached in service [8].
Figure 1 Model geometry of the fatigue test sample
Figure 2 Servo-hydraulic fatigue testing machine
The spectrum loadings were derived from the fatigue data loading of the engine mount bracket of a 1,300 cc automobile. CAL, high-to-low sequence loading, and low-to-high sequence loading were derived from the original time histories strain signal in order to study the effect of loading sequences on the fatigue lives. These spectrum loadings were developed based on the calculated equivalent damage values in the cycles [9,10]. The CAL was designed using Glyphworks® software
represented the captured fatigue data loading. Strain life analysis of the original strain signals was performed to calculate the fatigue damage and was then compared to the designed loading, as shown in Figure 3. The fatigue damage calculation based on strain-life analysis was suitable to be used in the analysis since it relates to small a component and often used for ductile materials at relatively low cycle fatigue. The strain life concept was based on the assumption that the fatigue cracks were initiated by the local strains and stresses on the surface of a component [11]. The designed CAL shall contribute to the same total fatigue damage value as the original fatigue data loading. Similar method was used to design the high-to-low and low-to-high sequence loadings. All cases of load spectra are shown in Figure 4.
(a) CAL (b) high-to-low (c) low-to-high
Figure 4 Loading sequences used in the fatigue test
3.0 RESULT AND DISCUSSION
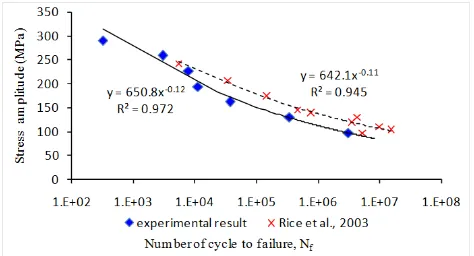
Figure 5 shows a semi-log plot of the stress amplitude versus the number of cycles to failure at room temperature. This S-N curve shows that fatigue life generally increases with decreasing cyclic stress amplitude, which normally occurs in other aluminium alloys. The S-N curve was developed using curve fitting of curve fitting, the values of the material constants A and b were determined at 650.8 MPa and -0.12. In other research findings [13], the trend of S-N curve for AA6061-T6 (refer Fig. 5) is almost similar, with the values of A and b are 642.1 MPa and -0.11, respectively.
Figure 5 Normal S-N curve of AA6061-T6 tested at room temperature
Figure 6 shows the effect of elevated temperatures on the fatigue lives for each type of load sequence. As the temperature increased, the fatigue lives were shortened because of exterior aggressive conditions and the change in the internal parameters of the material itself. An increase in the testing temperature can accelerate the rate of oxidation and induce the irreversibility of a cyclic slip, which can cause damage to the microstructure [12]. The tensile test performed at elevated temperatures indicates a considerable degradation in strength with increased temperature [14]. All changes affected the fatigue life of the materials. It is noticed that the number of cycle to failures reduce exponentially with the temperature increase. This finding is concordance with other research findings performed by Hong et al. [15]. From the curve fittings, the relationship between number of cycles, Nf and testing temperature, T under the CAL is defined by following equation:
��= 9. �−0.00 � (2)
Meanwhile, the equation for high-to-low and low-to-high sequence loadings is defines in equation (3) and (4), respectively:
��= . �−0.00 � (3)
��= 9 . �−0.00 � (4)
Figure 6 Comparison of the number of cycles to failure for the different
sequence loadings
tabular data, a general equation of the temperature sensitivity parameter, c for theAA6061-T6 aluminium alloy can be expressed as follows:
� = − . � + . 9 (6)
Figure 7 Relationship between the temperature sensitivity parameter
and the absolute temperature for the AA6061-T6 aluminium alloy
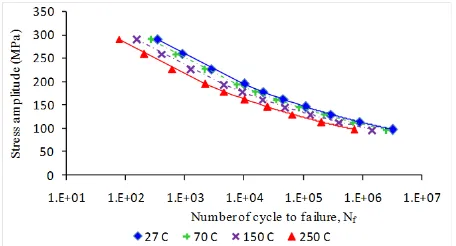
At various elevated temperatures, the number of cycles to failure can be obtained by substituting all constant parameters and various applied stress amplitudes into Equation (2). Figure 8 shows a semi-log plot of the stress amplitude versus the number of cycles to failure at four different temperatures. The S-N curve shifted to a lower fatigue life with the increase in the temperature. The fatigue life at room the temperature and at the applied stress amplitude of 150 MPa is approximately 100,000 cycles, whereas that at the test temperature of 250C at the same applied stress is only approximately 20,000 cycles. The fatigue lives at 70 and 150C fall between 20,000 and 100,000 cycles. The trend of this S-N curve is similar to those obtained in other similar studies on aluminium alloy, AA6110 [17].
Figure 8 Predicted S-N curve of AA6061-T6 at elevated temperatures
Figure 9 presents the tabular data of experimental fatigue test result at 250C against the prediction curve obtained using equation (2) and (3). Results of experimental findings are found close to prediction curve indicates a close agreement between the experimental results and prediction results. From Figure 9, it is seen that the experimental results at higher level of stress amplitude (more than 190 MPa) tends to give slightly variance with prediction results since points laying at both top and bottom portion of the prediction curve. However, at lower level of stress amplitude, the experimental results are more close to the prediction plot. This trend suggested due to testing condition observed more stable at lower stress level compared at higher stress level. Higher stress amplitude found to be contributed to more vibration response during the durability test [18].
Figure 9 A comparison of experimental results and prediction curve for
fatigue test at 250C
4.0 CONCLUSIONS
This paper discussed the prediction of the S-N curve of an aluminium alloy at elevated temperatures based on the normal S-N curve. A relationship between temperature sensitivity, c and elevated temperature test for AA6061 was obtained in this study and can be used to predict the S-N curve. The fatigue life of the AA6061 significantly decreased from approximately 75% to 83% when the temperature was increased from 27C to 250C. As a result, the S-N curve for the elevated temperatures shifted to a lower fatigue life. A load sequence effect was also observed in the study. The shortest fatigue life was observed under CAL, whereas the longest fatigue life was under the low-to-high sequence loading at both room and elevated temperatures. However, the load sequence effect was more significant at room temperature than at elevated temperatures.
Acknowledgement
The authors would like to express their gratitude to Universiti Kebangsaan Malaysia and Universiti Teknikal Malaysia Melaka for supporting these research activities.
References
[1] Post, N. L., Case, S. W., Lesko, J. J. 2008. Modeling the Variable Amplitude Fatigue of Composite Materials. International Journal of Fatigue. 30: 2064–2086.
[2] Zhang, Y. H., Maddox, S. J. 2009. Investigation of Fatigue Damage to
Welded Joints Under Variable Amplitude Loading Spectra. International Journal of Fatigue. 31: 138–152.
[3] Wei, L. W., de los Rios, E. R., James, M. N. 2001. Experimental Study on Modelling of Short Fatigue Crack Growth in Aluminium Alloy A17010-T7451 Under Random Loading. International Journal of Fatigue. 24: 963–975.
[4] Tokaji, K. 2006. High Cycle Fatigue Behaviour of Ti-6Al-4V Alloy at
Elevated Temperatures. Scripta Materialia. 54: 2143–2148.
[5] Bahaideen, F. B., Saleem, A. M., Hussain, K., Ripin, Z. M., Ahmad,
Z. A., Samad, Z., Badarulzaman, N. A. 2009. Fatigue Behaviour of Aluminium Alloy at Elevated Temperature. Modern Applied Science. 3: 52–61.
[6] Lee, Y.L., Pan, J., Hathaway, R. B., Barkey, M. E. 2005. Fatigue Testing and Analysis (Theory and Practice). United State of America: Elsevier Butterworth-Heinemann.
[7] ASTM Standard E466-96. 2003. Standard Practice for Conducting
Force Controlled Constant Amplitude Axial Fatigue Tests Of Metallic Materials. Annual Book of ASTM Standard Vol. 03.01. ASTM International.
[9] Pereira, H. F. S. G., de Jesus, A. M. P., Ribeiro, A. S., Fernandas, A. A. 2008. Influences of Loading Sequence and Stress Ratio on Fatigue Damage Accumulation of a Structural Component. Science and Technology of Materials. 20: 60–67.
[10] Abdullah, S., Choi, J. C., Giacomin, J. A., Yates, J. R. 2006. Bump Extraction Algorithm for Variable Amplitude Fatigue Loading. International Journal of Fatigue. 28: 675–691.
[11] Draper, J. 2007. Modern Metal Fatigue Analysis. United kingdom: Emas Publishing.
[12] Liu, Y., Yu, J. J., Xu, Y., Sun, X. F., Guan, H. R., Hu, G. Q. 2007. High Cycle Fatigue Behaviour of a Single Crystal Super Alloy at Elevated Temperatures. Materials Science and Engineering A. 454– 455: 357–366.
[13] Rice, R. C., Jackson, J. L., Bakuckas, J., Thompson, S. 2012. Metallic Materials Properties Development and Standardization. Scientific Report. Washington DC: Department of Transportation Federal Aviation Administration.
[14] Uematsu, Y., Akita, M., Nakajima, M., Tokaji, K. 2007. Effect of Temperature on High Cycle Fatigue Behaviour in 18Cr-2Mo Ferritic Stainless Steel. International Journal of Fatigue. 30: 642–648.
[15] Hong, S. G. Lee, S. B. 2005. Mechanism of Dynamic Strain Aging and Characterization of Its Effect on the Low-Cycle Fatigue Behavior in Type 316L Stainless Steel. Journal of Nuclear Materials. 340: 307– 314.
[16] Yamada, K., Cao, Q., Okado, N. 2000. Fatigue Crack Growth
Measurements Under Spectrum Loading. Engineering Fracture Mechanics. 66: 483–497.
[17] Jiujerm, P., ltenberger, I.A. 2007. Effect of Temperature on Cyclic Deformation Behaviour and Residual Stress Relaxation of Deep Rolled Under-aged Aluminium Alloy AA6110. Materials Science and Engineering A. 452–453: 475–482.
[18] Mohammad, M., Abdullah, S., Jamaludin, N., Nuawi, M. Z. 2012. Correlating Strain and Acoustic Emission Signals of Metallic Component Using Global Signal Statistical Approach. Advanced Materials Research. 445: 1064–1069.