THE ANALYSIS OF SELECTED MACROECONOMIC VARIABLES THAT INFLUENCE STOCK RETURNS’ JAKARTA ISLAMIC INDEX
(JII) AND ITS VECTOR AUTOREGRESSIVE (VAR) FORECASTING Case Study: 10 companies listed in Jakarta Islamic Index period
2008-2012
FEBRYAN MUJAHID PANATAGAMA1
AGUS TRI BASUKI2 ABSTRACT
The main objectives of this study is to analyze the influence of macroeconomic variables to stock returns of 10 companies listed in Jakarta Islamic Index (JII) Indonesia Stock Exchange Market in the Arbitrage Pricing Theory fra mework and further conduct stock returns forecasting under Vector Autoregressive Model estimation. The macroeconomic variables in this study consist of Bank Indonesia interest rate, costumer price index, Brent international oil price and trading volume. The stock returns of 10 companies listed in JII and the selected macroeconomic variables are monthly panel data starting from December 2007 to January 2013. The result of this study indicates negative influence of Bank Indonesia interest rate and Brent international oil price to stock returns of 10 companies listed in JII. In addition costumer price index had positive influence to stock returns of 10 companies listed in JII. Meanwhile, trading volume had no causal relationship with stock returns; therefore, it cannot be involved in the Vector Autoregressive model. Impulse responses and Variance decomposition analysis results indicate that costumer price index had dominant influence to stock returns of 10 companies listed in JII rather than Bank Indonesia interest rate and Brent oil price. Eventually, on the basis of Schwarz Information Criteria (SIC), Akaike Information Criteria (AIC) and Automatic Eviews7 lag length determination we conclude that each equation consists of five lag value of stock returns, Bank Indonesia interest rate, costumer price index and Brent oil price. The estimated Vector Autoregressive VAR(5) predicts negative stock returns in year 2013.
Keywords: macroeconomic variables, stock returns, Jakarta Islamic Index (JII), Arbitrage Pricing Theory, Vector Autoregressive (VAR), Schwa rz Information Criteria (SIC), Akaike Information Criteria (AIC), forecasting
1
1. Background
According to Jaribah (2008), capitalization becomes the most important milestone in developing national economy. Umar economic jurisprudence defines capitalizations into two kinds, as basic and social capitalization. Basic capitalization refers to basic factors of production including investment. Social capitalization refers to infrastructure such as cities, mosque and market. Islamic capital market represents those capitalizations where investors develop their portfolio. These will develop wealth and capital market in the same time. A modern economic country develops its capital market for supporting their national economy.
Islamic economic system arises after global monetary crisis in 2008. It comes as an alternative economic system offering fair and justice in the economy. The system comes along with its instrument such Islamic capital market become the centre of muamalah activities which permitted as long as in line with sya riah law Karim (2004). An Islamic capital market offers investment portfolios regarding to Islamic investment principles. There is different meaning of investment between conventional and Islamic economic system. The conventional system defines investment as the total income subtracted by total consumption and saving for maximizing returns. The Islamic economic system defines investment as part of wealth consists of return and social values such as generosity, worship and al maqashid al sya riah. In the other words, Muslim investors are expected to bear risk beside return in different perspective comparing to investor in general.
Indonesia is a country with the largest Muslim population; therefore, Indonesian Muslim have to realize and consider their fast economic development by initiating strong foundation of national economy thought its real and monetary sector. Islamic capital market is the only institution for supporting national economy. Islamic capital market has two functions to support national economy. First, it functioned as financial market where investment portfolio is traded. Second, it functioned as real economic financial intermediary where fund is distributed from lender to borrower.
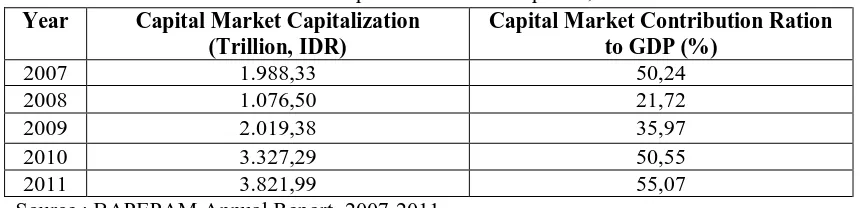
Indonesia Islamic capital market is a part of conventional capital market. So it almost impossible to separate both market. Therefore, we would like to examine how far Indonesia capital market contributes national economic growth through this following illustration:
Table 1. Indonesia Capital Market Development, 2007-2011 Year Capital Market Capitalization
(Trillion, IDR)
Capital Market Contribution Ration to GDP (%)
2007 1.988,33 50,24
2008 1.076,50 21,72
2009 2.019,38 35,97
2010 3.327,29 50,55
2011 3.821,99 55,07
Source : BAPEPAM Annual Report, 2007-2011
capitalization and its contribution to GDP become one indicators of Indonesia capital market development. 2008’s IDX market capitalization is 1.076,50 trillion, decreasing 46,42% from 2007s’ capitalization which is 1.988,33 trillion. In 2009 IDX market capitalization is significantly increased 87,59% from 1.076,50 in 2008 to 2.091,38 trillion. In 2010 IDX market capitalization is increased 46,13% from 2.091,38 trillion in 2009 to 3.247,10 trillion in 2010; Furthermore in 2011, IDX market capitalization also increased 3,20% from 3.247,10 trillion in 2010 to 3.821,99 trillion in the end of 2011.
Subject to the economic condition the contribution of capital market to GDP is fluctuating. In 2007 capital market contributes 50,24% and decreased significantly to 21,72% in 2008. In 2009, capital market contribution experienced light increasing from 21,72% in 2009, to 35,97% in 2010. The increasing of capital market contribution to GDP is continuously increased respectively from 35,97% in 2009 to 50,55% in 2010 and also 55, 07% in 2011.
Indonesia capital market has the experience of excellent performance during past five years. In 2007 it contributes 50,24% and there are decreasing trends in the next two following years (year 2008-2009) due to the global financial crisis at that
time. The crisis doesn’t impact Indonesia capital market negatively. It’s proven by the increasing in trend of capital market contribution to GDP from year 2008 until 2011. In other words, Indonesia capital market is relatively secure and profitable. In the other hand, Jakarta Composite Index in year 2009 was awarded as the best index in ASEAN and second best index in the world. In addition, in year 2010 Indonesia index was nominated as the best index in Asia Pacific and the second best index in Asia Pacific in 2011.
Indonesia conventional capital market and the Islamic capital market is an
entity. Both couldn’t stand alone; meaning that, the development of Indonesia capital
market represents the development of Indonesia Islamic capital market. Although
Indonesia isn’t Islamic based country, it is the world largest Muslim in population country. It becomes one of potential developing market in the Islamic finance world industry.
Jakarta Islamic Index consists of 30 most liquid syariah compliance stocks. This research examines 10 companies which are continuously being listed in JII since 2008 to 2012. JII10 consists of 10 companies from various sectors including infrastructure, agriculture, utility, chemical industry, mining and consumption. All of companies have been listed in JII since 2008 to 2012 without delisting from JII. Unilever and Kalbe Farma Ltd represent as Consumption industry, Telekomunikasi Indonesia Ltd represents as Utility industry, Semen Gresik and Indocement Tunggal Prakasa Ltd represent as Chemical industry, Astra Agro Lestari represents as Agriculture industry, Tambang Batubara Bukit Asam, Aneka Tambang and Timah Ltd represent as Mining Industry and United Tractor Ltd represents Trading industry Ltd.
Stocks market investment faces the possibility of generating both risks and returns; JII10s’ stocks will not be free from risk as well. As explained previously,
Islam doesn’t merely treat investment for profit maximization, but also consists of worshiping spirit. According to Novia (2011), in more practical market, risk relates to price fluctuation for several stocks or sectors. It happened because of investor responds’ on the changing of expected rate of return.
There are some researches on the influence of macroeconomic variable on stock returns in several countries with various results. According to Ahmet
Bűyűksalvarecı (2010), return on stock in Turkish Stock Exchange Market was negatively influenced by foreign exchange rate, oil price, industrial production index and money market interest rate. In addition, money supply had positive influence on stock returns. Meanwhile, the costumer price index had no significant influence on stock return. Otherwise according to Benaković (2010), return on stock in Croatian Capital Market was negatively influenced by inflation and positively influenced by other macroeconomic variable such as industrial production index, interest rate, and market index and oil price. Nazir (2010) also described return on stock in Pakistan Equity Market was negatively influenced by inflation, exchange rate and interest rate. Meanwhile political stability had positive influence on it. In Malaysia Islamic Stock Market according to Hussin (2012), return on stock was negatively influenced by some macroeconomic variable such as industrial production index and costumer price index. The other macroeconomic variable; such as money supply and exchange rate; was positively influenced return on stock in the market. According to Novia (2010), Jakarta Islamic Index return on stock was negatively influenced by costumer price index and exchange rate. Furthermore, industrial production index and Indonesia composite index had positive influence to stock returns. Money supply and interest rate had no significant influence to JII stock returns. According to Puteh (2010), Indonesia composite index stock returns ware positively influenced by inflation, exchange rate and interest.
index, money supply, trading volume, gold and oil price varied on its significance depend on market efficiency in each country.
Investment has two common analytical tools to determine the relationship among the expected return and risk of investment; there are Capital Asser Pricing Model (CAMP) and Arbitrage Pricing Theory (APT) (Chen and Ross in
Bűyűksalvarecı, 2010). CAPM describes balance relationship between risks of each asset in a balance market by strictly take beta of individual stock returns to market
portfolios’ returns. The Arbitrage Pricing Theory (APT) becomes model to explain
risk and return relationship in an investment. It developed by Ross in 1976. APT comes with more general determinants rather than CAPM in explaining risk and returns of investment, rather than strictly hold on beta of individual stock return to market portfolios’ returns. It allows return of investment to be generated from many variables such as macroeconomic variables (Pudjiastuti, 2004).
This study aims to analyze the effects of macroeconomic variables on Jakarta Stock Exchange Market on APT framework and provide further forecast on JII
selected 10 companies’ stock returns. Jakarta Islamic Index 10 selected companies abbreviated as JII10 is on the basis of monthly data, starting from January 2008 to December 2012 and relates to three macroeconomic variables. The macroeconomic variables in this study are Bank Indonesia Rate, Costumers Price Index and Brent standard oil price. Furthermore, this study will examine 10 companies stock returns which are listed in JII from 2008-2012 with no de-listing record from it. The selection supposed to ensure company healthiness and the fulfillment of Islamic investment
principles. Eventually this research entitles with “The Analysis of Selected Macroeconomic Va riables that Influence Stock Returns Jaka rta Islamic Index and Its Vector Autoregressive (VAR) Forecasting.” (Ca se study: 10 companies listed in Jakarta Islamic Index Period 2008-2012)
2. Limitation
Study limitation aims to restrict the analysis problems that may occurred. Therefore, this study is restricted to the following limitations:
1. Focus on stock of ten companies listed in JII during research period.
2. The stock returns refer to the changes of stock price movement of the ten companies.
3. The study period is January 2008 – December 2012 monthly time series data.
3. Research Questions
The investors relay their decision to some important information in particular financial condition and macroeconomic condition.
The information of companies’ financial condition and macroeconomic condition contribute major suggestion to public companies that have relatively higher sensitivity to macroeconomic fluctuating condition. Previous studies on macroeconomic variables that influence return on stock in Turkey, Aman, Croatia, Pakistan, Malaysia and Indonesia have been conducted. Those studies provide
different evidence. According to Benaković (2010), costumer price index had negative influence to stock returns in Croatian capital market, while Novia (2010) found costumer price index had negative influence to Indonesia stock returns as well. In the other hand, according to Hussin (2012) costumer price index had positive influence to stock returns in Malaysian Islamic stock market. According to Puteh (2010), interest rate had positive influence to Indonesian stock returns; In the other hand Croatian stocks’ return is positively influenced by interest rate, oil price and market index (Benaković, 2010). According to Nazir (2010), interest rate was negatively influenced by Pakistan stock returns. The former studies found that Industrial production index has positive influence in Indonesian, Malaysian and Croatian stock returns; while negative influence is found in Aman stock returns. The studies also found that money supply was negatively influence to Malaysian stock returns and positively influence Aman stock returns.
Different evidence coming from the former studies results in different information that describes the influence of investor investment in Indonesia stock market. Therefore, further study is needed in order to update the relevant information. Based on those problems, the research questions of this study are declared in these following questions:
1. What is the influence of interest rate to JII10 stock returns?
2. What is the influence of costumer price index to JII10 stock returns? 3. What is the influence of oil price to JII10 stock returns?
4. What is the influence of trading volume to JII10 stock returns?
4. Research Aims
This study defines these following aims in order to answer the research questions:
1. To analyze the influence of costumers price index to JII10 stock returns. 2. To analyze the influence of interest rate to JII10 stock returns.
3. To analyze the influence of oil price to JII10 stock returns. 4. To analyze the influence of trading volume to JII10 stock returns. 5. Previous Researches
four lag values of Stock on
Source: Relevant Undergraduate Thesis and Journals
The previous studies provide relevant information and motivate future research as enrichment of the empirical study to stock market field. Therefore, the author distinguishes this study by offering these following particular differences:
1. Research case study
This study will cover the case of companies listed in Jakarta Islamic Index (JII) starting from year 2008 until 2012.
2. Variables
This study use costumer price index, oil price and interest rate which have various contradictions in the previous studies.
3. Research Period
The data that will be used in this study consists of companies which are listed in JII since year 2008 until 2012.
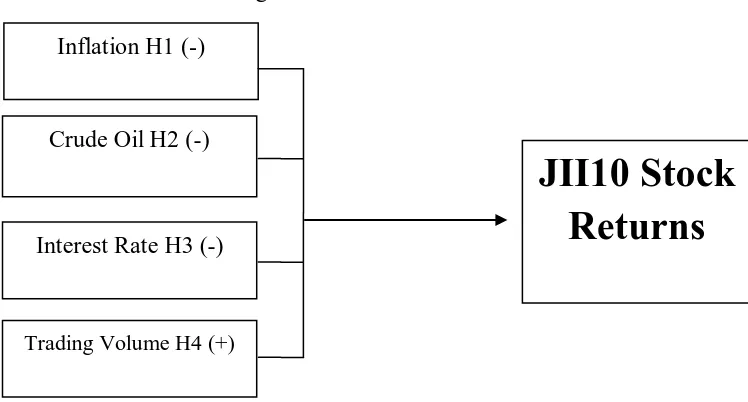
Figure 1. Research Framework
Source: Agrawal (2010), Bűyűksalvarecı (2010), Posedel (2010), Nazir (2010), Hussin (2012), Maysami (2004), Novia (2010), Kowarnu (2012) Khan and Rizwan (2008) and Hasan, Jinnan and Javed (2009)
6. Hypothesis
On the basis of previous research questions, research objectives, theoretical
backgrounds, previous researches’ results and research framework. This study develops these following hypotheses:
1. H1: There is negative effect of costumer price index to JII10 stock returns period 2008-2012.
2. H2: There is negative effect of crude oil price to JII10 stock returns period 2008-2012.
3. H3: There is negative effect of interest rate to JII10 stock returns period 2008-2012.
4. H4: There is positive effect of trading volume to JII10 stock returns period 2008-2012.
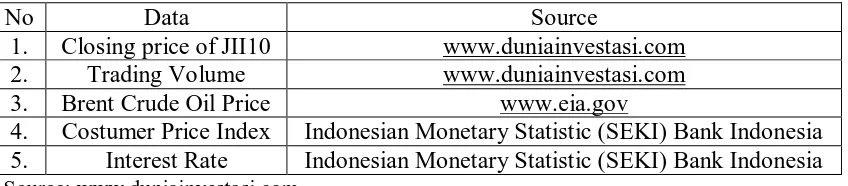
7. Research Variables and Operational Definitions 7.1. Data Collecting Method and Sources
The ultimate goal of this study is to explore the effect of selected macroeconomic variables on JII10 stock returns and forecast the future value of JII10 stock returns. It uses secondary time series data starting from December 2007 to January 2013 from several sources. The following table represents research data and it sources:
JII10 Stock
Returns
Trading Volume H4 (+)
Crude Oil H2 (-) Inflation H1 (-)
Table 3. Data and Sources
No Data Source
1. Closing price of JII10 www.duniainvestasi.com
2. Trading Volume www.duniainvestasi.com
3. Brent Crude Oil Price www.eia.gov
4. Costumer Price Index Indonesian Monetary Statistic (SEKI) Bank Indonesia 5. Interest Rate Indonesian Monetary Statistic (SEKI) Bank Indonesia
Source: www.duniainvestasi.com
This study also obtains relevant information from official websites, magazines, journals and articles regarding to the relevant field of study.
7.2. Research Variable and Definitions
According to Sugiarto (2006), research variable is an attribute or characteristic of object or activity which has some varieties. Those varieties are determined by researcher to be observed and concluded. This research consists of two variables which are dependent and independent variable. Dependent variable of this research is stock returns while the independent variable of this research is inflation, interest rate and oil price.
7.3. Econometric Model
Econometric model is statistical model used in econometrics. It defines the statistical relationship between variables in particular phenomena. This study uses this following Econometric model:
Model 1:
Model 2:
Model 3:
Model 4:
Where is Stock returns (RJII10), is Costumer price index (CPI), is Brent Oil price (OIL), is Bank Indonesia Interest rate (BIR), is Trading volume (VOL), is Error term (t1,2,3,4,5), l is Lag length with l = 1,2,…, x and x is maximum lag.
The above equation derives this following Vector Autoregressiveorder p :
Where p is predicted lag.
7.4. Operational Definitions
Dependent variable is a variable that being described or influenced by other variables (independent variable). The dependent variable of this study is return on stock JII10 consists of 10 selected companies stocks. The value of JII10 stock returns
is obtained by calculation of JII10s’ closing price by using this following equation:
Where is Return for Month t, is Closing price of JII10 stock for month t and is Closing price of JII10 stock for month t-1 respectively.
The independent variable is a variable that describe or influence other variable. This study uses these following independent variables: inflation, interest rate and oil price.
a. Inflation
Inflation is a continuous increasing in general price level. Costumer price index is the representative of inflation that measures the average change in prices of goods and services in a particular period of time.
b. Interest Rate
Bank Indonesia rate is used as the representative of interest rate which is nationally used as the monetary standard of Indonesian interest rate. c. Oil Price
Brent oil price becomes the representative for international oil price in this research.
d. Trading Volume
Table 4. Operational Definitions Research Variables
No Variable Definition Scale
1. Stock Returns Profit results when the price of a stock held
by investor rises above its purchase price. Ratio
2. Inflation Inflation is the continuous increasing in
general price level. Ratio
3. Brent Oil Price Brent international oil price Ratio
4. Bank Indonesia
Interest Rate BI Rate Ratio
5. Trading Volume The amount of tradable stock in certain period
of time Ratio
Source: Relevant Journals and Books
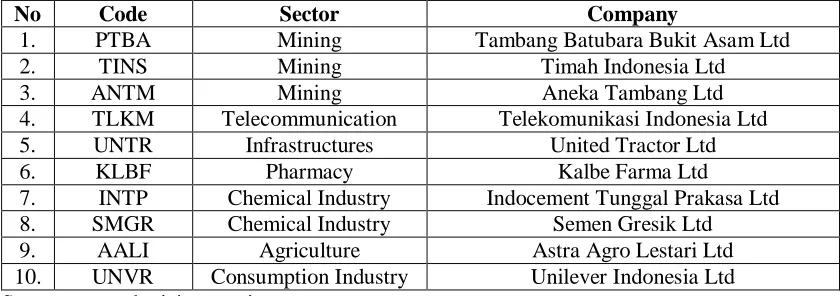
7.5. Research Sample
Population is compilation of elements. It becomes core focus in a study while sample becomes a part of population. This study population is companies which are listed in Jakarta Islamic Index (JII) since year 2008 until. Those companies are chosen regarding their liquidity, sya riah acceptability and market acceptability. Meanwhile, this study sample is 10 selected companies which are listed in Jakarta Islamic Index (JII) since year 2008 until 2012. Those years involves of Indonesian economic recovery moment after global financial crisis in 2008. Judgment sampling method is used in this research. It takes the samples in accordance to pre-determined criteria mentioned below:
1. The selected companies are public company that is listed in Jakarta Islamic Index continuously since 2008-2012.
2. The selected companies represent almost sectors available in the index. 3. The selected companies have strong fundamental basis.
From total population of 30 companies, this study takes 10 companies that fulfill the sample criteria. Table 5. describes the list of companies selected in this research:
Table 5. The List of Sample Companies
No Code Sector Company
1. PTBA Mining Tambang Batubara Bukit Asam Ltd
2. TINS Mining Timah Indonesia Ltd
3. ANTM Mining Aneka Tambang Ltd
4. TLKM Telecommunication Telekomunikasi Indonesia Ltd
5. UNTR Infrastructures United Tractor Ltd
6. KLBF Pharmacy Kalbe Farma Ltd
7. INTP Chemical Industry Indocement Tunggal Prakasa Ltd
8. SMGR Chemical Industry Semen Gresik Ltd
9. AALI Agriculture Astra Agro Lestari Ltd
10. UNVR Consumption Industry Unilever Indonesia Ltd
7.6. Analysis Method
Vector Autoregressive (VAR) model observes the relationship between stock returns and macroeconomic variables and further forecasts the future value of stock returns by following these procedures:
a. Unit Root Test – Augmented Dickey-Fuller Test
b. Correlation Matrix - Johansen-Juselius Cointegration Test c. Granger Causality Test
d. Variance Decomposition and Impulse Response Analysis e. Forecasting with Vector Autoregressive (VAR)
In detail those mentioned techniques will be described in the following explanation.
a. Unit Root Test and Covariance Matrix
According to Thomas (1997), Unit root test supposed to figure out the stationary of research data. The null hypothesis is tested by Augmented Dickey-Fuller test. The ADF test defines the existence of unit root in the research data. Supposed in a random walk model equation:
Where Y is the observed variable, t is period of time, ρ is coefficient and е is error term
And so the regression model could be figured as the following equation:
Where δ is (ρ – 1) with Δ as its first difference and the regression comes with this following hypothesis:
Means the unit roots exist and the data is not stationer.
Means the unit roots not exist and the data is stationer.
The existence of units root implies spurious behavior in the data; furthermore, after the stationary of research data is known the linearity of research data testing will be conducted trough cointegration test.
7.6.1. Johansen-Juselius Cointegration Test
Vector Autoregressive (VAR) is used to examine the existence of multivariate cointegration among the variables.
According to Irawan (2005), Vector Autoregressive (VAR) becomes an equation system where in every variable is a linear function of the Constanta and its lag value. The independent variables in VAR cover the lag value of dependent variable entirely. The following equation illustrates how independent variable in VAR covering the lag value of dependent variable in a model:
Where is Dependent variables’ vector ( , , is Intercept vector n x 1, is Parameters’ matrix n x 1 and is Vectors’ residual ( , n x1
VAR assumes that the all independent variables in the model do not correlate each others.
According to Widarjono (2005), the Johansen procedures select the value of Lag length in the basis of Akaike Information Criterion (AIC) and Schwarz Information Criterion (SIC).
Where is the amount of squared resuidual, k is the amount of independent variable and n is the amount of observations.
In addition, the Error Correction Term is inserted only if the co-integration exists in order to oversight the short-run deviation due to the impact of financial development behavior that apparently more obvious in short-run rather than in long-run.
7.6.2. Granger Causality Test
According to Granger (1988), the existence of cointegrating vectors implies that granger causality exists at least in one direction. A granger variable causes the other variable only if it assists its future value. In cointegrated series variables might be share similar stochastic trends. This research conducts Granger causality test to look for directional relationship among variables.
7.6.3. Variance Decomposition and Impulse Response Analysis
According to Sims (1992) in Ajija (2007) impulse response function (IRF) illustrates the expectation of future period from variable forecast deviation due to other variable innovation effects. It exposes the existence of shock variable to other variable until its equilibrium point. Variance decomposition of forecast error variance decomposition becomes an instrument of VAR that separate the estimated variable to be shock variable or innovation variable; where it assumes that the innovation variable do not correlate each others. The variance decomposition analysis provides information of the movement of shock variable to certain variables and so to another shock variable.
7.6.4. Descriptive Statistics
Descriptive statistics becomes a set of whole descriptive coefficient concluded the variables in a study. It represents the entire population or sample in the study and explains data central tendency and dispersion measurement. Eviews7 is used as the econometric tool to analyze the data. Eventually, this study finds the following descriptive statistics:
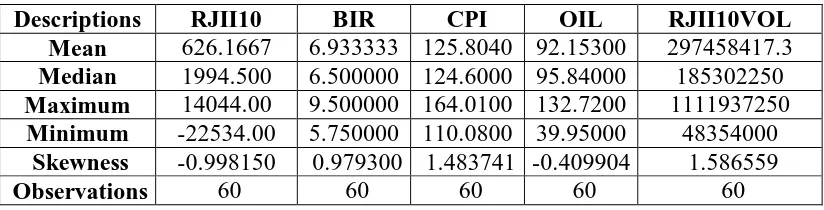
Table 6. Descriptive Statistics
Descriptions RJII10 BIR CPI OIL RJII10VOL
Mean 626.1667 6.933333 125.8040 92.15300 297458417.3 Median 1994.500 6.500000 124.6000 95.84000 185302250 Maximum 14044.00 9.500000 164.0100 132.7200 1111937250
Minimum -22534.00 5.750000 110.0800 39.95000 48354000 Skewness -0.998150 0.979300 1.483741 -0.409904 1.586559
Observations 60 60 60 60 60
Source: Data Analysis Result
Table 6 defines the descriptive statistics of all variable with regards to changes in selected macroeconomic variables and JII10 stock returns. It defines that first; Stock Returns of 10 selected JII companies (RJII10) Mean, Median, Maximum and Minimum value are 626.1667, 1994.500, 14044.00 and -22534.00 respectively. Second, Bank Indonesia Interest Rate (BIR) Mean, Median, Maximum and Minimum value are 6.933333, 6.500000, 9.500000 and 5.750000 respectively. Third, Costumer Price Index (CPI) Mean, Median, Maximum and Minimum value are 125.8040, 124.6000, 164.0100 and 110.0800 respectively. Forth, Crude Brent Oil Price (OIL) Mean, Median, Maximum and Minimum value are 92.15300, 95.84000, 132.7200 and 39.95000 respectively. Fifth, Trading Volume (VOL) Mean, Median, Maximum and Minimum value are 297.458.417,3, 185.302.250, 1.111.937.250 and 48.354.000 respectively.
The relationship to be observed between stock returns and macroeconomic variables is derived from this following equation.
Where JII10 is stock returns on 10 selected companies in Jakarta Islamic Index, CPI is costumer price index , BIR is Bank Indonesia Interest Rate, OIL is Brent Crude Oil Price, VOL is trading volume of 10 selected companies in Jakarta Islamic Index, is the intercept, are the coefficient of macroeconomic variables and is the error term.
7.7. Unit Root Test
Eviews7 is used in this study. It conducted the unit root test as the first test to build the proper econometric model for JII10 stock returns VAR forecasting. Unit root test is conducted by observing the value of Akaikie Information Criterion (AIC) and Schwarz Criterion (SC) through the Augmented Dickey-Fuller (ADF-test) in level and first difference level. ADF-test used to examine the stationary and lag length of the four variables in this study in level and first difference.
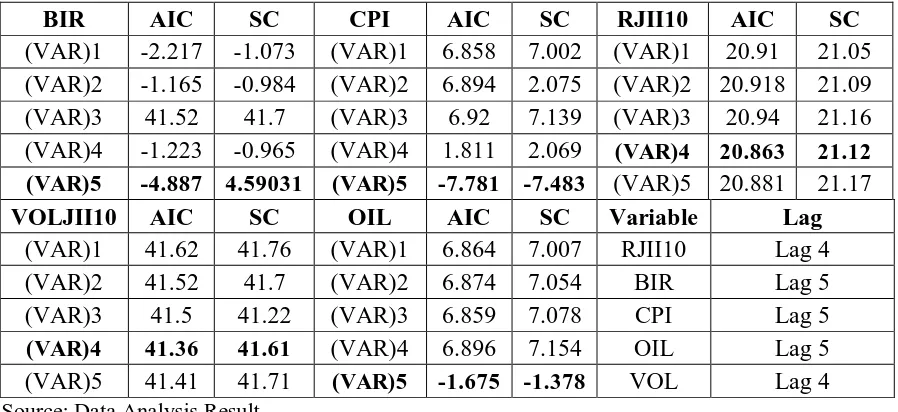
Table 7 Lag Length Determination by AIC and SC
BIR AIC SC CPI AIC SC RJII10 AIC SC
(VAR)1 -2.217 -1.073 (VAR)1 6.858 7.002 (VAR)1 20.91 21.05
(VAR)2 -1.165 -0.984 (VAR)2 6.894 2.075 (VAR)2 20.918 21.09
(VAR)3 41.52 41.7 (VAR)3 6.92 7.139 (VAR)3 20.94 21.16
(VAR)4 -1.223 -0.965 (VAR)4 1.811 2.069 (VAR)4 20.863 21.12
(VAR)5 -4.887 4.59031 (VAR)5 -7.781 -7.483 (VAR)5 20.881 21.17
VOLJII10 AIC SC OIL AIC SC Variable Lag
(VAR)1 41.62 41.76 (VAR)1 6.864 7.007 RJII10 Lag 4
(VAR)2 41.52 41.7 (VAR)2 6.874 7.054 BIR Lag 5
(VAR)3 41.5 41.22 (VAR)3 6.859 7.078 CPI Lag 5
(VAR)4 41.36 41.61 (VAR)4 6.896 7.154 OIL Lag 5
(VAR)5 41.41 41.71 (VAR)5 -1.675 -1.378 VOL Lag 4
Source: Data Analysis Result
Table 8 Automatic Eviews7 Lag Length Determination
Lag LogL LR FPE AIC SC HQ
1 139.2456 NA 5.22e-09 -4.881659 -4.699174 -4.811090
2 200.6159 109.3508 1.40e-09 -6.204216 -5.109307* -5.780806* 3 226.2982 41.09163 1.39e-09 -6.229026 -4.221693 -5.452774 4 247.1755 29.60782 1.72e-09 -6.079110 -3.159353 -4.950016 5 295.7292 60.03006* 8.20e-10* -6.935609* -3.103427 -5.453673 6 313.0389 18.25378 1.33e-09 -6.655959 -1.911353 -4.821181 Source: Data Analysis Result
Beside manual lag length determination an automatic lag length determination is used in this study. It supposed to strengthen lag length determination. Table 4.4.2 shows the result of automatic lag length determination by Eviews7. It shows that based on the value of Final prediction error (FPE) and Akaike Information Criterion (AIC) which is 12.28991099 and -6.935609 respectively. Meanwhile, Schwa rz Criterion and Hannan-Quinn Information Criterion match in lag 1 which is 5.109307 and -5.780806 respectively. Automatic Eviews7 lag length determines lag 5 as proper lag length in VAR estimation and forecast based on FPE and AIC value.
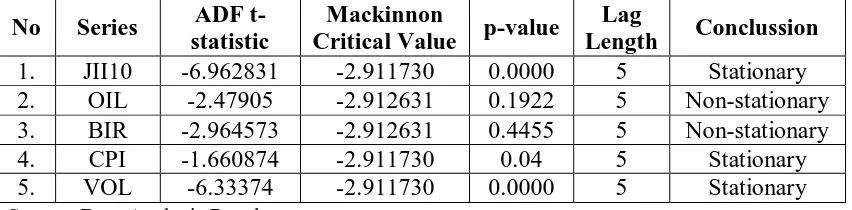
Table. 9 ADF Unit Root – Stationary Test at Level Lag 5
No Series ADF t-statistic
Mackinnon
Critical Value p-value
Lag
Length Conclussion
1. JII10 -6.962831 -2.911730 0.0000 5 Stationary
2. OIL -2.47905 -2.912631 0.1922 5 Non-stationary
3. BIR -2.964573 -2.912631 0.4455 5 Non-stationary
4. CPI -1.660874 -2.911730 0.04 5 Stationary
5. VOL -6.33374 -2.911730 0.0000 5 Stationary
Source: Data Analysis Result
Table. 9 consists the result of stationary test in determined lag 5 in “level”. It describes that Brent Crude Oil (OIL) variable had no stationary criteria because, its
p-value is higher than α = 5% or 0.05 which is 0.1922. Meanwhile, Bank Indonesia
Interest Rate also had no stationary criteria because of its p-value. BIR p-value is
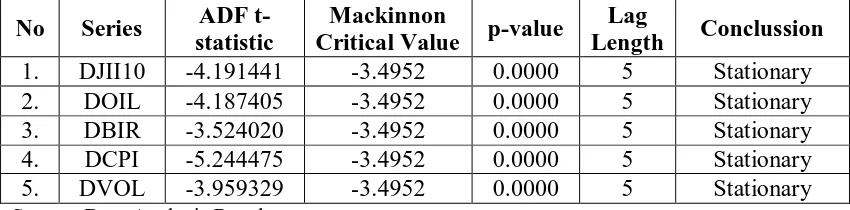
Table. 10 ADF Unit Root – Stationary Test at First Difference Lag 5
No Series ADF t-statistic
Mackinnon
Critical Value p-value
Lag
Length Conclussion
1. DJII10 -4.191441 -3.4952 0.0000 5 Stationary
2. DOIL -4.187405 -3.4952 0.0000 5 Stationary
3. DBIR -3.524020 -3.4952 0.0000 5 Stationary
4. DCPI -5.244475 -3.4952 0.0000 5 Stationary
5. DVOL -3.959329 -3.4952 0.0000 5 Stationary
Source: Data Analysis Result
Table. 10 consists of stationary test in determined lag 5 in first difference (integrated-degrees’ test). It defines that p-value of all variables passed the stationary test. All variable tested in integrated-degrees’ test. All variable p-value is 0.0000 and its lower
than α = 0.05. Therefore, Stock returns, oil price, bank Indonesia interest rate,
costumer price index and trading volume have stationary criteria.
Because the stationary test is conducted in the first difference/integrated-degrees test; therefore, the relationship to be examined among JII10 stock returns and macroeconomic variables must be conducted in VAR estimation and forecasting on their first difference. It defined in the following equation:
Where D is the first difference, JII10 is stock returns on 10 selected companies in Jakarta Islamic Index, CPI is costumer price index, BIR is Bank Indonesia Interest Rate, OIL is Brent Crude Oil Price, VOL is trading volume of 10 selected companies in Jakarta Islamic Index, is the intercept, are the coefficient of macroeconomic variables and is the error term.
7.8. Johansen - Juselius Cointegration Test
Cointegration is a combination of linear relationship from every non-stationary variable in this study. Those variables must be integrated at order or the similar degree. The integrating variables define similar stochastic trend and long-term similar movement. Johanses – Juselius test is conducted after the two previous tests and results this following table:
Table. 11 Johansen – Juselius Cointegration Test
Hypothesized
No. of CE(s) Eigenvalue Trace Statistic 0.05 Critical Value Prob.**
None * 0.728706 159.7397 88.80380 0.0000
At most 1 * 0.596298 89.29383 63.87610 0.0001
At most 2 0.297602 40.31160 42.91525 0.0890
At most 3 0.219277 21.23580 25.87211 0.1697
At most 4 0.135600 7.868891 12.51798 0.2626
Table. 12 Johansen – Juselius Cointegration Test with Maximum Eigenvalue Statistic
Hypothesized
Table. 11 and 12 display the result of Johansen – Juselius Cointegration Test based on the likelihood ratio test consists of first trace statistics and second maximum Eigen value statistics. Table. 12 shows the results of trace statistics at 5 months lag length. The above results proved that the null hypothesis of no cointegration between JII10 stock returns and selected macroeconomic variables for period 1/2008 to 12/2012 can be rejected in Indonesia Jakarta Islamic Index (JII). Trace test implies the existence of 2 cointegrating vectors among variables at the α = 0.05. To ensure the results Maximum Eigen value test is conducted. Table. 12 Confirms the existence of
cointegrating at the α = 0.05. Eventually, study proves evidence on the existence of
long term relationship between macroeconomic variables and JII10 stock returns.
7.9. Granger Causality Test
According to Hasan, Jinnah and Javed (2009), Johansen – Juselius
cointegration test doesn’t account for data structural breaks. Therefore, Granger Causality is conducted as variables are cointegrated. It supposed to observe data
causality flows’ direction.
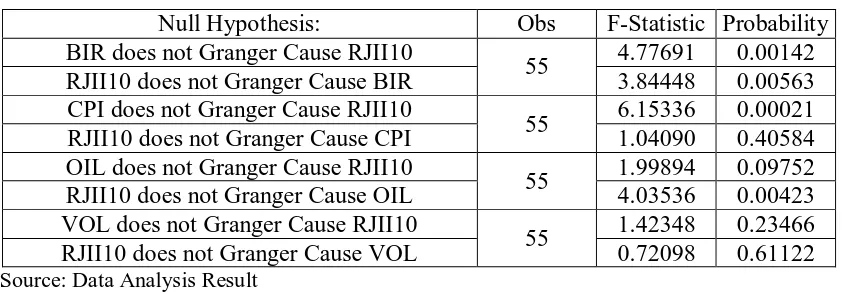
Table. 13 Granger Causality Test
Null Hypothesis: Obs F-Statistic Probability
BIR does not Granger Cause RJII10
55 4.77691 0.00142
RJII10 does not Granger Cause BIR 3.84448 0.00563
CPI does not Granger Cause RJII10
55 6.15336 0.00021
RJII10 does not Granger Cause CPI 1.04090 0.40584
OIL does not Granger Cause RJII10
55 1.99894 0.09752
RJII10 does not Granger Cause OIL 4.03536 0.00423
VOL does not Granger Cause RJII10
55 1.42348 0.23466
RJII10 does not Granger Cause VOL 0.72098 0.61122
Source: Data Analysis Result
Table. 13 proves evidence on the presence of unidirectional causality from BIR, CPI
and OIL to JII10 stock returns at α = 0.05 and bilateral causality from BIR to JII10 stock returns at α = 0.1. Furthermore no granger causality is found in trading volume (VOL) and JII10 stock returns.
lag-length relationship causing to crucial relation. Therefore investor is suggested to be more cautious in investment decision making. In addition, significant causality among Oil price and JII10 stock returns defines market movement on the basis of fundamental and real economic activity. Meanwhile the insignificant causality among Trading Volume and JII10 stock returns indicates market sentiment is not reflected from it trading volume.
7.10. Impulse Response and Variance Decomposition Analysis
After the cointegration relationship is found among dependent and independent variables. Impulse Response and Variance Decomposition Analysis is conducted. The lag order of VAR is chosen base on the value of SC, AIC and HQ. Here is the IRF and Variance Decomposition Analysis examination result:
Graph. 4 Impulse Response Result
returns is 0.000000. It become negative in the 2nd until 5th month which is -0.065953, -0.088791, -0.160523 and -0.226894 respectively. The positive response is found in the next 6th,7th and 9th month which is 0.211188, 0.101303 and 0.039193 respectively. Meanwhile in the 8th and 10th month the negative response is found in which -0.059110 and -0.019874.
The 3rd figure defines the change of RJII10 variable in response to the existence of shock variable of CPI. The response of RJII10 to CPI is relatively less volatile than the 2nd figure. The positive responses are found in the 1st, 3rd and 4th months which are 0.000000, 0.127463 and 0.387729 respectively. Meanwhile the negative responses are found in the 2nd, 5th,6th,7th ,8th ,9th and 10th months which are -0.014907, -0.412334, -0.249658, -0.129252, -0.174465, -0.108699 and -0.028179 respectively.
The 4th figure defines the change of RJII10 variable in response to the existence of shock variable of OIL. The response of RJII10 to OIL is relatively similar to the 2nd figure. The positive responses are found in the 1st, 3rd,7th, 8th and 9th months which are 0.000000, 0.110304, 0.006771, 0.065282 and 0.032304 respectively. Meanwhile the negative responses are found in 2nd,4th,5th,6th and 10th months which are 0.064028, 0.072311, 0.137933, 0.005304, 0.005304 and -0.023720 respectively.
Table. 14 Variance Decomposition Analysis Result
Variance Decomposition of DRJII10:
Period S.E. DRJII10 DBIR DCPI DOIL
1 0.567483 100.0000 0.000000 0.000000 0.000000 2 0.587904 97.49110 1.258493 0.064292 1.186114 3 0.620495 88.32009 3.177432 4.277544 4.224935 4 0.752572 60.04350 6.709687 29.45147 3.795333 5 0.906662 43.21104 10.88547 40.97413 4.929360 6 0.965285 38.42046 14.39002 42.83769 4.351827 7 0.980621 37.52232 15.01061 43.24553 4.221536 8 1.000142 36.11914 14.77967 44.61679 4.484399 9 1.007335 35.60950 14.72074 45.14633 4.523431 10 1.008287 35.55873 14.73181 45.13922 4.570235
Source: Data Analysis Result
Variance Decomposition Analysis result explains that variable DCPI is the most capable variable to influence DRJII10 rather than variable DBIR and DOIL. Altogether in the 10th month variance decomposition results are 14.73 for DBIR, 45.13 for DCPI and 4.57% for DOIL. DCPI had the largest percentage influence to DRJII10.
7.11. Vector Autoregressive VAR(5) Estimation and Model
The previous stationary test defines that all variable are stationary in the first difference. Therefore all variable are changed in to their first difference form.
Table. 15 Vector Autoregressive VAR(5) Estimation Result
DRJII10 DBIR DCPI DOIL
DRJII10(-1) -0.198222 -0.001013 -0.012244 0.032522
(0.17025) (0.00492) (0.01576) (0.02151) [-1.16431] [-0.20575] [-0.77675] [ 1.51223]***
DRJII10(-2) -0.147897 -0.005107 -0.005681 0.055130
(0.11627) (0.00336) (0.01076) (0.01469) [-1.27204] [-1.51916] [-0.52777] [ 3.75372]*
DRJII10(-3) 0.001702 0.002797 0.005101 0.042096
(0.13969) (0.00404) (0.01293) (0.01765) [ 0.01219] [ 0.69250] [ 0.39442] [ 2.38566]*
DRJII10(-4) -0.161570 -0.001522 0.015239 0.002776
(0.13666) (0.00395) (0.01265) (0.01726) [-1.18227] [-0.38520] [ 1.20440] [ 0.16079]
DRJII10(-5) -0.032813 0.003043 0.000710 0.013921
(0.13890) (0.00402) (0.01286) (0.01755) [-0.23623] [ 0.75762] [ 0.05521] [ 0.79339]
DBIR(-1) -3.805408 0.486216 -0.604481 0.606848
(5.73708) (0.16589) (0.53118) (0.72471) [-0.66330] [ 2.93092]* [-1.13799] [ 0.83737]
DBIR(-2) -4.109641 -0.308758 0.491398 0.027602
(6.39982) (0.18506) (0.59255) (0.80842) [-0.64215] [-1.66846] [ 0.82930] [ 0.03414]
DBIR(-3) -8.028628 0.414746 -0.069416 -0.717100
(6.12417) (0.17708) (0.56702) (0.77360) [-1.31097] [ 2.34207]* [-0.12242] [-0.92696]
DBIR(-4) -8.502750 -0.103764 0.190611 0.198953
(6.22269) (0.17993) (0.57615) (0.78605) [-1.36641] [-0.57668] [ 0.33084] [ 0.25311]
DBIR(-5) 9.540010 0.065867 -0.155580 0.474849
(5.54387) (0.16031) (0.51330) (0.70030) [ 1.72082]** [ 0.41088] [-0.30310] [ 0.67806]
DCPI(-1) -0.233352 -0.018810 0.641313 0.190388
(1.72886) (0.04999) (0.16007) (0.21839) [-0.13497] [-0.37627] [ 4.00641]* [ 0.87178]
DRJII10 DBIR DCPI DOIL
(2.08691) (0.06034) (0.19322) (0.26362) [ 1.22071] [ 0.59025] [ 0.32072] [ 0.78405]
DCPI(-3) 6.353452 -0.017599 0.049398 -0.116166
(2.10592) (0.06089) (0.19498) (0.26602) [ 3.01695]* [-0.28901] [ 0.25335] [-0.43668]
DCPI(-4) -11.32038 0.020869 0.081035 0.017250
(2.34312) (0.06775) (0.21694) (0.29598) [-4.83133] [ 0.30802] [ 0.37353] [ 0.05828]
DCPI(-5) -1.124576 0.017199 -0.253676 0.015951
(2.62161) (0.07581) (0.24273) (0.33116) [-0.42896] [ 0.22688] [-1.04510] [ 0.04817]
DOIL(-1) -0.912396 0.033534 -0.073877 -0.028992
(1.35610) (0.03921) (0.12556) (0.17130) [-0.67281] [ 0.85517] [-0.58839] [-0.16925]
DOIL(-2) 1.474893 -0.000903 -0.057008 0.089098
(1.36082) (0.03935) (0.12600) (0.17190) [ 1.08383] [-0.02296] [-0.45246] [ 0.51831]
DOIL(-3) -0.386569 0.051210 -0.019537 -0.178715
(1.24649) (0.03604) (0.11541) (0.15746) [-0.31013] [ 1.42079]** [-0.16928] [-1.13501]
DOIL(-4) -0.963839 0.001920 0.060531 -0.043540
(1.13060) (0.03269) (0.10468) (0.14282) [-0.85250] [ 0.05872] [ 0.57824] [-0.30486]
DOIL(-5) 0.346475 0.031954 -0.010833 0.130421
(1.13124) (0.03271) (0.10474) (0.14290) [ 0.30628] [ 0.97686] [-0.10343] [ 0.91269]
C 18.27901 -0.183035 2.017676 -1.520541
Source: Data Analysis Result
Where t-table value of 0.01 is 2.39608, t-table value of 0.05 is 2.00404, t-table value of 0.1 is 1.67303 and t-table value of 0.2 is 1.29713.
* = significant in 0.01, ** = significant in 0.1 and *** = significant in 0.2
Model1:
+ 18.27901β
Where, is JII10 Stock Returns and t is lag length.
Model.2:
Where, is Bank Indonesia Interest Rate and t is lag length.
Model 3:
Where, is Costumer Price Index and t is lag length.
Model.4
Where, is JII10 Trading Volume and t is lag length.
7.12. Summary on VAR(5) Estimation Result
confirms this study hypothesis. Similar to the interest rate the international oil price had negative influence to JII10 stock returns it is indicated by the negative coefficient in the VAR(5) estimation result -1.520541 and confirms this study hypothesis. Meanwhile, the costumer price index (CPI) had positive influence to JII10 stock returns it is indicated by the positive coefficient in the VAR(5) estimation result 2.017676 and contradicts the hypothesis of this study. This contradiction is supported by the Indonesia national economic speedy recovery after the global economic recession in 2008. The increase in CPI reflects the higher profit of JII10 companies consisting of main industry (Infrastructure, telecommunication, pharmacy and consumption). The higher price implies the higher demand of goods and services and further increase sales of JII10 companies.
7.13. Vector Autoregressive VAR(5) Forecasting
The research model of this study is used to forecast JII10 stock returns in year 2013. The Vector Autoregressive VAR is used lag 5 in the forecasting. The forecasting result is defined in the following table:
Table. 16 VAR(5) JII10 Stock Returns Forecasting Value year 2013
Forecasting VAR
Year RJII10 (IDR) FRJII10 (IDR) Year
2012.1 441 99 2013.1
2012.2 173 254 2013.2
2012.3 132 -1 2013.3
2012.4 295 175 2013.4
2012.5 113 -302 2013.5
2012.6 -11 -199 2013.6
2012.7 186 -203 2013.7
2012.8 253 -83 2013.8
2012.9 -66 -17 2013.9
2012.10 93 -90 2013.10
2012.11 192 -84 2013.11
2012.12 -174 -112 2013.12
Source: Data Analysis Result
The JII10 negative stocks returns are confirmed by the several phenomena occurred in the Indonesia stock market. In the end of May to June 2013 there is huge foreign capital outflow in Indonesia stock exchange market and the potential uncertainty after the increasing in subsidized petroleum price.
5.1 Conclusion
This study is started by descriptive statistics examination. It is followed by the Augmented Dickey Fuller - Unit Root testing and continued with the cointegration and causality testing. Furthermore, Impulse Response and Variance Decomposition Analysis are conducted. In the end, this study occupied Vector Autoregressive Model estimation and forecasting of 2013 value of JII10 stock returns.
The descriptive statistics examination defines that all variables of the study exhibit positive mean. It defines that RJII10 and Oil price is negatively skewed while BIR, CPI and Trading Volume are positively skewed. Before conducting the ADF unit root test the lag length is determined in lag 5 based on the comparison result of SIC, AIC and Automatic Eviews7 leg length determination. It is derived lag 5 as the most appropriate lag to continue this study.
The ADF test in lag 5 confirms the stationary of all variables at the first difference. The further Johansen-Juselius Cointegration test defines the long term relationship between JII10 stock returns and the selected macroeconomic variables in
95% confident level (α = 0.05). The Granger Causality test defines the causal relationship among JII10 stock returns and CPI, BIR and Oil. Meanwhile, Trading Volume is excluded from the model because it had no causal relationship. The Impulse Response and Variance Decomposition analysis defines that CPI is the most capable variable in influencing JII10 stock returns rather than BIR and Oil. CPI able to explain 45.13% of JII10 stock returns. Meanwhile BIR and Oil are capable to explain 14.73% and 4.57% of JII10 stock returns respectively.
In long term relationship the Vector Autoregressive Model Estimation concludes negative influence of Bank Indonesia Interest rate and Brent International Oil price to JII10 stock returns. Meanwhile it defines positive influence of Costumer Price Index to JII10 stock returns. It contradicts study hypothesis of negative relationship between CPI and stock returns; however, this contradiction might be caused of Indonesia national economic growth that lead to the increasing in Indonesia purchasing power. Therefore the higher price index implies the higher demand of the
10 companies’ product and so increased their sales. This increasing in sales lead to direct increasing in their profit.
speculative behavior as the determinant variable that caused into negative sentiment in JII10 2013 stock returns.
5.2. Recommendation
Regarding to the study conclusion the researcher recommends to stock market investors to be aware of the latest condition and phenomena occurred in the market. It is important to observe Bank Indonesia interest rate, costumer price index and oil price before any decision to expand investment portfolio.
The negative forecasting value of JII10 stock returns reflects the negative sentiment in the stock market. The researcher recommends long term investor to take this as a golden time to buy and collect the stocks and enrich their stock portfolio. In particular for domestic investor it becomes the rare occasion to enter and add their capacity over the foreign investor. When Indonesia stock market is dominated by domestic investor it will minimize capital outflow effect that always occurred from time to time.
The researcher recommends Bank Indonesia and Financial Services Authority (OJK) to be consistent in maintaining and produce the prudent monetary regulations in order to prevent toxic asset from financial engineering. The prudent regulation in capital market aims to protect national financial and riel economy from international negative domino effects such as exchange rate risk, market risk, default risk, arbitrage risk and hot money effect.
References:
Abu, M. F., Awang, S. A., Muhammad, F. and Hussin, M. Y. M, (2007), Macroeconomic Variables and Malaysian Islamic Stock Market: A Time Series Analysis: Journal of Business Studies Monthly, Vol. 3, No. 4, 1-13, 2012
Abu, M. F., Hussin, M. Y. M., Muhammad, F. and Razak, A. A, (2011), The Relationship Between Oil Price, Exchange Rate and Islamic Stock Market in Malaysia: Research Journal of Finance and Accounting, Vol. 3, No. 5, 83-97, 2012
Agrawal, D., Srivastava, A. and Srivastav, A. K. (2009), A Study of Exchange Rate Movement and Stock Market Volatility: International Journal of Business and Management, Vol. 5, No. 12, 62-73, 2012
Ajija, S. R and Sari, D. W., Cara Cerda s Menguasai EViews. Jakarta: Salemba Empat
Ajija, S. R, Setianto, R. H and Hudaifah, A. (2010), The Contribution of Islamic Banking And Financial Institution (IBFIs) On The Indonesian Economic Growth: The Evidence From The ARDL Bound Testing Approach 2002-2010: Forum Riset Perbankan Syariah II 2010 (FRPS II), 2010
Agrawal. G, (2010), A Study of Exchange Rates Movement and Stock Market Volatility: International Journal of Business and Management, Vol. 5, No. 12, 62-73, 2010
Al-qudah, L. A. M, (2009), The Factors that Affect Shares’ Return in Amman Stock Market: Interdisciplinary Journal of Contemporary Research in Business, Vol. 4, No. 6, 1219-1231, 2012
Ali, M. M., Shakil, A. and Khalid, M. B. (2010), Post Liberalization Impact of Macroeconomic Factors on the Stock Market Returns: Interdisciplinary Journal of Contemporary Research in Business, Vol. 1, No. 12, 63-72
Apridar., Ekonomi Internasional Seja rah, Teori, Konsep dan Perma salahan dalam Aplikasinya. Yogyakarta: Graha Ilmu, 2009, 1st Edition
Arestis, P., Demetriades, P. O and Luintel, K. B. (2001), Financial Development and Economic Growth: The Role of Stock Markets: Journal of Money, Credit, and Banking, Vol. 33, No. 1, 2001
Badan Pengawas Pasar Modal dan Lembaga Keuangan. (2008), Analisis Hubungan Kointegrasi dan Kausalitas Serta Hubungan Dinamis Anta ra Aliran Modal Asing, Perunahan Nilai Tukar Rupiah Dan Pergerakan IHSG di Pasa r Modal Indonesia: Tim Studi BAPEPAM., 2008
Market: Working Paper Series, Faculty of Economics and Business, Aagreb, 2-13, 2010
Bűyűkşιalvarcι, A. (2010), The Effects of Macroeconomics Variables on Stock Returns: Evidence from Turkey: European Journal of Social Sciences, Vol. 14, No. 3, 440-416, 2010
Burmeister, E. and McElroy, M. B. (1988), Arbitrage Pricing Theory as a Restricted Nonlinear Multivariative Regression Model: Journal of Business and Economic Statistics, Vol. 6, No. 1, 29-45, 1988
Fariz, M., Salman, K. R. and Wulandaitya, P., Bukti Empiris Pengungkapan Sukarela pada Jakarta Islamic Index (JII): Pekanbaru: Poceeding Forum Riset Perbankan Syariah, 2012
Gujarati, D. N. and Porter, D. C., Dasar-Dasar Ekonometrika. Jakarta: Salemba Empat, 2012, 1st Edition
Gűnsel, N., Tűrsoy, T. and Rjoub, H. (2005), The Effect of Macroeconomic Factors
on Stock Returns: Istanbul Stock Market: Studies in Economics and Finance, Vol. 26, No. 1, 36-45, 2009
Hamzah, M. A., Howe, L. C. and Maysami, R. C. (2004), Relationship Between Macroeconomic Va riables and Stock Market Indices: Cointegration Evidence from Stock Exchange of Singapore’s All-S Sector Indices: Jurnal Pengurusan, Vol. 24, 47-77, 2004
Hartono, J., Teori Portofolio dan Analisis Investasi. Yogyakarta: Fakultas Ekonomika dan Bisnis UGM, 2003, 3rd Edition
Hasan, A. and Javed, M. T. (2008), Macroeconomic Influences and Equity Market Returns: A Study of an Emerging Equity Market: Journal of Economics and Economics Education Research, Vol. 10, No. 2, 47-68, 2009
Huda, N. and Nasution, M. E., Investasi pada Pasa r Modal Sya riah. Jakarta: Kencana Prenada Media Group, 2007, 1st Edition
Husnan, S. and Pudjiastuti, E., Dasar-Dasar Teori Portofolio dan Analisis Sekuritas. Yogyakarta: UPP AMP YKPN, 1993, 1st Edition
Hermanto and Saptutyningsih, E., Electronic Data Processing SPSS 10.0 & EViews 3.0. Yogyakarta: UPFE UMY, 2002
Karim, A. A., Ekonomi Makro Islam. Jakarta: Raja Grafindo, 2007, 2nd Edition
Karolyi, G. A. and Gagnon, L. (2007), Information, Trading Volume, and International Stock Return Comovement Evidence from Cross-listed Stocks:
Queens’s University, Kingston, Ontario, 2007
Kurniati, Y., Sahminan, and Cadarajat, Y. (2008) Sensitivitas Komoditas Ekspor dan Impor Komoditas Utama terhadap Harga International dan Nilai Tukar Rupiah: Bank Indonesia
Kuwornu, J. K. M. (2008), Effect of Macroeconomic Variables on the Ghanaian Stock Market Returns: A Co-integration Analysis: Agris on-line Papers in Economics and Informatics, Vol. 4. No. 2, 15-26, 2012
Mankiw, N. G., Principles of Macroeconomics. Ohio: Thomson South West, 2004, 3rd edition
Nasarudin, M. I. and Surya, I., Aspek Hukum Pasar Modal Indonesia. Jakarta: Kencana
Nopirin., Ekonomi Moneter. Yogyakarta: BPFE, 3rd Edition
Novia. (2010), Faktor-Faktor Makroekonomi yang Mempengaruhi Returns on Stock di Jakarta Islamic Index (JII): Study Kasus Perusahaan Tambang Batubara: Skripsi Institut Teknologi Bogor, 2010
Ong, E., Technical Analysis for Mega Profit. Jakarta: Mega Options, 2008, 1st Edition
Sugiarto, S. D., Metode Statistika untuk Bisnis dan Ekonomi. Jakarta: Gramedia Pustaka Utama, 2006
Sukirno, S., Makroekonomi Teori Pengantar. Jakarta: Raja Grafindo Persada, 1994, 3rd Edition
Tangjitprom, N. (2012), The Review of Macroeconomic Factors and Stock Returns: International Business Research, Vol, 5, No. 8, 107-115, 2012