ISSN: 1693-6930
accredited by DGHE (DIKTI), Decree No: 51/Dikti/Kep/2010 575
Potential of Wind Speed for Wind Power Generation
In Perlis, Northern Malaysia
I. Daut, M. Irwanto*, Suwarno, Y.M. Irwan, N. Gomesh, N. S. Ahmad
School of Electrical System Engineering Universiti Malaysia Perlis (UniMAP), Malaysia
e-mail: [email protected]
Abstrak
Makalah ini menyajikan analisa karakteristik-karakteristik kecepatan angin di Perlis, Malaysia Utara untuk tahun 2006. Karakteristik-karakteristik tersebut terdiri dari kecepatan angin harian, bulanan dan tahunan. Fungsi distribusi Weibull diterapkan untuk menganalisa karakteristik-karakteristik kecepatan angin tersebut dan digunakan untuk menghitung potensi pembangkit daya angin. Potensi pembangkit daya angin diamati dan dianalisa selama 24 jam (9 Maret 2011). Hasil analisa kerapatan daya dan energy angin rata-rata bulanan menunjukan bahwa awal tahun (Januari sampai Maret) dan akhir tahun (Desember) mamiliki potensi daya dan energy angin yang tinggi, tetapi pertengahan tahun rendah, ini perlu mengembangkan sebuah pembangkit daya angin khusus yang bisa memanfaatkan ketersediaan sumber angin yang kecil di Perlis. Pengamatan selama 24 jam (9 Maret 2011), untuk sebuah pembangkit daya angin 24 V memberikan 10% dari tegangan keluaran total pembangkit.
Kata kunci: fungsi distribusi Weibull, kecepatan angin, pembangkit daya angin
Abstract
This paper presents an analysis of the wind speed characteristics in Perlis, Northern Malaysia for the year of 2006. The characteristics consist of daily, monthly and annual mean wind speed. The Weibull distribution function is applied to analyze the wind speed characteristics and used to calculate the wind power generation potential. Potential of wind power generation is observed and analyzed during 24 hours
(9th March 2011). The analysis result of monthly mean wind power and energy density show that the early
(January to march) and the end (December) of year have a high wind power and energy potential, but the middle of year they are very low, it is necessary to develop a special wind power generation capable of
harnessing the little wind resource available in Perlis. Observation during 24 hours (9th March 2011), for a
24 V wind power generation gives 10% of its total output voltage.
Keywords: weibull distribution function, wind power generation, wind speed
1. Introduction
Renewable energy has an increasing role in achieving the goals of sustainable development, energy security and environmental protection. Nowadays, it has been recognized as one of the most promising clean energy over the world because of its falling cost, while other renewable energy technologies are becoming more expensive [1], [2].
Wind energy is one of renewable energy which produced by continuously blowing wind and can be captured using wind turbines that convert kinetic energy from wind into mechanical energy and then into electrical energy [3]. Today, wind energy is widely used to produce electricity in many countries such as Denmark, Spain, Germany, United States, and India [4].
potential energy and cumulative distribution function. Wind speed and direction at 20 m and 30 m above ground level and in the Gulf of Tunis were studied by [6] during 2008. The obtained results can be used to perform wind park project and confirm that the Gulf of Tunis has promising wind energy potential. A new formulation for the turbine-site matching problem was presented by [7], based on wind speed characteristics at any site, the power performance curve parameters of any pitch-regulated wind turbine, as well as turbine size and tower height. The results revealed that higher tower heights are not always desirable for optimality. Various performance factors of a 10 kW hybrid (wind and solar) power plant, which is having 60:40 power generation share of wind power to solar power were analysed by [8]. The study shows that there is mismatch between the designed and actual plant load factor (PLF), as well as the power generation share of the wind and solar power plant. Fuzzy and neural netrwork generator speed controller is simulated by [9] using Matlab Simulink, the result shows that the both controller was successfully regulates the output power when the wind speed above the wind turbine rated and the output power can be maximum when the wind speed below the wind turbine rated.
This paper presents an analysis of the wind speed characteristics in Perlis, Northern Malaysia for the year of 2006. The characteristics consist of daily, monthly and annual mean wind speed. The Weibull distribution function is applied to analyze the wind speed characteristics and used to calculate the wind power generation potential. Potential of wind power generation is observed and analyzed during 24 hours (9th March 2011).
2. Research Method
2.1. Location and Data Collection Description of Meteorological Station
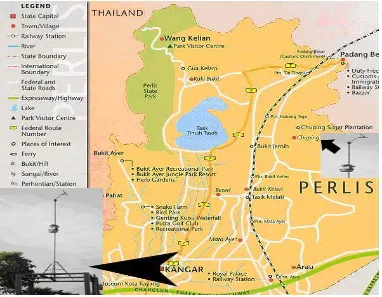
Base on Meteorological Station in Chuping Perlis, Perlis (60 29’ N , 1000 16’ E) has about 795 square kilometers land area, 0.24% of the total land area of Malaysia, with a population about 204450 people [10], as shown in Figure 1.
The data collections of wind speed are obtained from two weather stations. The first is Meteorological Station in Chuping that installed at a height of 21.7 m above ground level and records hourly wind speed, from the hourly data can be calculated the daily data and the second is Electrical Energy and Industrial Electronic System (EEIES) Cluster Station, Universiti Malaysia Perlis (UniMAP) in Kangar, Perlis, Northern Malaysia that installed at a height of 10 m above ground level and records the wind speed data every minute. Both weather stations use Vantage Weather Station Pro2.
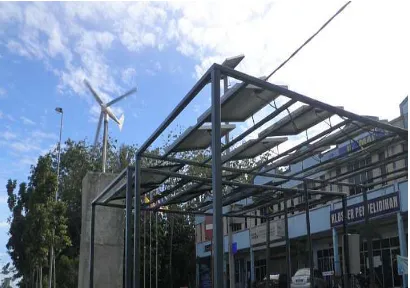
In this research, a wind power generation is installed in front of EEIES Cluster, Universiti Malaysia Perlis as shown in Figure 2. The potential of wind power generation is observed and analyzed during 24 hours (9th March 2011).
Figure 2. Wind power generation is installed in front of EEIES cluster, Universiti Malaysia Perlis
2.2. Weibull Distribution
The value of wind speed always changes every time. The observed wind speed data in a period of time can be analyzed and gives information on the percentage of time for which the speed is within a specific range. To analyze the data is usually presented in the form of frequency distribution.
There are several probability density functions, which can be used to present the wind speed frequency curve. The Weibull distribution is the most commonly used statistical distribution for representing wind speed data. This function has the advantage of making it possible to quickly determine the annual wind energy production of a given wind turbine.
In Weibull distribution, the variations in wind speed are characterized by the two functions [11]:
• The probability density function.
• The cumulative distribution function.
−
=
−k k
c
v
c
v
c
k
v
f
(
)
exp
1
(1)
where
v
is the wind speed,c
is a Weibull scale parameter andk
is a dimensionless Weibull shape parameter.The cumulative distribution function
F
(
v
)
is also called the cumulative density function or simply the distribution function, it gives the percent of time that the wind speed is equal or lower than the wind speed,v
. It is expressed by the integral of the probability density function.
−
−
=
=
∫
k v
c
v
dv
v
f
v
F
(
)
(
)
1
exp
0
(2)
In order to estimate Weibull
k
andc
parameters, numerous methods has been proposed over last few years. In this study, the two parameters of Weibull are determined usingmean wind speed,
v
and standard deviation,σ
[1],[5],[11].)
10
1
(
086 . 1≤
≤
=
−k
v
k
σ
(3)(
k
)
v
c
/
1
1
+
Γ
=
(4)where
Γ
(
1
+
1
/
k
)
is gamma fuction that relates to the scale parameter,k
.The mean wind speed (
v
) is given by∑
==
ni i
v
n
v
1
1
(5)
The standard deviation (
σ
) is given by∑
=−
−
−
=
ni
i
v
v
n
12
)
(
1
1
σ
(6)2.3. Wind Power Density
For a period of measurement the mean wind power density (the available power of wind per unit area) is given by the following expression [6]:
3
2
1
v
P
=
ρ
(7)The standard wind speed height extrapolation equation is given by [12, 13].
α
=
0
0
h
h
v
v
(8)
where
v
is the wind speed at the heighth
,v
0 is the original wind speed at the heighth
0, andα
is the friction coefficient, which depends on the surface roughness and atmospheric stability. In this study, the wind speed data was measured at the height of 21.7 m above the ground level, therefore the value ofα
can be obtained from the following expression [14].)
7
.
21
/
ln(
088
.
0
1
)
ln(
088
.
0
37
.
0
0 7 . 21
h
v
−
−
=
α
(9)The wind energy density for a period of time can be calculated as
T
P
E
=
.
(10)where
T
is the time period. For the annual wind energy density estimation the value of 8640 h is used [6], or 8760 h if 365 days in year is required.3. Results and Analysis
3.1.Daily and Monthly Wind Speed
The daily and monthly wind speeds for the year of 2006 are measured by the meoterological station in Chuping, Perlis, Northern Malaysia as shown in Figure 3. The maximum, minimum and mean daily wind speeds during the year are 2.4000 m/s, 0.3000 m/s and 1.1003 m/s. The early and the end of the year (January to March and November to December), the monthly wind speeds are high (above 1 m/s), it is effected by the northeast monsoon that has major rainy season in the country, it develops in conjunction with cold air outbreaks from Siberia that produces heavy rain and stronger wind speed. The middle of the year, their values are low (below 1m/s).
(a) Daily wind speed (b) Monthly wind speed
Figure 3. Wind speed for the year of 2006
0 50 100 150 200 250 300 350 400 0
0.5 1 1.5 2 2.5
Day of the year
W
in
d
s
p
e
e
d
(
m
/s
)
Jan Feb Mar Apr May Jun Jul Aug Sep Oct Nov Dec 0
0.2 0.4 0.6 0.8 1 1.2 1.4 1.6 1.8
W
in
d
s
p
e
e
d
(
m
/s
)
3.2. Wind Speed Distribution Function
Weibull distribution function is usually used to describe the wind speed distribution of a given location over a certain period of time. In this paper, the annual Weibull distribution function is derived from the available data and shown in Figure 4.
The result shows that on 2006 has the probability density of 81.06% with the shape parameter,
k
of 2.49, scale parameter,c
of 1.24 m/s, standard deviation,σ
of 0.4757 and its wind speed is 1.01 m/s. Based on the above analysis of the Weibull distribution function, it is necessary to develop a special wind power generation capable of harnessing the little wind resource available in Perlis. [image:6.595.96.508.226.382.2](a) Probability density (b) Cumulative probability distribution
Figure 4. Wind speed probability
3.3. Wind Power and Energy Density
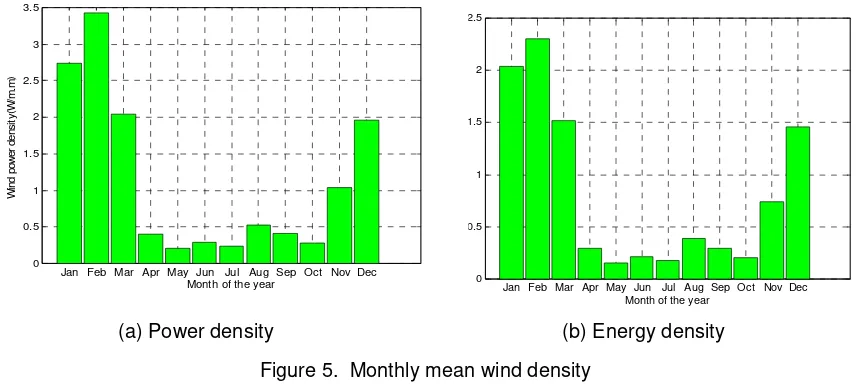
The evaluation of the wind power and energy per unit area are an importance information of wind power project assessment. During 2006, the wind speed data at 21.7 m above ground level is evaluated to obtain the monthly mean wind power and energy density as shown in Figure 5. The highest monthly mean wind power density is 3.8847 W/m2 occur in February and the lowest one is 0.2367 W/m2 occur in May. The highest monthly mean wind energy density is 2.8902 kWh/m2 occur in February and the lowest one is 0.1761 kWh/m2 occur in May.
(a) Power density (b) Energy density
Figure 5. Monthly mean wind density
0 0.5 1 1.5 2 2.5 3 3.5 4 4.5 5
0 0.1 0.2 0.3 0.4 0.5 0.6 0.7 0.8 0.9
Wind speed (m/s)
P
ro
b
a
b
ili
ty
d
e
n
s
it
y
f
u
n
c
ti
o
n
0 0.5 1 1.5 2 2.5 3 3.5 4 4.5 5
0 0.1 0.2 0.3 0.4 0.5 0.6 0.7 0.8 0.9 1
Wind speed (m/s)
C
u
m
u
la
ti
v
e
d
is
tr
ib
u
ti
o
n
f
u
n
c
ti
o
n
Jan Feb Mar Apr May Jun Jul Aug Sep Oct Nov Dec 0
0.5 1 1.5 2 2.5
W
in
d
e
n
e
rg
y
d
e
n
s
it
y
(
k
W
h
/m
.m
)
Month of the year Jan Feb Mar Apr May Jun Jul Aug Sep Oct Nov Dec
0 0.5 1 1.5 2 2.5 3 3.5
W
in
d
p
o
w
e
r
d
e
n
s
it
y
(W
/m
.m
)
[image:6.595.85.518.565.759.2]Based on Figure 5, the early (January to march) and the end (December) of year have a high wind power and energy potential, but the middle of year they are very low. The annual mean wind power and energy density are 0.8668W/m2 and 7.4893kWh/m2, respectively.
3.4. Wind Power Generation
Wind speed is observed and analyzed during 24 hours (9th March 2011) using Davis Weather Station Pro2 of EEIES Cluster Station in Kangar, Perlis, Northern Malaysia. Every minute the equipment records the wind speed as shown in Figure 6. The maximum and average wind speeds during this time are 7.61 m/s and 3.03 m/s, respectively.
[image:7.595.134.462.215.406.2]0 1 2 3 4 5 6 7 8 1 2 :0 1 A M 1 :0 2 A M 2 :0 3 A M 3 :0 4 A M 4 :0 5 A M 5 :0 6 A M 6 :0 7 A M 7 :0 8 A M 8 :0 9 A M 9 :1 0 A M 1 0 :1 1 A M 1 1 :1 2 A M 1 2 :1 3 P M 1 :1 4 P M 2 :1 5 P M 3 :1 6 P M 4 :1 7 P M 5 :1 8 P M 6 :1 9 P M 7 :2 0 P M 8 :2 1 P M 9 :2 2 P M 1 0 :2 3 P M 1 1 :2 4 P M Time W in d s p e e d ( m /s )
Figure 6. Wind speed on 9th March 2011
The wind spins blade of the wind power generation and produces direct current (DC) electricity. Open circuit output voltage of the wind power generation is measured using a DC voltage logger every minute as shown in Figure 7(a). If it is connected to a resistor of 10 ohm, therefore DC current will flow through the resistor as shown in Figure 7(b). According to the result, for a 24 V wind power generation, it gives 10% of its total output voltage.
(a) DC open circuit output voltage (b) DC current
Figure 7. Open circuit output voltage and current of the wind power generation
[image:7.595.84.514.526.715.2]4. Conclusion
Based on wind speed data for the year of 2006 has the probability density of 81.06% with the shape parameter,
k
of 2.49 and its wind speed is 1.01 m/s. Based on the above analysis of the Weibull distribution function, it is necessary to develop a special wind power generation capable of harnessing the little wind resource available in Perlis. According observation during 24 hours ((9th March 2011), for a 24 V wind power generation, the wind power gives 10% of its total output voltage.References
[1] Aynur U, Figen B. Assesment of wind power potential for turbine installation in coastal areas of
Turkey. Renewable and Sustainable Energy Reviews. 2010; 14: 1901-12.
[2] Ahmed O, Hanane D, Roberto S, Abdelaziz M. Monthly and seasonal of wind energy characteristics
at four monitored locations in Liguria region (Italy). Renewable and Sustainable Energy Reviews.
2010; 14: 1959-68.
[3] Alam HM, Manfred D. Assessment of renewable energy resources potential for electricity generation
in Bangladesh. Renewable and Sustainable Energy Reviews. 2010; 14: 2401-13.
[4] Ahmed SA. Wind energy as a potential generation source at Ras Benas, Egypt. Renewable and
Sustainable Energy Reviews. 2010; 14: 2167-73.
[5] Tian PC. Performance comparison of six numerical methods in estimating Weibull parameters for
wind energy application. Applied Energy. 2010.
[6] Dahmouni AW, Salah MB, Askri F, Kerkeni C, Nasrallah SB. Wind energy in the Gulf of Tunis,
Tunisia. Renewable and Sustainable Energy Reviews. 2010; 14: 1303-11.
[7] Albadi MH, El-Saadany EF. Optimum turbine-site matching. Energy. 2010: 1-10.
[8] Jaralikar SM, Aruna M. Case study of a hybrid (wind and solar) power plant. TELKOMNIKA
Indonesian Journal of Electrical Engineering. 2011; 9(1): 19-26.
[9] Yuhendri M, Ashari M, Purnomo MH. Maximum output power tracking of wind turbine using intelligent
control. TELKOMNIKA Indonesian Journal of Electrical Engineering. 2011; 9(2): 217-226.
[10] Daut I, Sembiring M, Irwanto M, Syafawati N, Hardi S. Solar radiation potential for photovoltaic power
generation based on meteorological data in Perlis. International Conference: Electrical Energy and
Industrial Electronic Systems EEIES2009. Penang, Malaysia. 2009; 411-4.
[11] Gokcek M, Bayulken A, bekdemir S. Investigation of wind characteristics and wind energy potential in
Kirklareli, Turky. Renewable Energy. 2007; 32: 1739-52.
[12] Gilbert MM. Renewable and efficient electric power systems. Wiley 2004: 307-85.
[13] Belu R, Koracin D. Wind characteristics and wind energy potentialin awestern Nevada. Renewable
energy. 2009; 34: 2246-51.
[14] Mostafaeipour A. Feasibility study of harnessing wind energy for turbine installation in province of