BAB IV
HASIL DAN PEMBAHASAN
4.1. Hasil
4.1.1. Hasil Pengamatan
Tabel 1. Pengamatan CVS pada Suhu Ruangan
Hari Ke
R G B
1 2 3 Rata-rata 1 2 3 Rata-rata 1 2 3 Rata-rata
0 150.401 113.53 156.153 140.028 185.261 175.789 193.091 184.71367 1.809 1.776 5.796 3.127 1 200.524 206.685 215.411 207.54 192.136 175.654 183.59 183.79333 39.541 13.79 7.182 20.171 2 231.225 243.01 238.966 237.7336667 191.772 213.458 191.867 199.03233 2.03 1.069 1.614 1.571 3 245.862 245.024 239.544 243.4766667 219.427 220.574 207.035 215.67867 24.99 9.904 17.432 17.442 4 247.715 241.199 235.381 241.4316667 218.622 207.318 189.703 205.21433 21.026 10.687 12.317 14.67667 5 205.657 179.406 213.859 199.6406667 168.353 156.386 177.009 167.24933 6.05 8.771 4.058 6.293 6 215.677 221.428 218.047 218.384 155.412 155.129 151.009 153.85 7.173 13.461 4.003 8.212333 7 232.323 202.003 206.724 213.6833333 167.4 134.89 137.735 146.675 2.004 2.411 3.681 2.698667
Tabel 2. Pengamatan CVS pada Suhu Refrigator
Har i Ke
R G B
A B C Rata-rata A B C Rata-rata A B C Rata-rata
0 185.492 188.306 199.137 190.9783333 185.649 189.17 191.016 188.61167 0.765 5.319 8.984 5.022667
1 194.955 193.09 198.73 195.5916667 165.578 179.069 174.082 172.90967 7.154 17.456 2.92 9.176667
2 204.985 192.297 214.939 204.0736667 161.062 164.003 181.764 168.943 1.543 1.325 4.094 2.320667
3 208.002 223.746 202.698 211.482 168.653 195.646 167.706 177.335 6.633 13.441 5.028 8.367333
4 196.729 225.596 232.575 218.3 181.217 194.801 200.758 192.25867 9.086 6.905 23.103 13.03133
5 220,163 231.63 238.228 234.929 160.198 166.238 189.572 172.00267 3.574 5.684 4.156 4.471333
6 195.465 203.117 204.709 201.097 137.198 153.436 153.658 148.09733 2.27 12.851 15.232 10.11767
7 164.108 191.336 205.608 187.0173333 111.881 132.284 144.512 129.559 4.787 4.318 6.084 5.063
Tabel 3. Pengamatan Color Meter pada Suhu Ruangan
Har i
L A B
1 2 3 ẋ 1 2 3 ẋ 1 2 3 ẋ
3 56.48 62 41.62 53.36667 2.335 -11.07 -3.93 -4.221667 43.47 52.39 32.62 42.82667 4 50.07 53.03 43.74 48.94667 12.55 1.02 10.25 7.94 59.87 50.33 48.17 52.79 5 40.36 35.88 53.99 43.41 9.82 9.97 7.695 9.161667 46.79 49.24 56.84 50.95667 6 34.93 31.51 37.19 34.54333 4.685 14.85 11.99 10.50833 32.45 38.01 48.45 39.63667 7 32.69 21.36 41.69 31.91333 12.25 13.32 12.17 12.58 50.72 28.86 58.12 45.9
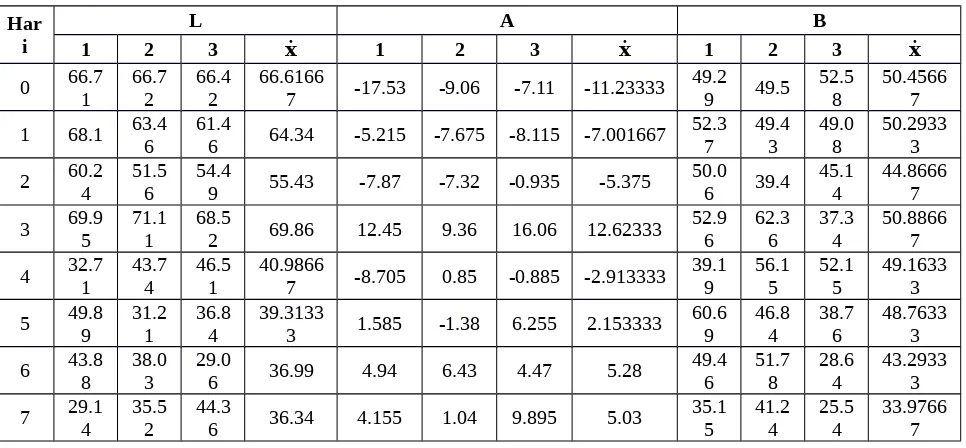
Tabel 4. Pengamatan Color Meter pada Suhu Refrigerator
Har i
L A B
1 2 3 ẋ 1 2 3 ẋ 1 2 3 ẋ
0 66.71 66.72 66.42 66.61667 -17.53 -9.06 -7.11 -11.23333 49.29 49.5 52.58 50.45667 1 68.1 63.46 61.46 64.34 -5.215 -7.675 -8.115 -7.001667 52.37 49.43 49.08 50.29333 2 60.24 51.56 54.49 55.43 -7.87 -7.32 -0.935 -5.375 50.06 39.4 45.14 44.86667 3 69.95 71.11 68.52 69.86 12.45 9.36 16.06 12.62333 52.96 62.36 37.34 50.88667 4 32.71 43.74 46.51 40.98667 -8.705 0.85 -0.885 -2.913333 39.19 56.15 52.15 49.16333 5 49.89 31.21 36.84 39.31333 1.585 -1.38 6.255 2.153333 60.69 46.84 38.76 48.76333 6 43.88 38.03 29.06 36.99 4.94 6.43 4.47 5.28 49.46 51.78 28.64 43.29333 7 29.14 35.52 44.36 36.34 4.155 1.04 9.895 5.03 35.15 41.24 25.54 33.97667
Tabel 5. Pengamatan Kadar Brix
Hari
Refrigerator
Ruang
1
2
3
ẋ
1
2
3
ẋ
0
1
9.7
9.7
9.7
9.7
12.9
12.9
12.9
12.9
2
8.6
8.6
8.3
8.5
9.5
9.4
9.4
9.4333
3
12.4
12.1
12.4
12.3
13.7
13.7
13.7
13.7
4
14.2
14.2
14.3
14.233
14.8
14
14.9
14.567
5
8.4
8.7
8.8
8.6333
7.7
8.1
8.4
8.0667
6
14
13.7
13.5
13.733
13.6
13.5
13.5
13.533
7
13.3
12.6
14.5
13.467
14.1
13.7
12.6
13.467
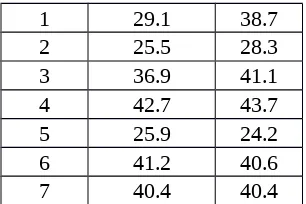
Tabel 6. Pengamatan Kadar Brix Setelah Faktor Pengenceran
Hari
Refrigerat
or
Ruang
1
29.1
38.7
2
25.5
28.3
3
36.9
41.1
4
42.7
43.7
5
25.9
24.2
6
41.2
40.6
7
40.4
40.4
Tabel 8. Penampakan Kadar Buah
Har
i
Suhu Refrigerator
Suhu Ruang
Warna
Kesegaran
Kondisi
Kulit
Warna
Kesegaran
Kondis
i Kulit
0
Kuning
kehijauan
*****
Halus
Hijau
kekuninga
n
*****
Halus
1
Kuning
Kehijauan
****
Halus
Kuning
Kehijauan
****
Mulai
Keriput
2
Kuning
kehijauan
****
Halus
Kuning
****
Mulai
Keriput
3
Kuning
Kehijauan
****
Mulai
Keriput
Kuning
****
Mulai
Keriput
4
Kuning
Kehijauan
****
Mulai
Keriput
Kuning
****
Keriput
5
Kuning
Kehijauan
***
Mulai
Keriput
Kuning
**
Keriput
berlebih
6
Kuning
hijau
kecoklata
n
***
Keriput
Kuning
hitam
**
berlebih
Keriput
7
Kuning
hijau
kecoklata
***
Keriput
Kuning
hitam
**
Keriput
n
4.1.2. Analisa Data
Tabel 7. Brix Prediksi
Hari RGBref ruangRGB LABref ruangLAB 1 35.604 37.907 27.605 37.082 2 24.152 28.649 30.386 32.199 3 33.747 42.203 35.721 37.278 4 39.266 42.385 33.557 37.133 5 28.705 25.24 36.229 35.043 6 43.231 43.563 38.597 44.154 7 37.514 37.89 39.486 34.297
Gambar 4.17. Hubungan antara nilai R vs hari pada berbagai suhu
Gambar 4.19. Hubungan antara nilai B vs hari pada berbagai suhu
Gambar 4.20. Hubungan antara nilai L vs hari pada berbagai suhu
Gambar 4.22. Hubungan antara nilai b vs hari pada berbagai suhu
20 25 30 35 40 45 0 5 10 15 20 25 30 35 40 45 50
f(x) = 0.94x + 2.31 R² = 0.94f(x) = 0.74x + 8.92
R² = 0.74
Suhu Refrigerator Linear (Suhu Refrigera-tor)
Suhu Ruangan Linear (Suhu Ruangan)
Brix Observasi Br ix P re di ks i
Gambar 4.23. Hubungan antara Brix Prediksi vs Brix Observasi pada RGB
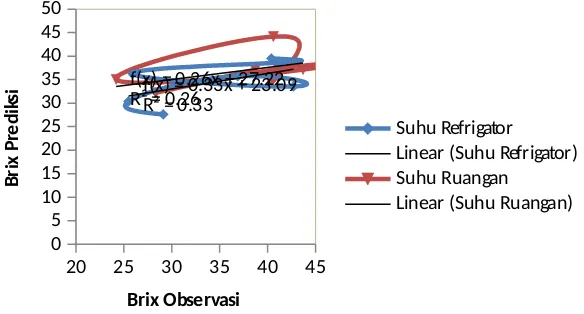
20 25 30 35 40 45 0 5 10 15 20 25 30 35 40 45 50
f(x) = 0.26x + 27.22 R² = 0.26f(x) = 0.33x + 23.09R² = 0.33
Suhu Refrigator Linear (Suhu Refrigator) Suhu Ruangan
Linear (Suhu Ruangan)
Brix Observasi Br ix P re di ks i
0 1 2 3 4 5 6 7 8 0 5 10 15 20 25 30 35 40 45 50 Brix Refrigerator Brix Ruangan Hari Br ix
Gambar 4.25. Hubungan antara Brix Observasi vs Hari
Tabel Output:
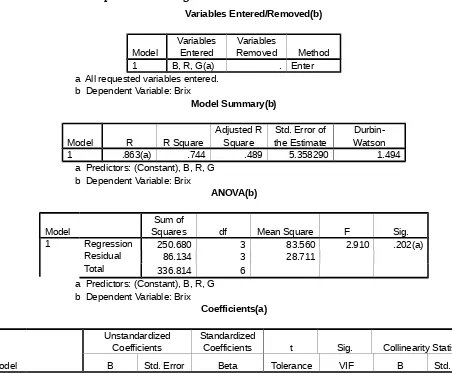
1. RGB pada suhu refrigerator
Variables Entered/Removed(b) Model Variables Entered Variables Removed Method
1 B, R, G(a) . Enter
a All requested variables entered. b Dependent Variable: Brix
Model Summary(b)
Model R R Square
Adjusted R Square
Std. Error of the Estimate
Durbin-Watson
1 .863(a) .744 .489 5.358290 1.494
a Predictors: (Constant), B, R, G b Dependent Variable: Brix
ANOVA(b)
Model
Sum of
Squares df Mean Square F Sig.
1 Regression 250.680 3 83.560 2.910 .202(a)
Residual 86.134 3 28.711
Total 336.814 6
a Predictors: (Constant), B, R, G b Dependent Variable: Brix
Coefficients(a)
Model
Unstandardized Coefficients
Standardized
Coefficients t Sig. Collinearity Statistics
1 (Constant) 50.004 29.187 1.713 .185
R .041 .190 .086 .215 .844 .531 1.882
G -.228 .157 -.629 -1.453 .242 .455 2.198
B 1.853 .667 .920 2.777 .069 .777 1.287
a Dependent Variable: Brix
2. RGB pada suhu ruangan
Variables Entered/Removed(b)
Model
Variables Entered
Variables
Removed Method
1 B, R, G(a) . Enter
a All requested variables entered. b Dependent Variable: Brix
Model Summary(b)
Model R R Square
Adjusted R Square
Std. Error of the Estimate
Durbin-Watson
1 .969(a) .940 .880 2.566284 2.375
a Predictors: (Constant), B, R, G b Dependent Variable: Brix
ANOVA(b)
Model
Sum of
Squares df Mean Square F Sig.
1 Regression 308.311 3 102.770 15.605 .025(a)
Residual 19.757 3 6.586
Total 328.069 6
a Predictors: (Constant), B, R, G b Dependent Variable: Brix
Coefficients(a)
Model
Unstandardized Coefficients
Standardized
Coefficients t Sig. Collinearity Statistics
B Std. Error Beta Tolerance VIF B Std. Error
1 (Constant) -25.962 14.317 -1.813 .167
R .570 .102 1.359 5.606 .011 .341 2.929
G -.415 .078 -1.489 -5.340 .013 .258 3.876
B 1.083 .184 1.073 5.882 .010 .604 1.657
a Dependent Variable: Brix
3. LAB pada suhu refrigerator
Model
Variables Entered
Variables
Removed Method
1 B, A, L(a) . Enter
a All requested variables entered. b Dependent Variable: Brix
Model Summary(b)
Model R R Square
Adjusted R Square
Std. Error of the Estimate
Durbin-Watson
1 .575(a) .331 -.338 8.667814 3.062
a Predictors: (Constant), B, A, L b Dependent Variable: Brix
ANOVA(b)
Model
Sum of
Squares df Mean Square F Sig.
1 Regression 111.421 3 37.140 .494 .711(a)
Residual 225.393 3 75.131
Total 336.814 6
a Predictors: (Constant), B, A, L b Dependent Variable: Brix
Coefficients(a)
Model
Unstandardized Coefficients
Standardized
Coefficients t Sig. Collinearity Statistics
B Std. Error Beta Tolerance VIF B Std. Error
1 (Constant) 46.555 28.357 1.642 .199
L -.169 .314 -.316 -.538 .628 .649 1.541
A .464 .519 .430 .895 .437 .964 1.038
B -.096 .747 -.076 -.128 .906 .633 1.581
a Dependent Variable: Brix
4. LAB pada suhu ruangan
Variables Entered/Removed(b)
Model
Variables Entered
Variables
Removed Method
1 B, A, L(a) . Enter
a All requested variables entered. b Dependent Variable: Brix
Model R R Square
Adjusted R Square
Std. Error of the Estimate
Durbin-Watson
1 .509(a) .259 -.481 8.999679 2.251
a Predictors: (Constant), B, A, L b Dependent Variable: Brix
ANOVA(b)
Model
Sum of
Squares df Mean Square F Sig.
1 Regression 85.086 3 28.362 .350 .794(a)
Residual 242.983 3 80.994
Total 328.069 6
a Predictors: (Constant), B, A, L b Dependent Variable: Brix
Coefficients(a)
Model
Unstandardized Coefficients
Standardized
Coefficients t Sig. Collinearity Statistics
B Std. Error Beta Tolerance VIF B Std. Error
1 (Constant) 44.280 36.023 1.229 .307
L 1.307 1.610 2.249 .812 .476 .032 31.114
A 1.787 2.116 1.954 .845 .460 .046 21.681
B -1.616 1.700 -1.174 -.951 .412 .162 6.174
a Dependent Variable: Brix
Contoh Perhitungan:
Hari ke -1 pada suhu Refrigerator
1. RGB
FP
=
1
+
Vol . air
(
mL
)
berat buah
(
gr
)
=
1
+
200
100
=
1
+
2
=
3
Kadar Brix
=´
x Nilai Terbaca x FP
(
Faktor Pengenceran
)
=
9,7
x
3
=
29,1
y
=
β
0+
β
1x
1+
β
2x
2+
β
3x
3=
50,004
+(
0,041
x
195,5916667
)+ (−
0,228
x
172,90967
)+ (
1,853
x
9,176667
)=
35,604
2. LAB
FP
=
1
+
Vol . air
(
mL
)
berat buah
(
gr
)
=
1
+
200
100
=
1
+
2
=
3
Kadar Brix
=´
x Nilai Terbaca x FP
(
Faktor Pengenceran
)=
9,7
x
3
=
29,1
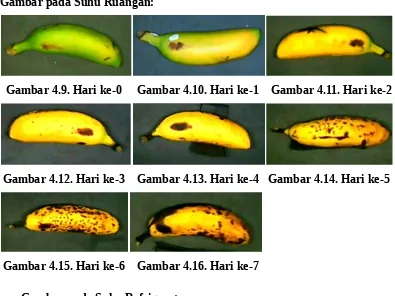
Gambar pada Suhu Ruangan:
Gambar 4.9. Hari ke-0 Gambar 4.10. Hari ke-1 Gambar 4.11. Hari ke-2
Gambar 4.12. Hari ke-3 Gambar 4.13. Hari ke-4 Gambar 4.14. Hari ke-5
Gambar 4.15. Hari ke-6 Gambar 4.16. Hari ke-7
Gambar pada Suhu Refrigerator:
Gambar 4.1. Hari ke-0 Gambar 4.2. Hari ke-1 Gambar 4.3. Hari ke-2