Reviewers:
Kudang Boro Seminar
Edi Abdurachman
Bambang Pramudya
Setyo Pertiwi
Agus Buono
Seishi Ninomiya
Ye-Nu Wan
Kazuhiro Nakano
Byong Lyol Lee
Teruaki Nanseki
Adinarayana J.
Michael Riggs
Xinwen Yu
Copyright © 2010
Editors:
I Wayan Astika
Rizky Mulya Sampurno
Agus Ghautsun Ni
’
am
Indra Febrian Buntuan
Layouting:
Priyo Puji Nugroho
Rizky Mulya Sampurno
Published by :
AFITA (Asian Federation for Information Technology in Agriculture)
ISAI (Indonesian Society of Agriculture Informatics)
Bogor Agriculture University, West Java-Indonesia
Phone/fax: +62 251 8623936, Email: [email protected]
Website: http://afita2010.ipb.ac.id/
ISBN: 978-979-493-277-3
Proceedings of
AFITA 2010 International Conference
The role of communication and information technology (ICT) is becoming more and
more crucial for agriculture to enable the best managerial and operational scenarios. This
conference is aimed to seek excellent or promising ICT-based solutions for improving
agricultural-based production systems and commerce. For the purpose, as those written in
the first announcements of the AFITA 2010 Conference, the committee invited
contributing papers under several topics related to the applications of ICT in agriculture.
It is a great pleasure for me to announce that the committee has received plenty of
papers under the topics offered. But, due to the unbalance number of papers within each
topic, the grouping were rearranged, and finally ended up with the following topic
groups: 1) Rural Economies and ICT Policies for Rural Development (5 papers) 2)
Knowledge Repositories (4 papers), 3) Remote Sensing and GIS Applications For
Agriculture and Precision Farming (7 papers), 4) E-Agricultural Services and Business
(11 papers), 5) Decision Support Systems for Agriculture and Agribusiness (9 papers), 6)
Computer Based Data Acquisition and Control in Agriculture (7 papers), and 7)
Modeling and Simulation (9 papers).
Besides the technical papers above, this proceedings also compiles invited papers and
workshop materials discussed in the conference. Several posters without papers are also
displayed in the seminar venue making the conference becoming more eventful.
I would like to express my sincere gratitude and thanks to all parties that make this
conference possible. May our efforts will give a valuable contribution to the development
of agricultural sector and to the development science as well.
Contents
Forewords …... i
Contents ………..………. ii
Invited Speaker
Needs of Quality Information in Sustainable Agro-ecosystem Services……….. 2
Counterknowledge in Agriculture Policy Process……… 7
Workshop: ICT Adoption in Agriculture and Agribusiness
Indonesian E-Agriculture Strategic Framework: A Direction of ICT Usage as Enabler in Agriculture ……. 11 The CIARD RING as a Support Tool for Building Integrated Information Systems ……… 18 Rural Economies and ICT Policies for Rural Development
Using the Sustainable Livelihoods Framework to Analyze ICT Applications for Promotion of
Agricultural Livelihoods of Rural Community in China ………. 25
Benefits of Integrated ICT Systems for Farmers, Advisors and Vertical and Horizontal Chain Partners ….. 33 Advanced Application of ICT to The Sustainable Production of Excellent Japanese Mandarin ………….. 39 Sustainability of ICT Design Interventions in Agriculture with Poor – The Challenges and Ways Forward . 46 Role of ICT in Agricultural Sector: A Study of Progressive Farmers, Malwa Region, Punjab ………. 47 Development of an Online Agricultural ICT Literacy Test System for Korean Farmers ……… 54 Knowledge Repositories
Collecting Japanese Terms used in Agricultural Programs ……… 60
Analyzing a Text on Agricultural Issues Using Knowledge Graph ……….. 64 Collaborative Construction and Sharing of Chinese Agricultural and Standard Scitech Data Platform …… 65 An Approach to Extraction of Synonymous Relationships Using Japanese - English
Bilingual Titles of Agricultural Academic Papers ………. 66
Analysis of Interdisciplinarity Collaboration on Agricultural Researcher: Case Study on Indonesian
Agency for Agricultural Research and Development (IAARD) ………. 70
PhilAgriNet: The Missing Link Between Philippine Agricultural Knowledge and Researchers …………. 77 Remote Sensing and GIS Applications For Agriculture and PrecisionFarming
Introducing Software Product Line Development for Wireless Sensor Network
Based Agriculture Applications ……….………… 83
The Use of Low-cost Webcams for Field Monitoring in Agricultural Farm ………... 89 Development of Variable Rate Fertilizer Applicator Module Based on 8-bit Embedded System …………. 93 A Neural Network Architecture for Statis tical Downscaling Technique:
Case Study in Indramayu Districts……… 99
The Use of Hand Phone Camera to Determine Leaf Color Level of Paddy as a Reference for
Fertilizing Dosage ……… 105
ii
Weeds and Plants Recognition using Fuzzy Clustering and Fractal Dimension Methods for
Automatic Weed Control ... 109
Data Collecting in the Paddy Fields with GPS Receiver……….. 113
Analysis of Environment and Physiological Data of Citrus Orchards by Using Field Server………. 114
Rice Management Indexes Study Using WMSN ………. 120
E-Agricultural Services and Business A Conceptual Framework for Developing a Deep Web Service ………. 122
Independence in Evaluating Web-Sites Within Ministrial Agriculture……… 127
E-Governance in Indonesia‟s Agricultural Development: an Analysis of Indonesia‟s Government Websites in Providing Agriculture Services………. 135
Determining the Quality Factors of The Web Portal of an Agriculture Educational Institute in Iran ………. 136
Advocacy of positive environmental assessment using soil microbial diversity and its vitality value - As an index for environmental preservation effects in environmental accounting ………. 137
The Sustainable Web Portal for Observation Data ……….. 141
Roles of Information Technologies for Small-scale Furniture Businesses ………. 146
How Does Marketing Portal Work for Small-scale Furniture Producers? ……….. 156
Expanding Farm Business through Popular Social Network Site……… 164
Information Communication and Technologies in Agriculture Extension Services – A Boon or Bane: Experiences from Applications of „Lifelines‟ in Mewat Region of India ... 169
ICT Mediated Agricultural Extension in Asia: Innovations and Lessons ... 170
Agricultural Video Portal as the Tools for Dissemination, Extension and Share Agricultural Technology . 180 Implementation in the Philippines of an Agricultural Expert System Framework in Thailand ... 186
The Use of Web Blog to Support Exchange of Information Technology and Marketing for Mangosteen Farmers in Singaparna District, Tasikmalaya Regency ... 192
Decision Support Systems for Agriculture and Agribusiness Predicting Tool for Rice Cultivation Possibility using SIMRIW ... 199
Development of Decision Support Systems for Agricultural Management: An overview in Japan ... 205
Management Information System for Watershed Development Programmes in India ... 211
Development of Computer Program for Designing of Transportation Packaging for Agricultural Products 218
Prediction of Stock and Price of Local Fruits in Jakarta with ANFIS (Adaptive Neuro Fuzzy System Inference) ... 224
Development of Multiobjective Genetic Algorithms for Agri-food Supply Chain Design by Considering Global Climate Change ... 230
Framework of Intelligent Decision Support System for Agro-Industrial Supply Chain Management ... 236
Decision Support System of Small Scale Potato Agroindustry... 242
Design and Implementation GA-Fuzzy for Land Suitability Evaluation ... 246
A Geographic Information Systems-Based Decision Support System for Solid Waste Recovery and
Utilization in Tuguegarao City, Cagayan, Philippines ... 253
Computer Based Data Acquisition and Control in Agriculture Nondestructive Detection of Internal Insect Infestation in Jujubes Using Visible and Near-Infrared Spectroscopy ... 255
Critical Information Design for House Broilers ... 266
The Development of Automatic Coffee Sorting System Based on Image Processing and Artificial Neural Network ... 272
Development of Nondestructive Detection Algorithm for Internal Defects of Japanese Radish ... 276
A Hidden Markov Model for Starfruit Sugariness Recognition ... 280
Determination of Moisture Content in Mangosteen Pericarp Using Near Infrared (NIR) Spectroscopy ... 281
Real-Time Solution Quality Control System based on Photonic Crystal Sensor ... 282
Water heat pump system in greenhouse by using underground water for snow melting ... 292
The Design of Wireless and Distributed Temperature Monitoring System for “Tungku Gama” Grain Dryer ... 299
Determination of Cocoa Bean Quality with Image Processing and Artificial Neural Network ... 300
Modelling and Simulation Shape and Vein Extraction on Plant Leaf Images Using Fourier and B-Spline Modeling ... 306
An UML Modeling for the Optimization of Supply Chain in Palm Oil Based Bioenergy ... 311
Heuristic Optimization Recurrent Neural Network Model to Predict Rain Fall Based on El-Nino Southern Oscilation ( ENSO ) Variable ... 316
Simulating Bioethanol Production from Sago Palm Cultivated on Peatland of West Kalimantan, Indonesia ... 322
The Allometric Model of Sago Palm Above Ground Drymatter Partitioning in Relation to Phenological Stages ... 326
Extended Enterprise Resources Planning (ERP) for CPO Industry ... 330
Water Resources Assessment for City Area ... 336
Sampling Frame of Square Segments for Rice Pruduction Estimate and Forecast ... 339
Assessment of Agricultural Production in Dry Season in Nganjuk District, East Java, Indonesia ... 345
Poster Paper Enhanced Access to the CGIAR Virtual Library via Social Media ... 351
Determining Suitable Area for Dairy Farm Using Model Builder ... 354
Identification of Potential Area for Paddy Field to Increase Rice Production Using Model Builder and Its Publication on The Internet: Case of Lombok Island, West Nusa Tenggara, Indonesia ... 357
The Model Builder for City Park Using ArcGis ... 362
Application HEC-HMS to Predict Hydrograph ... 372
iv
Weeds and Plants Recognition
using Fuzzy Clustering and Fractal Dimension Methods
for Automatic Weed Control
Mohamad Solahudin
Department of Agricultural Engineering Bogor Agricultural University
Bogor, Indonesia e-mail: [email protected]
I Wayan Astika
Department of Agricultural Engineering Bogor Agricultural University
Bogor, Indonesia
e-mail: [email protected]
Kudang Boro Seminar
Department of Agricultural EngineeringBogor Agricultural University Bogor, Indonesia e-mail: [email protected]
Agus Buono
Department of Computer Science Bogor Agricultural University
Bogor, Indonesia e-mail: [email protected]
Abstract — Destructive impacts of herbicide usage on environment and water contamination have led researcher orientation toward finding solutions for their accurate use. If density and weeds species could be correctly detected, patch spraying or spot spraying can effectively reduce herbicide usage. A machine vision with precise automatic weed control system could also reduce the usage of chemicals. Machine vision is a useful method for segmentation of different objects in agricultural applications, especially pattern recognition methods. Many indices have been investigated by researchers to perform weed segmentation based on color information of the images. The purpose of this research is to develop machine vision system that can detect weeds density and variability. In this study the relation between three main color components (red, green & blue) of the images and color feature extraction (hue, saturation, intensity) were used to define weeds density. Fractal dimension was used as the method to define shape features to distinguish different type of weeds and plants. Weeds and plants were segmented from background by obtaining hue value and its shape was obtained by fractal dimension value. The results showed that fractal dimension value for each plant species has specific differences. Corn plants have fractal dimension values in the range 1.148 to 1.268, peanut plants have fractal dimension values in the range 1.511 to 1.629, while the weeds have fractal dimension values in the range 1.325 to 1.497.
Keywords : Image processing, machine vision, weed control, fractal dimension, fuzzy clustering
I. INTRODUCTION
Weeds can cause various kinds of losses. In agriculture, weeds can reduce crops yield. Stunted plant growth, which will cause the decline. The amount of yield reduction depends on plant varieties, soil fertility, weed type and density, the duration of the competition and culture of action. Indonesia's decline in plant yield due to weeds is estimated at 10-20% (Dwiguntoro, 2008). Weeds can also reduce the quality of agricultural products due contamination of weed seeds to the crop during harvest time and during product processing.
Weeds have a common characteristic that distinguishes the plant cultivation, among others: a high adaptation to the environment, the high number of seeds produced, high competitiveness, long time seed dormancy, ability to survive in circumstances that are not favourable to grow, capable of propagate vegetatively besides generative breeding.
Under the common response to the herbicide, weed is divided into three categories namely weed grasses, broad-leaved weeds (broad leave), and weeds puzzles (sedges).
In order to determine the choice of an appropriate method for controlling weeds, it is needed to analyze vegetation weeds first. Weed vegetation analysis and identification done before control measures are selected and implemented. Lack of precision in the analysis of weed control can lead to ineffective and inefficient, excessive use of cost, time and energy.
The purpose of this research is to build machine vision system that can detect weeds density and variability using fuzzy clustering and fractal dimension methods.
II. MATERIALS AND METHODS
Weed and crop images were obtained from two principal locations, Leuwikopo Research Field of Bogor Agricultural University and from farmers fields surrounding the campus. The selected crops were sweet corn at the age of 9 days and 23 days, and 23 days old peanut, while the types of weeds were grass and the other weeds having similar shape with the main crops. The selection of plants were done randomly in the fields, and done on a sunny day conditions
A. Image Capturing and Processing
Image capturing and processing were due with the following steps :
1.Determination of image capturing area
Image size used was (640x480 dpi with a file size of 0.3 MB.
2.Field conditions data acquisition were selected those depicting the diversity of weed attacks.
3.Image processing.
Weed Image was analyzed with digital image processing to obtain the value of image parameters such as RGB and HSI. Image processing is done in two levels : 1) single-image analysis and 2) image cut into four pieces with the same size of 320x240 dpi.
4.Analysis of weed attack distribution
The analysis used fuzzy clustering technique.
B. Fuzzy clustering
Clustering is a way to analyze data by grouping the objects into groups based on a certain similarity. Clustering can also be interpreted as a process to define the mapping of some data D = (t1, t2, ... ... tn) into several clusters C = (c1, c2, ...., Cn) on the basis of similarity between data. A cluster is a collection of objects grouped together because of similarities or proximity. Clustering commonly used in many fields, such as: data mining, pattern recognition, image classification, and various other purposes.
Cluster analysis is a multivariate analysis technique (many variables) to find and organize information about variables so that a relative can be grouped in a homogeneous form in a cluster. In general, can be regarded as the process of analyzing whether or not a process of cluster formation. Cluster analysis can be obtained from the density of clusters formed (cluster density). The density of a cluster can be determined by variety in the cluster (Vw) and variety of inter-cluster (Vb).
Variants of each stage of cluster formation is calculated using the formula:
Vc2 = variant of cluster c
c = 1 .. k, where k = number of clusters nc = number of data in cluster c
yi = ith data in a cluster
y
= the average of the data in a clusterValue diversity in the cluster (Vw) is calculated with the formula
Value diversity in the cluster (Vw) is calculated with the formula :
N = number of all data ni = number of data clusters i Vi = A variant of cluster i
The value range of inter-cluster (Vb) was calculated by using the formula:
C. Fractal Dimension Analysis
Fractal shapes can generally be attributed to characteristics known as the fractal dimension. Fractal dimension analysis conducted by the fragmentation of the image that has been filtered into rectangular shapes measuring s. Furthermore, calculated the number of squares N (s) containing the color white (the result of filtering plants). This calculation is repeated with a share value of s. Fragmentation in this study conducted with the value s = 5 to 40 with intervals of s = 5 pixels. The next step is to plot the value of log N (s) to the value of log (1 / s) and determine the form of a linear regression equation y = ax + b. Fractal dimensions is a value on the linear regression equation.
III. RESULTS AND DISCUSSIONS
A. Image Processing
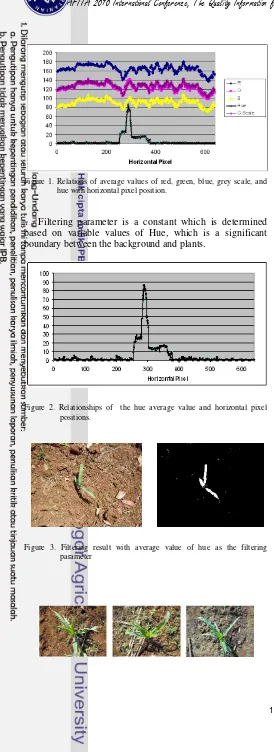
Images that has been taken were analyzed to determine the colors components. Image shooting with 640 x 480 size is processed to obtain average values of red, green, blue, greyscale, and hue. Based on the color components parameters of filtering were determinated to separate background image with plant image. Determination of parameter values is done by plotting average value of red, green, blue, greyscale, and hue in a graph. Based on the parameters were then selected base on the change of pattern significantly in the plant's position.
110
Figure 1. Relations of average values of red, green, blue, grey scale, and hue with horizontal pixel position.
Filtering parameter is a constant which is determined based on variable values of Hue, which is a significant boundary between the background and plants.
Figure 2. Relationships of the hue average value and horizontal pixel positions.
Figure 3. Filtering result with average value of hue as the filtering parameter
a) Corn
b) Peanut
b) Weed
Figure 4. Results of filtering on various types of plants
B. Weed Density Analysis
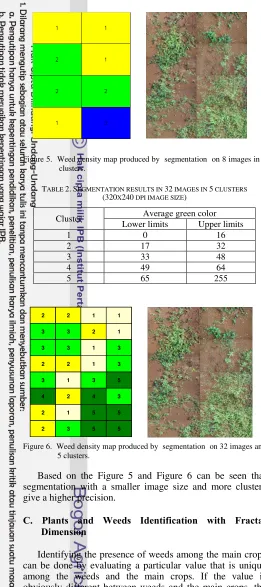
Weed density sample were represented by 8 images showing the diversity of weed density is shown in Figure 5.. Image capturing aimed at determining the density cluster based on the average green color value.
TABLE 1.FUZZY CLUSTERING RESULT FOR 8 IMAGES INTO 3 CLUSTERS
(640X480 DPI IMAGE SIZE)
Figure 5. Weed density map produced by segmentation on 8 images in 3 clusters.
TABLE 2.SEGMENTATION RESULTS IN 32 IMAGES IN 5 CLUSTERS
(320X240 DPI IMAGE SIZE)
Cluster Average green color Lower limits Upper limits
1 0 16
2 17 32
3 33 48
4 49 64
5 65 255
Figure 6. Weed density map produced by segmentation on 32 images and 5 clusters.
Based on the Figure 5 and Figure 6 can be seen that segmentation with a smaller image size and more clusters give a higher precision.
C. Plants and Weeds Identification with Fractal Dimension
Identifying the presence of weeds among the main crops can be done by evaluating a particular value that is unique among the weeds and the main crops. If the value is obviously different between weeds and the main crops, the typical value can be used as a reference for identification.
From the sample of corn and peanut crops fractal dimension method is able to identify the presence of weeds on the field. It can be seen from the range of values obtained fractal dimension.
TABLE 3.FRACTAL DIMENSION OF VARIOUS TYPES OF PLANT AND WEED Sample Type of crops Fractal dimension
1 peanut 1.616 2 peanut 1.543 3 peanut 1.511 4 peanut 1.541 5 peanut 1.629 6 peanut 1.617 7 corn 1.268 8 corn 1.148 9 corn 1.261 10 corn 1.190 11 weed 1.497 12 weed 1.325 13 weed 1.369
Fractal dimension analysis results showed that each plant has a typical value of fractal dimension. Corn of 23 days age have fractal dimension value on the range 1.148 to 1.268, the 23 days peanut have fractal dimension value on the range 1.511 to 1.629, while weeds fractal dimension value on the range 1.325 to 1.497.
IV. CONCLUSIONS AND SUGGESTIONS
Fuzzy clustering were able to identify the weed density. Furthermore segmentation with a smaller image size and higher number of cluster produce a more accurate weed density maps.
Fractal dimension can distinguish the type of plant and weed. Corn plants have fractal dimension values in the range 1.148 to 1.268, peanut plants have fractal dimension values in the range 1.511 to 1.629, while the Weeds have fractal dimension values in the range 1325 to 1497.
REFERENCES .
[1] Dwiguntoro, 2008. Sekilas Tentang Gulma.
http://dwiguntoro.wordpress.com/2008/11/30/ Sekilas Tentang Gulma.html
[2] Lauwerier H. 1991. Fractals, Endlessly Repeated Geometrical Figures. Princeton University Press, Princeton-New Jersey. [3] Ming W.H., C.J. Hou. 2004. Cluster analysis and visualization,
Workshop on Statistics and Machine Learning, Institute of Statistical Science, Academia Sinica
[4] Steward B. L.and Tian L. F. 1996. Real Time Machine Vision Weed-Sensing. Department of Agricultural Engineering. University of Illinois at Urbana-Champaign USA.
[5] Tangkowit, R., V. Salokhe, H. Jayasuria. 2006. Development of Tractor Mounted Real-time Variable Rate Herbicide Applicator for Sugarcane Planting. Agricultural Engineering International : the CIGR Ejournal Vol. VIII, June, 2006.
[6] Wolf SA, Wood SD. 1997. Precision farming : environmental legitimation, commodification of information, and industrial coordination. The Rural Sosiological Society. Rural Sociology 62(2):180-206.
2 2 1 1
3 3 2 1
3 3 1 3
2 2 1 3
3 1 3 5
4 2 4 3
2 1 5 5
2 3 5 5
112