119
Landslide Zonation at ... (Solle, et al)
Landslide Zonation at the Budong-Budong Watershed, Central Mamuju District of
West Sulawesi Province
Muchtar S. Solle
1, Paharuddin
2, Asmita Ahmad
1, and Muh. Ansar
11) Jurusan Ilmu Tanah Fakultas Pertanian Universitas Hasanuddin, Jl. Perintis Kemerdekaan KM 10 Makassar
2) Program Studi Geofisika Fakultas MIPA Universtas Hasanuddin, Jl. Perintis Kemerdekaan KM 10 Makassar
e-mail: [email protected]
Abstract
The objectives of this study are as follows: first, to investigate the contributing parameters induced land sliding in the Budong-Budong watershed, and second, to construct landslide susceptibility zonation map. In this study, the analytical hierarchy process (AHP) based on Geographical Information System (GIS) methods was used to produce map of landslide susceptibility. In this study area, more than 50% of total area were classified high (H) to very high (VH) susceptibility landslide zone. Mean while, 12% of total area were classified as moderate (M) and remaining were classified as low (L) to very low (VL) susceptibility landslide zone. Almost area of Budong-Budong Wetershed were classified as VH and H susceptibility landslide zone underlying by Talaya (Tmtv), Lamasi (Toml) and Latimojong (Kls) Formation on the steep slope land.
Keywords:AHP, GIS, Budong-Budong, landslide, watershed
Abstrak
Penelitian bertujuan untuk membangun peta kerentanan longsor di wilayah tersebut. Penelitian ini menggunakan metode Analytical Hierarchy Process AHP) dan Sistem Informasi Geografis (SIG) untuk membangun peta kerentanan tanah longsor. Hasil penghitungan mengklasifikasikan Indeks kerentanan tanah longsor menjadi 5 kategori yaitu sangat rendah, rendah, sedang, tinggi dan sangat tinggi. Berdasarkan peta zona kerentanan tanah longsor di wilayah DAS Budong-Budong, terdapat zona kerentanan tanah longsor kategori tinggi sampai sangat tinggi mencapai luas 187.429 ha atau 59 persen dari total luas wilayah DAS Budong-Budong. Wilayah DAS Budong-Budong yang tercakup didalam zona kerentanan tanah longsor kategori tinggi sampai sangat tinggi terdiri dari Formasi Talaya (Tmtv), Lamasi (Toml) dan Latimojong (Kls) pada bentang lahan berlereng terjal.
Kata kunci:AHP, Budong-Budong, DAS, longsor, SIG
Introduction
Landslide is one of natural disasters which causes property damage, death and adversely affect on infrastructure and farmlands. In Indonesia, it is the third most extreme disaster after flood and storm (BNPB, 2012). In Sulawesi island, landslides happen every year in rainy season. On 18 November 2013, landslide happened in Budong Budong watershed, West Sulawesi. Mass movements reached the body of Le bo river (tributary of Budong Budong river) and made some temporary barriers. When the rain came in abundant, they were collapsed and caused flood to the community situated in alluvial lands. The landslide susceptibility at the upstream should become a concern particularly when it comes rainy season since it may cause negatif effect to the downstream (Miardini dan Harjadi, 2011). There should be a study about it to anticipate the same
disaster. With or without a flood, a landslide may cause hazardous effects not only to people s lives, but it also distracts economical and social stabilities as what had happened to the landslide and hazardous flood in Gowa Regency caused by the collapse of Mount Bawakaraeng s caldera (26 March 2004), the collapse of natural watershed in Way Ela river in Maluku (25 July 2013) and in Biring Ere, Sinjai Regency (20 Juni 2006), and several disasters in other regencies or provinces in Indonesia.
A landslide with or without hazardous flood preceeding it happens in an unpredictable and short time. The wide areas affected by landslides at the upstream of the watershed have become a challenge to reveal the landslide causes and any mitigation that should be done. Fell et al. (2008) and Priyono et al. (2008) stated that landslide susceptibility was because of slope steepness and the combination of the slopes, geology, climate, vegetation and antropogenic such as deforestation and other significant factors.
Research Method
Objects of the research is Budong Budong watershed which administravely situated in Center Mamuju Regency, West Sulawesi Province. This watershed spreads from the notheast to the westeast with total area 317,514 ha.
This research is conducted by applying the analysis og geographical informative system including Overlaying, Buffering, and Network Analyzing based on multi-criteria analysis and Analytical Hierarchical Process (AHP). This AHP has been used by other researchers (Ayale et al., 2005; Komac, 2006; Intarawichian and Dasananda, 2010; Yalcin, 2008; Yalcin et al., 2011). For the process above, the maps or the layers of all factors/parameters in this reserach should be prepared first (Figure 1) and those are : - elevation map from Aster DEM, 2009. Resolution 30m
- slope steepness map from Aster DEM, 2009. Resolution 30m
- slope aspect map from Aster DEM, 2009. Resolution 30m
- litology map from the map of regional Geology of Sulawesi
- straightness map from the map of regional geology of Sulawesi
- map of proximity to river from the Indonesian Topographic Map with the scale of 1: 50.000 - map of proximity to road from the Indonesian Topographic Map with the scale of 1: 50.000 - isohyet map from the annual rainfall data of Kalumpang station, Karossa, Mamasa and Majene - The Land cover map from citra landsat TM 7 year 2011
- The Soil Texture map from the report of RePProT
and RTSP Transmigration
The landslide susceptibility map of Budong Budong watershed is built with the AHP method and in this method, index of landslide susceptibility in every pixel is calculated by adding up the values of every factor causing landslide with the formula:
(1)
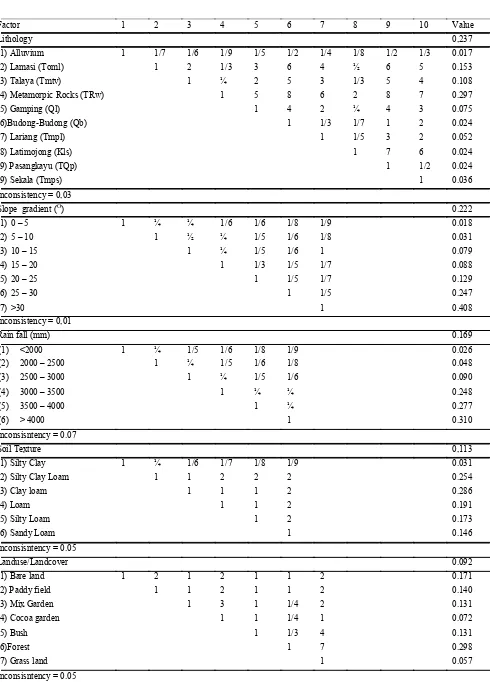
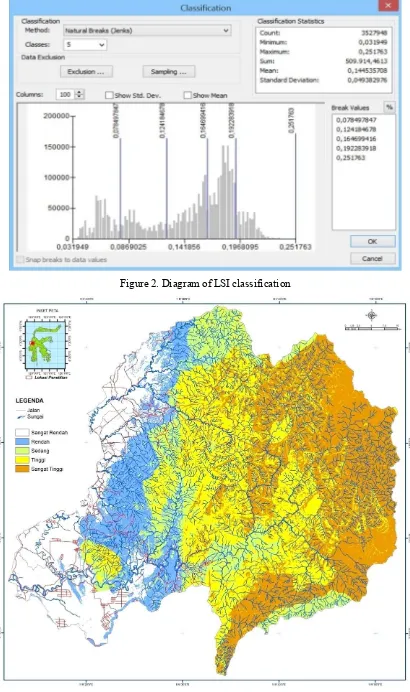
Where : LSI is the index of landslide susceptibility in every pixel, Ri and Wi are the the value level and the value factor (1) which are from the result of AHP method. Since the basic of the calculation is in pixel, all maps or layers are in the form of vector data which is transformed into the raster form and then it is time to add the value of each layer which is resulted from the AHP process (Table 1). The ultimate process is the making of the landslide susceptibility map using formula (1), which is automatically calculated by weighted overlaying technique in the menu of program Arcgis 10.2. Using the natural breaks algorithm menu (Figure 3), the result of LSI value is divided into 5 categories of landslide susceptibility zones : 1. Very high, 2. High, 3. Medium, 4. Low, and 5. Very low (Table 2).
Result and Discussion
Figure 1. Thematic/layer map which is used to build the map of landslide susceptibility of Budong Budong
experienced a decline of shear strength. Significant amount of fissions in tufa may cause in the decline of stone stability which becomes so low mainly due to the intensif weathering process of the stone surface and the internal stone resulted from fission. The materials making up the tufa are soft and they may fasten the decline of rock stability (Comegna, et al., 2013; Regmi et al., 2013). This texture has mineral crystal surface so that the chemical and physics reactions due to the interaction with subversive water result in the increase of shear stress.
The value of landslide susceptibility index (LSI) is calculated by using the formula (2). From the result it is known that the LSI has a minimum value of 0.03
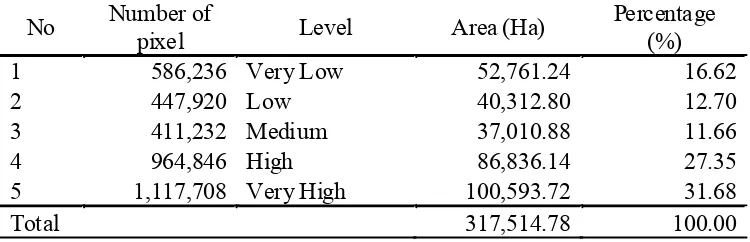
and maximum value of 0.25 with the average value of 0.14 and deviation standar 0.05. LSI is mainly a relative susceptability of landslide. Therefore, the higher index that an area has, the higher susceptability of area to experience landslide. For further process, the index value is devided into five levels based on the Natural Breaks method (see Figure 2) which represent five different zones of landslide susceptability. Finally, those zones are classified into five levels: very high (VH), High (H), Medium (M), Low (L), Very Low (VL) and they are described in the map of landslide susceptability (Figure 3). In addition, their percentages are shown in Table 2. Landslide susceptability Zone which includes high to
L i t h o l o g y L i n e a m e n t S o i lT e x t u r e
A s p e c t S l o p e E l e v a t i o n
P r o x i m i t y t o R o a d P r o x i m i t y
Factor 1 2 3 4 5 6 7 8 9 10 Value
Lithology 0,237
(1) Alluvium 1 1/7 1/6 1/9 1/5 1/2 1/4 1/8 1/2 1/3 0.017
(2) Lamasi (Toml) 1 2 1/3 3 6 4 ½ 6 5 0.153
(3) Talaya (Tmtv) 1 ¼ 2 5 3 1/3 5 4 0.108
(4) Metamorpic Rocks (TRw) 1 5 8 6 2 8 7 0.297
(5) Gamping (Ql) 1 4 2 ¼ 4 3 0.075
(6)Budong-Budong (Qb) 1 1/3 1/7 1 2 0.024
(7) Lariang (Tmpl) 1 1/5 3 2 0.052
(8) Latimojong (Kls) 1 7 6 0.024
(9) Pasangkayu (TQp) 1 1/2 0.024
(9) Sekala (Tmps) 1 0.036
Inconsistency = 0,03
Slope gradient (O) 0.222
(1) 0 5 1 ¼ ¼ 1/6 1/6 1/8 1/9 0.018
(2) 5 10 1 ½ ¼ 1/5 1/6 1/8 0.031
(3) 10 15 1 ¼ 1/5 1/6 1 0.079
(4) 15 20 1 1/3 1/5 1/7 0.088
(5) 20 25 1 1/5 1/7 0.129
(6) 25 30 1 1/5 0.247
(7) >30 1 0.408
Inconsistency = 0,01
Rain fall (mm) 0.169
(1) <2000 1 ¼ 1/5 1/6 1/8 1/9 0.026
(2) 2000 2500 1 ¼ 1/5 1/6 1/8 0.048
(3) 2500 3000 1 ¼ 1/5 1/6 0.090
(4) 3000 3500 1 ¼ ¼ 0.248
(5) 3500 4000 1 ¼ 0.277
(6) > 4000 1 0.310
Inconsisntency = 0.07
Soil Texture 0,113
(1) Silty Clay 1 ¼ 1/6 1/7 1/8 1/9 0.031
(2) Silty Clay Loam 1 1 2 2 2 0.254
(3) Clay loam 1 1 1 2 0.286
(4) Loam 1 1 2 0.191
(5) Silty Loam 1 2 0.173
(6) Sandy Loam 1 0.146
Inconsisntency = 0.05
Landuse/Landcover 0.092
(1) Bare land 1 2 1 2 1 1 2 0.171
(2) Paddy field 1 1 2 1 1 2 0.140
(3) Mix Garden 1 3 1 1/4 2 0.131
(4) Cocoa garden 1 1 1/4 1 0.072
(5) Bush 1 1/3 4 0.131
(6)Forest 1 7 0.298
(7) Grass land 1 0.057
Inconsisntency = 0.05
Distance to lineament 0.052
(1) 0 50 1 4 6 7 8 8 0.497
(2) 50 100 1 4 5 6 7 0.250
(3) 100 150 1 4 4 4 0.122
(4) 150 200 1 2 3 0.059
(5) 200 250 1 2 0.041
(6)>250 1 0.031
Inconsisntency = 0.08
Distance to drainage (m) 0.039
(1) 0 50 1 5 6 7 8 9 0.561
(2) 50 100 1 1 2 2 3 0.131
(3) 100 150 1 1 2 2 0.105
(4) 150 200 1 2 2 0.092
(5) 200 250 1 2 0.064
(6) >250 1 0.046
Inconsisntency = 0.02
Slope aspect 0.034
(1) Flat 1 1/7 1/3 ½ 1/6 1/7 1/7 1/5 1/8 0.019
(2) North 1 1 3 1 1/2 1/2 1 1/2 0.091
(3) Northeast 1 2 ½ 1/6 1/2 1 1/2 0.064
(4) East 1 1/5 1/8 1/4 1/3 1/4 0.030
(5) Southeast 1 1/6 3 1 1/3 0.112
(6) South 1 7 1 1 0.291
(7) Southwest 1 1 1/3 0.093
(8) West 1 1/3 0.116
(9)Northwest 1 0.182
Inconsisntency = 0,07
Elevation (m) 0.030
(1) 500 1000 1 ¼ 1/5 1/6 1/7 1/8 0.980
(2) 1000 1500 1 1 ½ 1/3 1/4 0.129
(3) 1500 2000 1 1/6 1/6 1/8 0.179
(4) 2000 2500 1 ¼ 1/6 0.247
(5) >2500 1 1/7 0.318
Inconsisntency = 0,02 1
Distance to road (m) 0.017
(1) 0 50 1 4 5 6 7 8 0.475
(2) 50 100 1 4 5 6 7 0.259
(3) 100 150 1 4 4 4 0.129
(4) 150 200 1 2 3 0.062
(5) 200 250 1 2 0.043
(6) >250 1 0.031
Inconsisntency = 0,02
Figure 2. Diagram of LSI classification
very high level has the area 187,429 ha or 59% of the total area of Budong Budong watershed while the zone which includes the medium level has the area 37,010 ha or 27.35% of Budong Budong watershed. Since it is relatively wide, the government center development at the downstream of Budong Budong watershed should have a precise estimation and intergrated plan with the development at the upstream.
Conclusion
1. Based on the evaluation result of landslide causes, there are three main factors causing the landslide in Budong Budong watershed: lithology (0.237), land steepness (0.222) and rainfall (0.169).
No
Number of
pixel
Level
Area (Ha)
Percentage
(%)
1
586,236 Very Low
52,761.24
16.62
2
447,920 Low
40,312.80
12.70
3
411,232 Medium
37,010.88
11.66
4
964,846 High
86,836.14
27.35
5
1,117,708 Very High
100,593.72
31.68
Total
317,514.78
100.00
Table 2. Landslide susceptability levels of Budong Budong watershed
2. The category of Landslide susceptability zone at Budong Budong watershed is high and even very high with the total area 187,429 ha or 59% of the total area of Budong Budong watershed. Its distribution mainly extents from the middle to upstream of Budong Budong watershed particularly at Talaya formation, Lamasi and Latimojong.
Acknowledgement
My gratitude is delivered to Direktorat Pendidikan Tinggi (DIKTI) and Lembaga Penelitian dan Pengabdian Masyarakat (LP2M) Hasanuddin University for the research fund which is given to the researcher so that this research can be done well.
References
Ahmad, A., Solle, M.S., Paharuddin. 2014. Hubungan antara Faktor Litologi dengan Tipe dan Pola Longsoran di Sub Das Salo Lebbo, DAS Budong-Budong, Kabupaten Mamuju Tengah, Provinsi Sulawesi Barat. Makalah dipresentasikan pada Seminar Nasional Pengelolaan Das Terpadu Untuk Kesejahteraan Masyarakat 2014. Ayalew, L., Yamagishi, H., Marui, H., Kanno,T. 2005. Landslides in Sado Island of Japan: Part II. GIS-based susceptibility mapping with comparisons of results from two methods and verifications. Engineering Geology Journal 81. 432 445.
Calvert, S.J., R. Hall. 2007. Cenozoic evolution of the Lariang ang Karama regions, North Makassar basin, western Sulawesi, Indonesia. Petroleum Geosciences Journal. Vol.3. pp. 353-368.
Comegna, L., L. Picarelli, E. Bucchignnani, P. Mercogliano. 2013. Potential effects of incoming changes on the behavior of slow active landslides in clay. Journal of the International Consortium on Landslides. Springer. Vol.10. No.4.
Fell, R., Corominas, J., Bonnard, C., Cascini, L. Leroi, E., Savage, W.Z. 2008. Guidelines for landslide susceptibility, hazard and risk zoning for land use planning. Engineering Geology Journa 102. 85 98 Intarawichian,N. and Dasananda, S. 2010.Analytical hierarchy process for landslide susceptibility mapping in
lower Mae Chaem watershed, Northern Thailand. Suranaree Journal of Science and Technology 17 (3) : 277-292
statistics in perialpine Slovenia. Geomorphology Journal 74. 17-28.
Miardini, A., B. Harjadi. 2011. Aplikasi penginderaan jauh dan SIG dalam penilaian potensi erosi permukaan secara kualitatif di daerah tangkapan waduk Kedung Ombo. Jurnal Forum Geografi. Vol.25. No.2. Hal. 152-163.
Priyono, Kuswaji Dwi. 2008. Analisis morfometri dan morfostruktur lereng kejadian longsor di Kecamatan Banjarmangu Kabupaten Banjarnegara. Jurnal Forum Geografi. Vol.22. No.1 Juli. Hal. 53-69.
Regmi, A.D., K. Yoshida, M.R. Dhital, K. Devkota. 2013. Effect of rock weathering, clay mineralogy, and geological structures in the formation of large landslides, a case study from Dumre Besei landslides, Lesser Himalaya Nepal. Landslides Journal. Springer-Verlag.
Republika, 2013 Banjir bandang, 3 desa di Mamuju terendam. www.republika.co.id/
Yalcin, A. 2008. GIS-based landslide susceptibility mapping using analytical hierarchy process and bivariate statistics in Ardesen (Turkey): Comparisons of results and confirmations. Catena Journal 72. 1 12. Yalcin, A., Reis, S., Aydinoglu, A.C. and Yomralioglu, T. 2011.A GIS-based comparative study of frequency