A COMPARATIVE STUDY OF HYBRIDIZATION
METHOD OF PARTICLE SWARM OPTIMIZATION
(PSO) FAMILY FOR NETWORK RECONFIGURATION
MUHAMMAD KHAIRILLAH BIN YUNUS
BACHELOR OF ELECTRICAL ENGINEERING
(INDUSTRIAL POWER)
UNIVERSITI TEKNIKAL MALAYSIA MELAKA
i
“ I hereby declare that I have read through this report entitled “ A Comparative Study of Hybridization Methods of Particle Swarm Optimization (PSO) Family for Network Reconfiguration ” and found that it has comply the partial fulfillment for awarding the degree of Bachelor of Electrical Engineering (Industrial Power)”
Signature : ……….
Supervisor’s Name : ……….
ii
A COMPARATIVE STUDY OF HYBRIDIZATION METHODS OF PARTICLE
SWARM OPTIMIZATION (PSO) FAMILY FOR NETWORK
RECONFIGURATION
MUHAMMAD KHAIRILLAH BIN YUNUS
A report submitted in partial fulfillment of the requirements for the degree of Bachelor of Electrical Engineering (Industrial Power)
Faculty of Electrical Engineering
UNIVERSITI TEKNIKAL MALAYSIA MELAKA
iii
“ I declare that this report entitled “ A Comparative Study of Hybridization Methods of Particle Swarm Optimization (PSO) Family for Network Reconfiguration ” is the result of my own research except as cited in the references. The report has not been accepted for any degree and is not concurrently submitted in cadidature of any other degree ”
Signature : ……….
Name : ……….
iv
v
ACKNOWLEDGEMENT
I submit my heartiest gratitude to my respected supervisor Mr Muhammad Fani Bin Sulaima that had been a great mentor for me. I would like to thank you for encouraging my research and completed this thesis. Your advice on both research as well as on my study is priceless.
I revere the patronage and moral support extended with love, by my parents whose passionate encouragement made it possible for me to complete this project
vi
ABSTARCT
vii
ABSTRAK
viii
TABLEOFCONTENT
CHAPTER TITLE PAGE
ACKNOWLEDGEMENT V
ABSTRACT VI
TABLE OF CONTENT VIII
LIST OF FIGURES XI
LIST OF TABLES XII
LIST OF APPENDIXES XIV
1 INTRODUCTION 1 2.1.1 Types of Distribution System 4 2.1.1.1 Radial distribution system 4 2.1.1.2 Loop/ Ring distribution system 5 2.1.1.3 Mesh / Network distribution system 5 2.1.2 Distribution Network Reconfiguration Method 6 2.1.2.1 Switch Connection 7 2.1.3 Energy loss reduction and cost reduction 9 2.2 Review of Previous Related Works 10 2.3 Summary and Discussion of the Review 12
ix
3.1 Overview 13
3.2 PSO Family 13
3.2.1 Particle Swarm Optimization (PSO) 13 3.2.2 Evolutionary Particle Swarm Optimization (EPSO) 18 3.2.3 Rank Evolutionary Particle Swarm Optimization
(REPSO)
22
x
3.4.3.7 Convergence Test 41 3.4.4 The List of Data That Will Be Used Throughout
The Test
41
4 RESULTS AND DISCUSSION 42
4.1 Overview 42
4.2 Project Achievement 42 4.2.1 Results For 33kV IEEE Test System 42 4.2.1.1 Power Losses Reduction 42 4.2.1.2 Convergence Time 42 4.2.1.3 The 33-Bus Test System and Simulation
Results
42
4.2.1.4 Energy Losses Reduction 46 4.2.1.5 Total Cost Save 58 4.2.2 Evaluation of Information 61 4.2.3 Conclusion and Recommendation 63
5 CONCLUSION 64
5.1 Conclusion 64
5.2 Recommendation 64
REFERENCES 65
xi
LIST OF FIGURE
FIGURE TITLE PAGE
2.1 Radial Distribution system 4
2.2 Loop/ Ring distribution system 5
2.3 Mesh/Network distribution system 6
2.4 16-Node distribution system [6] 7
3.1 The flow chart of the Particle Swarm Optimization 15
3.2 The flow chart of the Evolutionary Particle Swarm Optimization
3.4 The 33-bus radial initial configuration 28
3.5 Implementation of PSO in Network Reconfiguration 31
3.6 Implementation of EPSO in Network Reconfiguration 34
3.7 Implementation of REPSO in Network Reconfiguration 38
4.1 No of simulation versus the total power losses for PSO 46
4.2 No of simulation versus the total power losses for EPSO 46
4.3 No of simulation versus the total power losses for REPSO 47
4.4 No of simulation versus the total power losses for PSO, EPSO and
xii
4.9 Number of simulation versus the computation time for PSO, EPSO
and REPSO algorithm
51
4.10 The convergence time between PSO, EPSO and REPSO 52
4.11 The initial 33-bus radial IEEE test system configuration 53
4.12 The 33-bus radial IEEE test system radial after reconfiguration with
PSO
54
4.13 The 33-bus radial IEEE test system radial after reconfiguration with
EPSO
55
4.14 The 33-bus radial IEEE test system radial after reconfiguration with
REPSO
56
4.15 Average SAIDI data for Malaysian Peninsular Area 57
4.16 Total cost loss divided by month with original network and PSO
Family algorithm apply on the 33-bus radial IEEE test system
59
4.17 Total annual cost operation with original network and PSO Family
algorithm apply on the 33-bus radial IEEE test system
59
4.18 Total cost save when PSO Family algorithm apply on 33-bus radial
IEEE test system
xiii
LIST OF TABLE
TABLE TITLE PAGE
4.1 Power losses after reconfiguration with PSO algorithm 43
4.2 Power losses after reconfiguration with EPSO algorithm 44
4.3 Power losses after reconfiguration with REPSO algorithm 45
4.4 The statically analysis of power loss for three cases 48
4.5 The analysis results for 33-bus test system for three cases 48
4.6 Average SAIDI data for Malaysian Peninsular Area [25] 57
4.7 The electricity average selling [25] 58
4.8 Total Cost loss for one day for Peninsular Malaysia 58
4.9 Total cost loss per month 58
4.10 Total cost save when PSO Family algorithm apply on the network 60
4.11 The performance analysis on the 33 bus systems by using PSO,
GA, EP EPSO and REPSO by previous researcher
62
4.12 The summarization of analysis results for 33-bus radial IEEE test
system
xiv
APPENDICES TITLE PAGE
A The 33-bus data 68
B The load flow data 70
C The bus admittance matrix for power flow solution data 71
D The Newton-Raphson data 72
E Turn-it In Report 76
1
CHAPTER 1
INTRODUCTION
1.1 Motivation
Electricity distribution companies constantly require improvements in service, and an appropriate reduction in cost of the system. Since the distribution system is the biggest section in power system area, by finding the best optimal method that can reduce the power losses that at the same time influences the cost and crucially also leading to significant energy saving. For the past year, distribution network reconfiguration using the heuristics method had been widely study to minimize the power losses. These studies propose to analyze one of the heuristic methods and compare the hybrid PSO algorithm for distribution network reconfiguration. To verify the effectiveness of the proposed method, comparative studies are conducted between the algorithm to find the most excel PSO Family that efficient in power loss reduction, computed time and cost saving.
1.2 Problem Statements
2
minimum power loss and best computing time performances. Moreover , the impact of the performances of the PSO Family algorithms on the total cost saves also have not been conducted.Thus, with knowledge about the effectiveness performance of the heuristics algorithms when applied for the distribution network reconfiguration. It will gives advantages for improvement of power system efficiency and better financial planning.
1.3 Objective
There are several objectives that have been highlighted in this project. There are:
a) To analyze the power loss after hybrid method of PSO family applied on network reconfiguration
b) To compare the performance of computing time between hybrid method of PSO Family
c) To validate the cost saving saving after hybrid method of PSO family applied on network reconfiguration in Malaysia.
1.4 Scope
The scope of this paper in mainly focused on comparative studies between PSO, EPSO and REPSO in radial network that contains of group of interconnected radial circuit distribution. Every coding will be carried out by executing MATLAB software simulation along with analyzed upon the 33-bus radial IEEE test system. The Malaysian average selling price [25] were used to analyze the cost saving when the algorithms applied on the network .
1.5 Outline
3
Chapter 1 : Introduction
This section specifies motivation to acquire the following research. The determined problem statement, objectives, scope and significances of the research are outlined in this section.
Chapter 2 : Literature Review
This section explains the theory as well as the basic principle and review of previous related work regarding PSO, EPSO and REPSO
Chapter 3 : Research Methodology
In this section, the chapter explains the implementation of the PSO Family algorithm for implementation in distribution network reconfiguration (DNR) in 33Kv IEE test system. In this chapter also defined the mathematical formulation along with constrain that need to be obey in the studies.
Chapter 4 : Results
This segment provides the evaluation of the results obtained through simulation of MATLAB of PSO, EPSO and REPSO in IEEE 33kV bus. The overall investigation of the findings is going to be investigated.
Chapter 5 : Conclusion
4
CHAPTER 2
LITERATURE REVIEW
2.1 Theory and basic principle
2.1.1 Types of distribution system
There are three general classification of electrical power distribution system.
2.1.1.1Radial distribution system
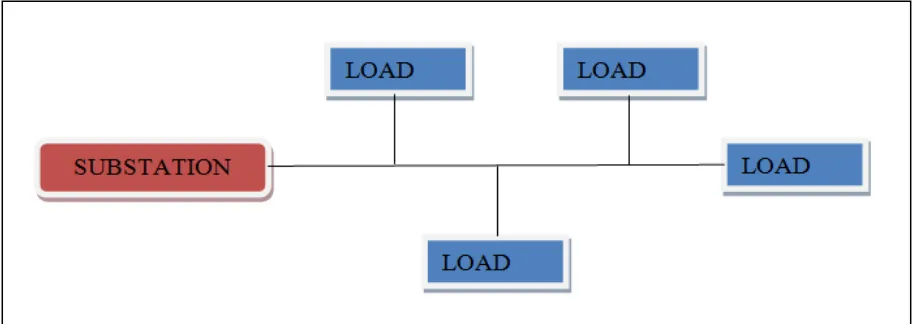
Radial system is the most basic type because the power comes right from a single power source. A generating system supplies power from the substation via radial lines that are extended to the different areas of a community. Radial system is at least efficient in terms of continuous service since there are no back up distribution system connected to the single power source. If any power line opens, one or more loads are disrupted. There is more possibility of power black outs. On the other hand, the radial system is least expensive.
5
2.1.1.2Loop/ Ring distribution system
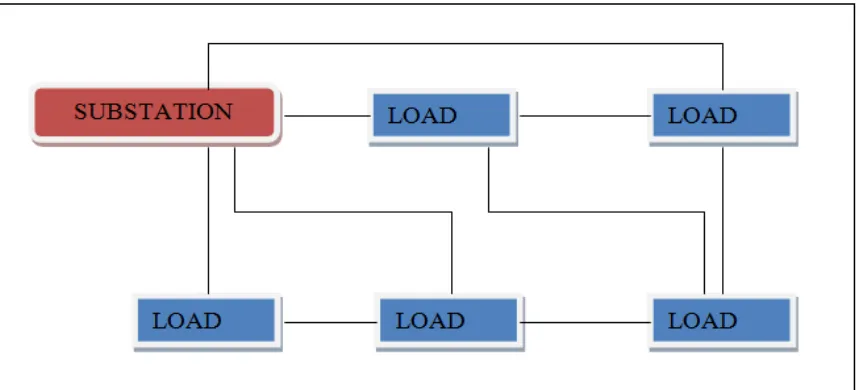
Ring distribution systems tend to be utilized in heavily populated areas. The distribution lines encircle the services area. Power is supplied from one or more power sources into substations close to the services area. The power is then distributed through the substations via the radial power lines. When a power line is opened, no disruption to other load occurs. The ring system provides a more continues service than the radial system. Attributed to extra power lines and a greater circuit complexity, the ring system is more expensive.
Figure 2.2: Loop / Ring distribution system
2.1.1.3Mesh / Network distribution system
6
Figure 2.3: Mesh/Network distribution system
2.1.2 Distribution network reconfiguration method
7
There are lot of benefits of network reconfiguration [1]–[5]:
i. Efficient electric distribution ii. Improves voltage stability iii. Smoothen the peak demand iv. Increase network reliability
v. Reduce cost instillation of switching equipment vi. Minimize the real power losses
vii. Relieves the overloading of network components and in the feeders viii. Balancing system load
2.1.2.1Switch Connection
Switch connection was installed in primary distribution system for both protection and configuration management purpose. The ‘radiality’ of the network is sustained, with the ability to manipulating the condition for both two types of switch by opening or closing to reduce resistive line losses.
8
2.1.2.1.1 Closed switches (sectionalizing switches)
The sectionalizing switches are normally closed. Sectionalizing switch need to be opened to sustain the radial composition of the distribution network. For instance, in Fig. 1, whenever the loads of feeder 2 get heavy under normal operating conditions, the sectionalizing switch linking nodes (9 and 10) must be opened up to sustain the radial structure regarding the network.
2.1.2.1.2 Normally open switches (tie switches)
The tie switches are generally normally open. It just closed intended for transferring load to distinct feeders. For illustration, in Fig. 1, whenever the loads of feeder 2 turn out to be heavy under normal operating conditions, the tie switch connecting nodes (5-11) may possibly be closed to transfer the load at bus11 from feeder 2 to feeder 1.
The objective of the reconfiguration is to minimize the distribution losses with turning on/off sectionalizing switches. The reconfiguration problem has the following constrains [6]:
1. Power flow equations.
2. Upper and lower bounds of nodal voltages. 3. Upper and lower bounds of line currents.
9
2.1.3 Energy loss reduction and cost reduction
One of the main purpose of heuristic method applied to the Distribution Network Reconfiguration applied to the network is to reduce the power loss in the distribution area. Whilist, the power loss has been reduce, the value of the cost saving will increase. Certain studies had been doned in energy loss reduction in Distribution Network Reconfiguration. In [7] , to reduce the operating cost in the real-time operation environment , Liu and W Edwin apply a new feeder reconfiguration algorithm. Operate as series of open/close switching operation, it reduce the resistive losses in primary distribution feeders and at the same time reduce the cost of system operation. The test results prove efficient and robust of the develop algorithm that operate as decision support tool by using production grade software named FRECON.
The studies of reduction of operational cost continues by [8], where there Enhanced Gravitational Search Algorithm (EGSA) for multi-objective distribution feeder reconfiguration considering reliability, loss and operational cost. EGSA algorithm use to reduce processing time, improve quality and avoid from being trapped in local minima. The paper shows the superiority of EGSA obtain better results with respect to the PSO and GA algorithm when tested on 33 and 70 node test system.

![Figure 2.4: 16-Node distribution system [6]](https://thumb-ap.123doks.com/thumbv2/123dok/494405.54901/22.595.178.433.455.637/figure-node-distribution-system.webp)
