THE USE OF MICROSATELLITE
MARKERS
TO
STUDY
GENETIC
DIVERSITY IN
INDONESIAN SHEEP
Jakaria1, M.S.A. Zein2, S. Sulandari2, Subandriyo3and Muladno1 1Faculty of Animal Science, Bogor Agricultural University,
Jl Agatis, Darmaga Campus, Bogor 16680 - Indonesia
2Indonesian Institute of Sciences,Jl. Raya Bogor Km 46, Cibinong 16911, Bogor - Indonesia 3Indonesian Center for Animal Science Research and Development (ICASRD),
Jl. Veteran III PO Box 221, 16002, Bogor - Indonesia Correspondence E-mail: [email protected]
Received January 9, 2012; Accepted February 18, 2012
ABSTRAK
Tujuan penelitian ini adalah mempelajari keragaman genetik populasi domba di Indonesia menggunakan penciri DNA mikrosatelit. Sebanyak 18 lokus DNA mikrosatelit digunakan untuk menentukan genotipe populasi domba Indonesia. Sampel darah domba yang digunakan sebanyak 200 ekor berasal dari populasi domba garut tipe tangkas, domba garut tipe daging, domba purbalingga,
domba batur dan domba jember diektraksi DNA total dengan menggunakan metode salting out. Data
lokus DNA mikrosatelit dianalisis menggunakan program POPGENE 3.2. Hasil penelitian menunjukkan bahwa diperoleh sebanyak 180 alel dari 17 lokus DNA mikrosatelit, sedangkan rataan jumlah alel adalah 10 alel (6 sampai 18 alel) dari lima populasi domba Indonesia (domba garut tipe tangkas, domba garut tipe daging, domba purbalingga, domba batur dan domba jember). Nilai heterosigositas observasi (Ho) dan heterosigostas harapan (He) diperoleh masing-masing 0,5749 dan 0,6896, sedangkan nilai genetik diferensiasi untuk inbreeding antar populasi (FIS), dalam populasi (FIT) dan rataan diferensiasi genetik
(FST) masing-masing 0,1006; 0,1647 dan 0,0712. Jarak genetik dan pohon genetik menunjukkan bahwa
populasi domba Indonesia berbeda antara populasi domba garut tipe tangkas, domba garut tipe daging, domba purbalingga, domba batur dan domba jember. Berdasarkan hasil penelitian dapat disimpulkan bahwa diperlukan strategi program pemuliaan, pelestarian dan pemanfaatan secara berkelanjutan pada setiap populasi domba di Indonesia.
Kata-kata kunci: domba Indonesia, penciri DNA mikrosatelit, keragaman genetik
ABSTRACT
The purpose of this research was to study genetic diversity in Indonesian sheep population using microsatellite markers. A total of 18 microsatellite loci have been used for genotyping Indonesian sheep. Total sheep blood 200 samples were extracted from garut sheep of fighting and meat types, purbalingga sheep, batur sheep and jember sheep populations by using a salting out method. Microsatellite loci data were analyzed using POPGENE 3.2 software. Based on this study obtained 180 alleles from 17 microsatellite loci, while average number of alleles was 6.10 alleles (6 to 18 alleles) from five Indonesian sheep populations (garut sheep of fighting type, garut sheep of meat type, purbalingga sheep, batur sheep and jember sheep population). The average of observed heterozygosity (Ho) and expected heterozygosity (He) values were 0.5749 and 0.6896, respectively, while the genetic differentiation for inbreeding among population (FIS), within population (FIT) and average genetic differentiation (FST)
were 0.1006, 0.1647 and 0.0712, respectively. Genetic distance and genetic tree showed that Indonesian sheep population was distinct from garut sheep of fighting and meat types, purbalingga sheep, batur sheep and jember sheep population. Based on this results were needed a strategy for conservation and breeding programs in each Indonesian sheep population.
Keywords: Indonesian sheep, microsatellite marker, genetic diversity
INTRODUCTION
Indonesian sheep is generally maintained
major source of meat and small part as social culture. Indonesia has two types of sheep which are very popular throughout the country, i.e. thin tail type and fat tail type sheep (Devendra and McLeroy, 1992). In addition, there are also fighting type sheep, so called garut sheep. Indonesian thin and fat tail sheep have several advantages; especially they are well adapted to the hard environment, able to utilize low-quality feed, prolific (Inounu et al., 1986), early puberty (Sutama et al., 1988) and resistance to internal parasites (Romjali et al., 1998).
As one of the Indonesian animal genetic resources, sheep plays an important role for small holder farmers. So, it is expected that sheep rearing may provide benefits for food availability needed, agricultural and social development of society in the future. Moreover, genetic attention on Indonesian sheep is still very limited. According to Baumung et al. (2004), DNA microsatellite is one of the popular markers used to estimate genetic diversity in livestock. DNA microsatellite sequences are valuable genetic markers due to their dense distribution in the genome, great variation, co-dominant inheritance and easy genotyping. In recent years, they have been extensively used in parentage testing, linkage analyses, population genetics and other genetic studies (Goldstein and Pollock, 1997).
Several studies have reported that DNA microsatellite marker have been widely used to study genetic diversity in Spanish sheep (Arranz
et al., 2001), European sheep (Peter et al., 2007), meat type sheep in China (Chen et al., 2009) and Ganjam sheep (Arora et al. 2010). Based on the lack of genetic information about garut sheep of fighting and meat types, purbalingga sheep, batur sheep and jember sheep populations as Indonesian local sheep, so microsatellite markers became one of the reasons where this research was conducted to determine the genetic diversity in Indonesian sheep population especially garut sheep of fighting type, garut sheep of meat type, purbalingga sheep, batur sheep and jember sheep populations. vena jugular's and preserved in the magic buffer (anticoagulant, antifungal and antibacterial), and then stored in freezer.
Sheep total genomic was extracted by using salting-out method (Mburu and Hanotte, 2005). A total of 18 microsatellite markers used in this study were selected from the International Society for Animal Genetics (ISAG) lists (FAO, 1998) as
follows ILSTS05, MCM527, SRCPSP05,
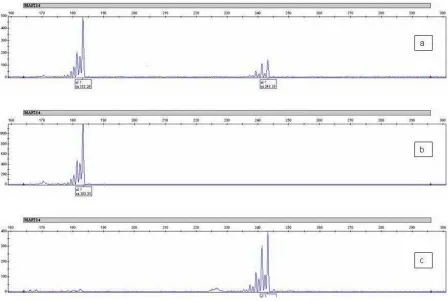
OarFCB128, HUJ616, OarHH47, ILSTS11, DYMS1, BM8125, OarFCB226, OarAE129, OarJMP29, SRCRSP9, MAF214, OarCP34, OarFBC203, MAF09, MAF65, respectively (Table 2). Amplification of these 18 microsatellite loci from sheep genomic DNA of each individual was carried by using ABsys PCR machine based a manual of microsatellite genotyping with special reference to livestock population genetics protocol (Mburu and Hanotte 2005). Genotyping is done using the reaction multi-loading/co-loading in ABI3130XL automatic sequencer machine. Sample analyzed was divided into three co-loading. Each co-loading consists of six sets of primer (PCR product) with four colors according to the label used. Co-loading 1 consists ILSTS5, MCM527, SRCPSP05, OarFCB128, HUJ616 and OarHH47 loci. Co-loading 2 consists ILSTS11, DYMS1, BM8125, OarFCB226, OarAE129 and OarJMP29 loci. Co-loading 3 consists SRCRSP9, MAF214, OarCP34, OarFCB203, MAF09 and MAF65 loci.
Allele identification of microsatellite loci were analyzed using GeneMapper software (version 3.7, Applied Biosystems). Number of alleles (NA) of each locus and the number of effective alleles (NE) per locus, observed
heterozygosity values (Ho) and expected
heterozigosity (He), F statistics (FIS, FIT, FST) and genetic distance were calculated using GENEPOP software (V3.2) (Raymond and Rousset, 2001). The genetic tree constructed using UPGMA (Un-weighted Pair Group Method with Arithmetic mean) method (Nei et al., 1983).
RESULTS AND DISCUSSION
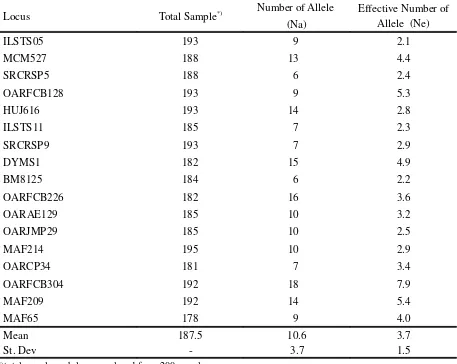
Seventeen of DNA microsatellite loci used, 180 alleles were found in five Indonesian sheep populations. The number of alleles per locus (NA) varied from six alleles (SRCRSP5 and BM8125 loci) to 18 alleles (OARFCB304 locus) with the average and standard deviation 10.6 and 3.7, respectively, for all populations. The number of alleles (NA) and effective allele number (NE) in the total population are presented in Table 3, while the average number of alleles (MNA) and the average effective number of alleles (MNE) are presented in Table 4.
These results showed high average number of alleles (10.6) in all Indonesian sheep population. The average number of alleles in each population is not different significantly (6.2 to 6.5). The average and standard deviation of the observed heterozygosity (Ho) and expected heterozygosity (He) in Indonesian sheep
populations are 0.5749±0.1236 and
0.6878±0.1065, respectively (Table 5). The average heterozygosity value was high in Indonesian sheep population based on the observed (Ho) and the expected heterozygosity (He) values. This result indicated that the genetic diversity within population of Indonesian sheep were still high.
Seventeen microsatellite loci were used effectively to explain the genetic diversity between and within Indonesian sheep populations. Based on the seventeen microsatellite loci used in this study, 9 loci have number of alleles (NA) variability (polymorphic) in Indonesian sheep that displayed on all population. Eight loci having less than 10 alleles are ILSTS05, SRCRSP5, OARFCB128, ILSTS11, SRCRSP9, BM8125, OARCP34, and MAF65 loci. This result showed that Indonesian sheep population has the allele number higher then Ganjam sheep population. Arora et al. (2010) reported that 137 alleles from 25 loci of microsatellite DNA marker were found in Ganjam sheep.
F statistics (FIS, FIT and FST) analysis showed that inbreeding rate between (FIS) and within (FIT) populations are 0.1006 (10.06%) and 0.1647
(16.47%) respectively, whereas genetic
differentiation (FST) between population is 0.0712 (7.12%) (Table 6). High genetic diversity in Indonesian sheep population indicated nonappearance of an intensive selection program and there is no depression inbreeding. The inbreeding rate value on between (FIS) and within (FIT) population are 0.1006 (10.06%) and 0.1647 (16.47%), respectively, which is relatively low. In contrast, the results of inbreeding rate in the Chinese sheep populations (Dorset, Texel, Black-Sufolk, Tan, Han, hybrid TH) are 0.5272 (52.72%) and 0.5602 (56.02%), for FIS and FIT
respectively, whereas the expected
heterozygosities (0.8177) were higher than the observed heterozygosities (0.3838), showing that homozygous individuals are more than common, and inbreeding is serious in the tested populations (Chen et al., 2009). In contrast to our study results Table 1. Summary of Sheep Population Samples
Population Location Type Utility Blood Sample
Garut 1 Small holder farmer, Wanaraja-Garut
regency-West Java.
Thin tail Fighting 40
Garut 2 Small holder farmer, Wanaraja-Garut
regency-West Java.
showed that the observed (Ho) and expected (He) heterozygosity on Indonesian native sheep populations were similar.
Genetic tree constructed on the basic of genetic distances among populations are divided into four major groups namely, garut sheep (thin Table 2. The Primer Sequences, Label and Temperature Annealing of the Used Microsatellite Marker
Locus Name Sequences 5’à 3’ Forward/ Reverse Label Ta
(oC)
Allele Size (bp)
Chromosomal Location
ILSTS005 GGAAGCAATGAAATCTATAGCC
TGTTCTGTGAGTTTGTAAGC
6FAM 55 174-218 7
MCM527 GTCCATTGCCTCAAATCAATTC
AAACCACTTGACTACTCCCCAA
NED 56 165-187 5
SRCRSP5 GGACTCTACCAACTGAGCTACAAG
GTTTCTTTGAAATGAAGCTAAAGCAATGC
VIC 55 126-158 18
OarFCB128 ATTAAAGCATCTTCTCTTTATTTCCTCGC
CAGCTGAGCAACTAAGACATACATGCG
6FAM 56 96-130 2
HUJ616 TTCAAACTACACATTGACAGGG
GGACCTTTGGCAATGGAAGG
PET 58 114-160 13
OarHH47 TTTATTGACAAACTCTCTTCCTAACTCCACC
GTAGTTATTTAAAAAAATATCATACCTCTTAAGG
NED 56 130-152 18
ILSTS11 GCTTGCTACATGGAAAGTGC
CTAAAATGCAGAGCCCTACC
6FAM 61 256-294 9
DYMS1 AACAACATCAAACAGTAAGAG
CATAGTAACAGATCTTCCTACA
NED 56 159-211 20
BM8125 CTCTATCTGTGGAAAAGGTGGG
GGGGGTTAGACTTCAACATACG
NED 52 110-130 1
OarFCB226 CTATATGTTGCCTTTCCCTTCCTGC
GTGAGTCCCATAGAGCATAAGCTC
VIC 58 119-153 2
OarAE129 AATCCAGTGTGTGAAAGACTAATCCAG
GTAGATCAAGATATAGAATATTTTTCAACACC
6FAM 56 133-159 5
OarJMP29 GTATACACGTGGACACCGCTTTGTAC
GAAGTGGCAAGATTCAGAGGGGAAG
PET 56 96-150 24
SRCRSP9 AGAGGATCTGGAAATGGAATC
GCACTCTTTTCAGCCCTAATG
6FAM 55 99-135 12
MAF214 GGGTGATCTTAGGGAGGTTTTGGAGG
AATGCAGGAGATCTGAGGCAGGGACG
6FAM 58 174-282 16
OarCP34 GCTGAACAATGTGATATGTTCAGG
GGGACAATACTGTCTTAGATGCTGC
PET 57 112-130 3
OarFCB304 CCCTAGGAGCTTTCAATAAAGAATCGG
CGCTGCTGTCAACTGGGTCAGGG
VIC 58 150-188 19
MAF209 GATCACAAAAAGTTGGATACAACCGTGG
TCATGCACTTAAGTATGTAGGATGCTG
VIC 65 109-135 17
MAF65 AAAGGCCAGAGTATGCAATTAGGAG
CCACTCCTCCTGAGAATATAACATG
NED 56 123-163 15
a
tail sheep), purbalingga sheep (thin tail sheep) and then batur and jember sheep (fat tail sheep) showed that exactly Indonesian sheep populations were distinct (Table 7; Figure 3). Garut sheep population (fight and meat types) and jember
sheep population (fat tail type) had a distant of genetic tree, whereas the closest genetic distance was found in both garut sheep population, namely fighting and meat types sheep populations.
Genetic tree in five Indonesian sheep Figure 1. PCR Product Example of DNA Microsetellite MAP214 Locus by 1.5% Agarose Gel Electrophoresis. M: Marker 100 bp; Line 1-14 : Sample number
populations showed distinctive from others. Garut sheep groups (fights and meat types) showed that genetic distance are closer to purbalingga sheep compared to jember sheep population. A genetic
distance among Indonesian sheep populations was supported by the average genetic differentiation (FST) (7.12%). Other studies reported that average genetic differentiation (FST) 7% found in Spanish Table 3. Number Af allele (NA) and Number Effective of Allele (NE) for 17 Loci in Indonesian Sheep Population
Locus Total Sample*) Number of Allele
(Na)
Effective Number of Allele (Ne)
ILSTS05 193 9 2.1
MCM527 188 13 4.4
SRCRSP5 188 6 2.4
OARFCB128 193 9 5.3
HUJ616 193 14 2.8
ILSTS11 185 7 2.3
SRCRSP9 193 7 2.9
DYMS1 182 15 4.9
BM8125 184 6 2.2
OARFCB226 182 16 3.6
OARAE129 185 10 3.2
OARJMP29 185 10 2.5
MAF214 195 10 2.9
OARCP34 181 7 3.4
OARFCB304 192 18 7.9
MAF209 192 14 5.4
MAF65 178 9 4.0
Mean 187.5 10.6 3.7
St. Dev - 3.7 1.5
*) total sample each locus analyzed from 200 samples
Table 4. Mean Number of Allele (MNA) and Mean Number Effective of Allele (MNE) for 17
Loci in Five Indonesian Native Sheep Populations
Population Total Sample*) MNA MNE
Garut-1 37 6.4 ± 2.21 2.7 ± 0.84
Garut-2 38 6.2 ± 2.09 3.1 ± 1.09
Purbalingga 37 6.4 ± 2.37 3.1 ± 1.24
Batur 38 6.4 ± 2.26 3.2 ± 1.41
Jember 38 6.5 ± 2.45 3.7 ± 1.58
*)
sheep (Arranz et al., 2001), 6.98% in meat type sheep China (Chen et al., 2009) and 5.7% in European sheep (Peter et al., 2007). These results showed that genetic differentiation values in Indonesian sheep population higher than Spanish sheep population, China's meat type sheep population and European sheep population,
respectively.
A certainty, DNA microsatellite marker was very useful in the study of genetic diversity, genetic differentiation, and genetic tree. It can be applied widely in livestock, including Indonesian sheep population, i.e. garut sheep including garut sheep as fighting and meat types, batur sheep,
Table 5
.
Mean and Standard Deviation of Observed (H
o) and Expected (H
e) Heterozygosity for
17 Microsatellite Loci in Indonesian Native Sheep
Population Total Sample*) H
o He
Garut-1 37 0.5389 ± 0.1507 0.6084 ± 0.1062
Garut-2 38 0.5674 ± 0.1509 0.6353 ± 0.1207
Purbalingga 37 0.5640 ± 0.1593 0.6465 ± 0.1173
Batur 38 0.5432 ± 0.2028 0.6242 ± 0.1682
Jember 38 0.6559 ± 0.2011 0.6759 ± 0.1418
Total 188 0.5749 ± 0.1236 0.6878 ± 0.1065
*)
Total sample each population success analyzed from 40 samples
Table 6.
FIS,
FITand
FSTfor 17 Loci in Indonesian Sheep Population
Locus FIS FIT FST
ILSTS05 0.0788 0.1372 0.0634
MCM527 0.0051 0.0832 0.0785
SRCRSP5 0.5304 0.5607 0.0645
OARFCB128 0.0558 0.1629 0.1135
HUJ616 0.1203 0.1559 0.0405
ILSTS11 0.0544 0.1365 0.0868
SRCRSP9 0.0356 0.1201 0.0876
DYMS1 0.0513 0.1080 0.0598
BM8125 0.0649 0.1192 0.0580
OARFCB226 -0.0382 0.0174 0.0536
OARAE129 0.2527 0.3125 0.0800
OARJMP29 -0.0314 0.0063 0.0366
MAF214 0.1054 0.1579 0.0587
OARCP34 0.0886 0.1591 0.0773
OARFCB304 0.1496 0.2084 0.0692
MAF209 0.0910 0.1506 0.0655
MAF65 0.1483 0.2346 0.1013
a sheep, batur sheep and jember sheep population to ensure continuity of animal genetic resources in the future.
CONCLUSION
Indonesian sheep populations have a high genetic diversity in garut sheep, purbalingga sheep, batur sheep and jember sheep populations. This result indicated can be used as basic information for utilization, conservation and genetic improvement programs in Indonesian sheep population breeds.
ACKNOWLEDGMENTS
Authors thank to IAEA (International Atomic Energy Agency) for funding this research
(contract number: CRP D.3.10.25). Authors also thank to Prof. Han Jianlin for genotyping analysis in Laboratory of Livestock and Forage Genetic Resources, CAAS-ILRI JLLFGR Beijing, China. Finally, authors thank to Eryk Andreas, MSc for assisting in data analysis.
REFERENCES
Arora, R., S. Bhatia and A. Jain 2010. Morphological and genetic characterization of Ganjam sheep. Anim. Genet. Resour. 46:1-9.
Arranz, J. J., Y. Bayon., and F. S. Primitivo. 2001. Genetic variation at microsatellite loci in Spanish sheep. Small Rum. Res. 39:3-10. Baumung, R., H. Simianer, and I. Hoffmann.
2004. Genetic diversity studies in farm animals - a survey. J. Anim. Breed. and Genet. 121:361–73.
Boyce, W. M., P. W. Hedrick, N. E. M. Cockett, S. Kalinowski, M. C. Penedo and R. R. Ramey. 1996. Genetic variation of major histocompatibility complex and microsatellite loci: a comparison in Bighorn sheep. Genet. 145:42-433. Production in the Tropics. England, Longman Group Ltd.
FAO, 1998. Secondary Guidelines for Development of National Farm Animal Genetic Resources Management Plans: Measurement of Domestic Animal Diversity (MoDAD): Recommended Microsatellite
Table 7. Genetic Distance of Five Indonesian Native Sheep Populations
Population Purbalingga Jember Garut-1 Garut-2 Batur
Purbalingga 0.8607 0.8680 0.8628 0.8421
Jember 0.1500 0.7557 0.7630 0.7620
Garut-1 0.1415 0.2801 0.9372 0.8271
Garut-2 0.1476 0.2705 0.0649 0.8424
Batur 0.1719 0.2719 0.1899 0.1715
Nei's genetic identity (above diagonal) and genetic distance (below diagonal)
Figure 3. Dendrogram of Genetic Tree in Indonesian Sheep by using UPGMA Method, (p): Branching Distance Value in Percentage
Markers. Food and Agriculture Organization, Rome.
Goldstein, D.B. and D. D. Pollock. 1997. Launching microsatellites: a review of mutation processes and methods of phylogenetic inference. J. Hered. 88:335-342. Inounu, I., Subandriyo, N. Tomas, P. Sitorus, and
M. Bell. 1986. Lambing characteristic of Javanese Thin-Tail ewe at Cicadas Experiment Station and under Vellage condation. J. Anim. Sci. 2:79-82.
Mason, I. L. 1980. Prolific tropical sheep FAO. Animal Production and Health Paper. FAO. Rome 17:65-74.
Mburu, D. and O. Hanotte. 2005. A practical approach to microsatellite genotyping with special renference to livestock population genetics. ILRI Nairobi, Kenya.
Nei, M., F. Tajima and Y. Tateno. 1983. Accuracy of estimated phylogenetic trees from
molecular date. J. Mol. Biol. and Evol. 19:153-170.
Peter, C., M. Bruford, T. Perez, S. Dalamitra, G. Hewitt and G. Erhardt. 2007. Genetic diversity and subdivision of 57 European and Middle-Eastern sheep breeds. Anim. Genet. 38:37-44.
Raymond, M. and F. Rousset. 2001. Genepop (3.3). Population Genetics Software for Exact Tests and Ecumenicism (EB/OL) (http:www:wbiomed.curtin.edu.au/ genepop). Romjali, E., V. S. Pandey, R.M. Gatenby, M.
Doloksaribu, H. Sakul and A. Verhulst. 1998. Genetic resistence of different genotype of sheep to natural infections with gastro-intestinal nematodes. Anim. Sci. 64:97-104. Sutama, I.K., T. N. Edey and I.C. Fletcher. 1988.