–
Full Length Research Paper
Genetic diversity study of indigenous cattle (Gir and
Kankrej) population of Rajasthan using microsatellite
markers
Mona Upreti
1, Farah Naz Faridi
2*, S. Maherchandani
3, B. N. Shringi
4and
S. K. Kashyap
5Department of Veterinary Microbiology and Biotechnology, Rajasthan University of Veterinary and Animal Sciences, Bikaner, 334001, Rajasthan, India.
Accepted 30 November, 2012
The genetic diversity study of native Gir and Kankrej (Bos indicus) cattle populations were evaluated using nine microsatellite markers (ETH-225, CSRM-60, HEL-9, INRA-005, ETH-10, HAUT-24, BM1818, ILSTS-002 and ILSTS-006) suggested by FAO (ISAG). A total of 60 cattle were sampled from different places of local Rajasthan region. For each, 30 individuals were sampled. The mean number of observed and effective alleles in Kankrej were high (5.222 and 3.714) comparatively and the average expected heterozygosity values (0.5403) indicated high diversity in the Kankrej population than Gir (0.4520). High polymorphism information content (PIC) values observed for most of the markers with an average of 0.5116 are indicative of high polymorphism of these markers in Kankrej breed than in Gir (0.4202), which showed high informativeness of all the microsatellite markers in Kankrej breed. Three microsatellites markers (HAUT24, BM1818 AND ILSTS006) did not show amplification in both breeds. INRA005 was the only markers amplified in Kankrej. The allele diversity (mean observed number of alleles was 6.11; mean effective number of alleles was 5.187) and gene diversity (0.2771) values implied a substantial amount of genetic variability in both populations. Reasonably high PIC values observed for most of the markers, with an average PIC value of 0.5116 across all the loci implied that this set of microsatellite are very informative for evaluation of genetic diversity in both the breeds. This informativeness of microsatellite markers showed it can be used for various applications like, conservation, disease diagnosis and polymorphism in different populations.
Key words: Genetic diversity, polymorphism information content (PIC), heterozygosity, polymorphism, marker.
INTRODUCTION
India is rich in farm animal diversity. It has diverse and unique cattle genetic resources which led to their domestication some 10, 000 years ago. These breeds have evolved over the years and gradually adopted themselves against the natural selection of various governing factors like nutrient supply, changing climatic conditions, predators and competition arising within the species. These subpopulations also underwent selection procedures imposed by men for food, fuel, clothing and
*Corresponding author. E-mail: [email protected]. Tel: 91151-2544158
.
draught purposes. Various forms of selective pressures related to adaptation in the local environment led to the shaping of entirely new species. According to National Bureau of Animal Genetic Resources (NBAGR) there are 30 well documented cattle breeds in India based on phenotypic characterization. The western part of India is endowed with excellent cattle breeds viz., Gir as a milch, while Kankrej as dual-purpose cattle breeds. So, these breeds need to be investigated at the genome level to study their genetic diversity.
established during the process of natural selection of these populations (Notter, 1999). According to Hanotte and Jianlin (2005), countries doing intensification and industrialization of agricultural practices (developing countries) are leading to the extinction of native livestock species by cross breeding them. This resulted in the dramatic loss of many documented breeds especially in developing and underdeveloped countries and many more breeds are at the risk and will be lost without even having been adequately characterized or studied. Around 16% of them have become extinct and 15% are considered as rare (FAO, 2000). Hence, there is an urgent need to prevent the rapid erosion of animal genetic resources.
Serious efforts for conservation and evaluation strategies for effective management of domestic animal breeds should be made based on potential use of molecular information in breed conservation, so that full potential of livestock biodiversity is realized leading to improved human health and nutrition and expanded opportunities for livelihood diversification.
Genetic characterization can be done by various methods such as cytogenetic, biochemical and molecular techniques. Microsatellites are the choice of markers (FAO, 2007) and are easily transferred across ungulate taxa, being widely and successfully applied in conservation studies (Slate et al., 1998; Maudet et al., 2002). Mukesh et al. (2009), Pandey et al. (2006), and Chaudhari et al. (2009) used microsatellite markers for assaying native cattle breeds from different regions of India. Similarly, Kankrej cattle breed of Rajasthan (Sodhi et al., 2007), Ongole and Deoni (Metta et al., 2004), Krishna Valley, Ongole breed of cattle (Karthickeyan et al., 2006, 2008) respectively, Siri cattle (Sharma et al., 2008) were also genetically characterized. Kul et al. (2011) determined genetic distance among ruminant species (cattle, goat and sheep) using microsatellite loci whereas population studies for cattles were performed by 16 polymorphic STR loci by Van de Goor et al. (2011).
However, these indigenous breeds are already characterized at physical and production level. The present status and declining trend in the populations of these breeds in Rajasthan need be given the assessment at the molecular level. Hence, the present research work was carried out to study the genetic diversity between Gir, and Kankrej cattle breeds using microsatellite markers.
MATERIALS AND METHODS
Sampling and DNA extraction
A total of 30 blood samples each from Gir and Kankrej cattle breeds were collected. All the animals were randomly selected, genetically unrelated and the information was collected after consulting pedigree records maintained and interviewing the owners in detail. Gir blood samples were collected from Vallabhnagar (Udaipur) and Rawatbhata from various owners in village. Kankrej blood samples
were collected from a local Kankrej farm in Barmer in Rajasthan. Genomic DNA was isolated using the rapid salt extraction method (Aljanabi and Martinez, 1997) with some modifications. The evaluation of quality and purity of DNA was done through agarose gel electrophoresis and ultraviolet (UV) spectrophotometer. Nine microsatellites (Table 1) were chosen from the available list of 30 microsatellite for genetic diversity study.
PCR reaction was carried out in a final reaction volume of 50 µl in a thermal cycler. The annealing temperature for various markers was optimized as in Table 2. Optimization of microsatellite was carried out according to the microsatellite which is approximately 3 µl for all the microsatellites.
The polymorphic typing of microsatellite marker was done using polyacrylamide gel electrophoresis (PAGE). For typing microsatellites, 8% native PAGE (Hoefer SE 600 series electrophoresis unit) was used. Manual genotyping of animals silver staining of gel (Benbouza et al., 2006) was done. The allele and genotype frequencies were scored by counting the bands using UVP Doc-It®LS Image Acquisition Software version 6.3.3. The
average heterozygosity and PIC were calculated with appropriate equations for all markers loci.
Data analysis
Effective number of alleles
The measure explain about the number of alleles that would be expected in a locus in each population (Nassiry et al., 2009).
Ae =
(
1
/
2)
The probability that any randomly chosen individual is heterozygous for any two alleles at a marker locus having allele frequencies pi, is
defined as heterozygosity. Thus, heterozygosity = 2
1
is the homozygosity (Hildebrand et al., 1992). Direct count (DC) heterozygosity (Machado et al., 2003) was obtained as:N observed heterozygosity, and the average direct count of heterozygosity over all loci in each tested breed is less than the expected heterozygosity (El Nahas et al., 2008).
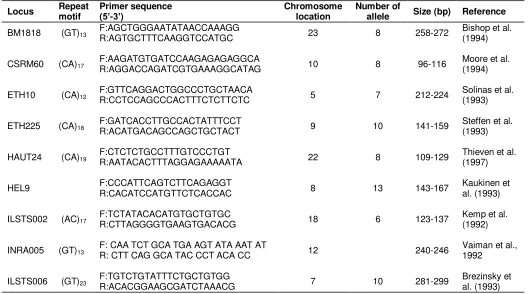
Table 1. Microsatellite markers.
Locus Repeat motif Primer sequence (5’-3’) Chromosome location Number of allele Size (bp) Reference
BM1818 (GT)13 F:AGCTGGGAATATAACCAAAGG R:AGTGCTTTCAAGGTCCATGC 23 8 258-272 Bishop et al. (1994)
CSRM60 (CA)17 F:AAGATGTGATCCAAGAGAGAGGCA R:AGGACCAGATCGTGAAAGGCATAG 10 8 96-116 Moore et al. (1994)
ETH10 (CA)12 F:GTTCAGGACTGGCCCTGCTAACA R:CCTCCAGCCCACTTTCTCTTCTC 5 7 212-224 Solinas et al. (1993)
ETH225 (CA)18 F:GATCACCTTGCCACTATTTCCT R:ACATGACAGCCAGCTGCTACT 9 10 141-159 Steffen et al. (1993)
HAUT24 (CA)19 F:CTCTCTGCCTTTGTCCCTGT R:AATACACTTTAGGAGAAAAATA 22 8 109-129 Thieven et al. (1997)
HEL9 F:CCCATTCAGTCTTCAGAGGT 8 13 143-167 Kaukinen et
al. (1993) R:CACATCCATGTTCTCACCAC
ILSTS002 (AC)17 F:TCTATACACATGTGCTGTGC R:CTTAGGGGTGAAGTGACACG 18 6 123-137 Kemp et al. (1992)
INRA005 (GT)13 F: CAA TCT GCA TGA AGT ATA AAT AT R: CTT CAG GCA TAC CCT ACA CC 12 240-246 Vaiman et al., 1992
ILSTS006 (GT)23 F:TGTCTGTATTTCTGCTGTGG R:ACACGGAAGCGATCTAAACG 7 10 281-299 Brezinsky et al. (1993)
Table 2. Annealing temperatures for various marker loci.
Locus Annealing temperature (°C)
Marked Optimized
INRA 005 58 58
CSRM 60 54 54
ETH 10 58 58
ETH 225 60 58
BM1818 58 55
HEL 9 52 52
ILSTS 002 52 54
ILSTS 006 54 55
HAUT 24 55 55
Polymorphism information content
PIC was calculated following formula (Botstein et al., 1980):
ni i n
i
n
i i
i
p
p
p
PIC
1 4
1
2
1 2 2
1
(
)
Where, pi = frequency of the marker allele, ai and n= number of
different alleles.
RESULTS
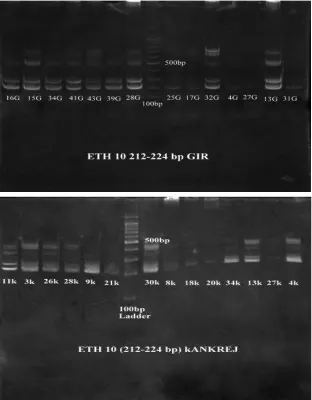
The number of alleles, size range of alleles, direct count heterozygosity, and Hardy Weinberg heterozygosity is given individually for the two breeds in Table 3 and combined in Table 4. This shows the genetic diversity data for both Gir and Kankrej. Number of alleles varies from 7 (ILSTS 002) to 12 (CSRM 60, ETH 225) with little difference between the cattle breeds. Microsatellite ETH 10 allele profiles of Gir and Kankrej on PAGE is given in Figure 1.
The mean observed and effective numbers of alleles were found to be 6.11 and 5.187, respectively across all loci studied. Direct count heterozygosity was found to be maximum for INRA005 (0.7142) and minimum for ILSTS002 (0.3571). The average direct count heterozygosity across all the loci was 0.4364. The Hardy-Weinberg heterozygosity was maximum for INRA 005 (0.9006) and minimum for ILSTS002 (0.8046) across all the loci studied within both the breeds. The average Hardy-Weinberg heterozygosity was found to be 0.2771. INRA005 was found to be highly informative with the highest PIC value (0.8945). The least informative marker was ILSTS002 (0.7784). The mean of all PIC values was 0.5323.
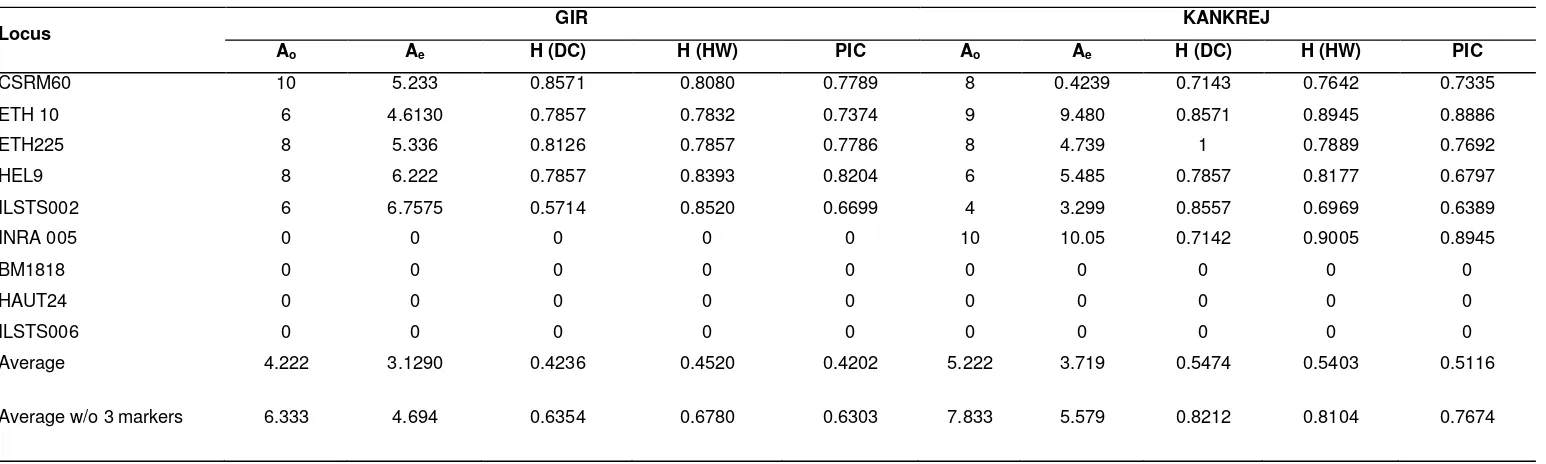
Table 3. Direct count heterozygosity H (DC) and Hardy-Weinberg heterozygosity H (HW) and PIC values for and Gir and Kankrej breeds of cattle.
Locus GIR KANKREJ
Ao Ae H (DC) H (HW) PIC Ao Ae H (DC) H (HW) PIC
CSRM60 10 5.233 0.8571 0.8080 0.7789 8 0.4239 0.7143 0.7642 0.7335
ETH 10 6 4.6130 0.7857 0.7832 0.7374 9 9.480 0.8571 0.8945 0.8886
ETH225 8 5.336 0.8126 0.7857 0.7786 8 4.739 1 0.7889 0.7692
HEL9 8 6.222 0.7857 0.8393 0.8204 6 5.485 0.7857 0.8177 0.6797
ILSTS002 6 6.7575 0.5714 0.8520 0.6699 4 3.299 0.8557 0.6969 0.6389
INRA 005 0 0 0 0 0 10 10.05 0.7142 0.9005 0.8945
BM1818 0 0 0 0 0 0 0 0 0 0
HAUT24 0 0 0 0 0 0 0 0 0 0
ILSTS006 0 0 0 0 0 0 0 0 0 0
Average 4.222 3.1290 0.4236 0.4520 0.4202 5.222 3.719 0.5474 0.5403 0.5116
Average w/o 3 markers 6.333 4.694 0.6354 0.6780 0.6303 7.833 5.579 0.8212 0.8104 0.7674
value (0.4236) across all the loci indicates substantial and very good number of heterozygotes in the population. Similarly, maximum Hardy-Weinberg heterozygosity was observed for ILSTS002 (0.8520) and minimum was observed for ETH10 (0.7832), with an average of 0.4520. The highest PIC value (0.8204) was observed at HEL9 locus and least (0.6699) at ILSTS002 locus for Gir cattle. Reasonably high PIC values were observed for most of the markers with an average of 0.4202.
In Kankrej, maximum direct count
Heterozygosity was observed for ETH 225 (1) and minimum for INRA005 (0.7142). The average of H (DC) was found to be 0.5474, maximum Hardy-Weinberg heterozygosity was observed for INRA005 (0.9005) and minimum for ILSTS002 (0.6969), with an average of 0.5403. The highest
PIC value (0.8945) was observed at INRA005 locus and least (0.6389) at ILSTS002 locus for the Kankrej, with an average of 0.5116.
Three markers HAUT 24, BMI8I8 and ILSTS 006 were not amplified in both Gir and Kankrej.
DISCUSSION
In the present study, genetic polymorphism of Gir and Kankrej was analyzed using nine microsatellite markers. Six microsatellites were amplified in both the breeds. The amplification by CSRM 60, ETH 10, ETH 225, ILSTS 002 and INRA 005 are in accordance with the results reported by Kale et al. (2010). Marker INRA005 was amplified only in Kankrej. Hence, this marker can be used as a breed specific marker for Kankrej cattle breed. The rest three microsatellite
Table 4. Genetic diversity data of nine microsatellites in Gir and Kankrej.
Locus Allele number Allele size range (bp) H (DC) H (HW) PIC
Ao Ae Minimum Maximum
CSRM 60 12 5.398 95 160 0.3928 0.8147 0.7892
ETH 10 11 7.546 200 295 0.3928 0.8674 0.8523
ETH 225 12 8.377 130 195 0.4464 0.8806 0.8697
HEL 9 9 7.875 140 195 0.3928 0.8731 0.8617
ILSTS 002 7 5.117 145 200 0.3571 0.8046 0.7784
INRA 005 10 10.05 135 180 0.7142 0.9006 0.8945
BM1818 0 0 0 0 0 0 0
HAUT 24 0 0 0 0 0 0 0
ILSTS 006 0 0 0 0 0 0 0
Average 6.11 5.187 0.4364 0.2771 0.5323
heterozygosity was found to be 0.2771, hence both the populations showed moderate gene diversity. INRA005 was found to be highly informative in both breeds (PIC=0.8945) and ILSTS002 was least informative (PIC= 0.7784). Hence, reasonably high PIC values were observed for most of the markers, with an average PIC value of 0.5323 across all the loci which are indicative of the usefulness of these microsatellites for biodiversity evaluation in these breeds.
Amplification using the established primer from ILSTS006, BM1818, and HAUT 24 was not successful in both breeds of cattle but in Rathi and Tharparkar breed where these markers were amplified (Sodhi et al., 2006). This shows the absence of the STS loci in both genomes.
DNA sequences flanking microsatellites are conserved
within the Bovidae family. In sheep and goats, 63% primer sequences of cattle are conserved (Kemp et al., 1995) and 75% are conserved in bubaline genome (Navani et al., 2002). There was a significant number of heterozygotes at many loci as indicated by H (DC) values for Gir and Kankrej. This shortage of homozygotes and excess of heterozygotes in the population is helpful in the genetic diversity study and also absence of number of factors, namely sample relatedness, population heterogeneity or null alleles. Thus, this showed more heterogeneity and more variability and thus this population is at a lesser risk of extinction and their germplasm can be used as a reference for future comparative study. The results can be useful in the development of breeding strategy for genetic improvement study. (2006).Optimization of a reliable, fast, cheap and sensitive silver staining method to detect SSR markers in polyacrylamide gels. Biotechnol. Agron. Soc. Environ. 10(2):77-81.
Bishop MD, Kappe SM, Keele JW , Stone RT, Sunden SLF, Hawkins GA, Toldo SS, Fries R, Grosz MD, Yoo J, Beattlie CW (1994). A genetic linkage map for cattle .Genetics.136:619-639.
Botstein D, White RL, Skolnick M, Davis RW (1980).Construction of a genetic linkage map in man using restriction fragment length polymorphisms. Am. J. Hum. Genet. 32:314-331.
Brezinsky LS, Kemp J, Teale AJ (1993). ILSTS006: a polymorphic bovine microsatellite. Anim. Genet. 24:73.
Chaudhari MV, Parmar SNS, Joshi CG, Bhong CD, Fatima S, Thakur MS, Thakur SS(2009).Molecular characterization of Kenkatha and Gaolao (Bos indicus) cattle breeds using microsatellite markers. Anim. Biodivers. Conserv. (32)2:71-76.
El Nahas SM, Hassan A A, Mossallam AAA, Mahfouz ER, Bibars MA, Oraby HAS, de Hondt HA (2008). Analysis of genetic variation in different sheep breeds using microsatellites. Afr. J. Biotechnol. 7(8):1060-1068.
Food and Agricultural Organization of the United Nations (2000).Global project for the maintenance of domestic animal genetic diversity (MoDAD).
Hanotte O, H Jianlin (2005) .Genetic characterization of livestock populations and its use in conservation decision-making. In: FAO (2005a).131-136.
Hildebrand CE, Torney DC, Wagner RP (1992). Informativeness of Polymorphic DNA markers. Los Alamos Sci. 20:100-102.Genet. 33:149-54.
Kale DS, Rank DN, Joshi CG, Yadav BR, Koringa PG, Thakkar KM, Tolenkhomba TC, Solanki JV(2010).Genetic diversity among Indian Gir, Deoni and Kankrej cattle breeds based on microsatellite markers. Indian J. Biotechnol. 9:126-130.
Karthickeyan SMK , Saravanan R ,Thangaraju P(2006). Characterization of Krishna Valley breed of cattle (Bos indicus) in south India using microsatellite markers. Livest. Res. Rural Dev. 18 (11).
Karthickeyan SMK, Kumarasamy P, Sivaselvam SN, Saravanan R, Thangaraju P (2008).Analysis of microsatellite markers in Ongole breed of cattle. Indian J. Biotechnol. (7):113-116.
Kaukinen J, Varvio SL (1993).Eight polymorphic bovine microsatellites. Anim. Genet. 24:148.
Kemp SJ, Brezinsky L, Teale AJ (1992).ILSTS002- A polymorphic bovine microsatellite. Anim. Genet. 23:18.
Kemp SJ, Hishida O, Wambugu J et al., (1995). A panel of polymorphic bovine, ovine and caprine microsatellite markers.Anim. Genet. 26:299-306.
Kul BC, Ertugrul O (2011).Determination of genetic distinction among ruminant species and individuals using STRs and mtDNA. J Anim. Vet. Adv. 10(25):3375-3379.
Machado MA, Schuster I, Martinez ML, Campos AL (2003). Genetic Diversity of Four Cattle Breeds Using Microsatellite Markers.R. Bras. Zootec. 32(1):93-98.
Maudet C, Luikart G, Taberlet P (2002).Genetic diversity and assignment tests among seven French cattle breeds based on microsatellite DNA analysis. Anim. Sci. 80:942-50
Metta M, Kanginakudru S, Gudiseva N, Nagaraju J (2004). Genetic characterization of the Indian cattle breeds, Ongole and Deoni (Bos indicus) using microsatellite markers – a preliminary study. BMC Genet. 5:16.
Moore SS ,Byrne K, Berger KT, Barendse W, McCarthy F, Womack JE, Hetzel DJS (1994). Characterization of 65 bovine microsatellites. Mamm.Genome.5: 84-90.
Mukesh M, Sodhi M, Kataria RS, Mishra BP (2009). Use of microsatellite multilocus genotypic data for individual assignment assay in six native cattle breeds from north-western region of India. Livest. Sci.(121)1:72-77.
Nassiry MR, Javanmard A, Tohidi R(2009). Application of statistical procedures for analysis of genetic diversity in domestic animal populations. Am. J. Anim. Vet. Sci. 4 (4):136-141.
National Bureau of Animal Genetic Resources. Annual Report 2002-03.Karnal, India. NBAGR, 2003.
Navani N, Jain PK, Gupta S, Sisodia BS, Kumar S (2002). A set of cattle microsatellite DNA markers for genome analysis of riverine buffalo (Bubalus bubalis) International Society for Animal Genetics, Anim. Genet. 33:149-154.
Nei M (1973).Analysis of Gene Diversity in subdivided populations. Proc. Nat. Acad. Sci.70 (12: I):3321-3323.
Nei M (1978). Estimation of average heterozygosity and genetic distance from a small number of individual. Genet. 89:583-590. Notter DR (1999).The importance of genetic diversity in livestock
populations of the future. J. Anim. Sci. 77: 61-69.
Pandey AK, Sharma R, Singh Y, Prakash BB, Ahlawat SPS (2006). Genetic diversity studies of Kherigarh cattle based on microsatellite markers. J. Genet. 85:117-122.
Sharma R, Pandey AK, Singh Y, Mishra BP, Singh PK , Singh G (2008).Estimation of genetic diversity in Siri cattle from India. Russ. J. Genet. 44(11):1331-1337.
Slate J, Coltman DW, Goodman SJ, MacLean I, Pemberton JM, Williams JL (1998). Bovine microsatellite loci are highly conserved in red deer (Cervus elaphus), sika deer (Cervus nippon) and Soay sheep (Ovis aries). Anim. Genet. 29: 307-315.
Sodhi M, Mukesh M, Prakash B, Ahlawat SPS, Sobti RC (2006). Microsatellite DNA typing for assessment of genetic variability in Tharparkar breed of Indian zebu (Bos indicus) cattle, a major breed of Rajasthan. J.Genet. 85 (3).
genetic diversity in Kankrej cattle. J. Appl. Anim. Res.(31) 2:153-158. Steffen P, Eggen A, Dietz AB (1993).Isolation and mapping of
polymorphic microsatellite in cattle. Anim. Genet. 24: 124.
The state of the world’s animal genetic resources for food and
agriculture (2007), FAO Rome.
Thieven U, Solinas-Toldo S, Friedl R, Masabanda J, Fries R, Barendse W, Simon D, Harlizius B (1997).Polymorphic CA-microsatellites for the integration of the bovine genetic and physical map. Mamm. Genome. 8:52-55.
Toldo SS, Fries R, Steffen P, Neiberg HL, Barendse W, Womack JE, Hetzel DJS, Stranzinger G (1993).Physically mapped, cosmid-derived microsatellite markers as anchor loci on bovine chromosomes. Mamm. Genome. 4:720-72.
Vaiman D, Osta R, Mercier D, Grohs C, Leveziel H (1992). Characterization of five new bovine microsatellite repeats. Anim. Genet.23:537.