i
DECLARATION
I, Ratna Mega Sari, hereby declare that the thesis entitled:
FACTORS INFLUENCING INDONESIAN COCOA EXPORT TO THE EUROPEAN UNION
Submitted to fulfill a requirement for the award of Master of Science in Agribusiness from Bogor Agricultural University Indonesia and Georg August University of Goettingen Germany in the framework of international joint degree program between both universities is my own work through the guidance of my academic advisors and to the best of my knowledge it has not been submitted for the award of any degree in any other academic institutions. This thesis does not contain any pieces of work of other person, except those are acknowledged and referenced herein.
Bogor, January 2013
iii
ABSTRACT
RATNA MEGA SARI, Factors Influencing Indonesian Cocoa Export to the European Union. Under direction ANDRIYONO KILAT ADHI, SUHARNO, andBERNHARD BRUEMMER
One of plantation commodity which is potentially developed in Indonesia is cocoa. Indonesia is the third largest exporter of cocoa bean after Ivory Coast and Ghana. Even though Indonesia is one of the biggest cocoa producer countries but only 1.07 percent of cocoa bean and 7.79 percent of cocoa butter and oil can enter European Union Market as the biggest cocoa consumer in the world. Based on that problem this paper will analyze what factors which can influence cocoa export of Indonesia to European Union and what policy implication can be conducted regarding to this condition.
Data processing was conducted by using stata which used panel data analysis with gravity model panel data. There are three models which can be estimated in panel data. This study deals with the flows of trade between Indonesia and Countries in European Union. Therefore the Fixed Effects will be a more appropriate model than random specification. The eleven importer countries are selected for the period 1996 - 2011.
Based on econometric results there are four significant variables that influence trade flows of cocoa code 1801 from Indonesia to European Union. Those are GDP of exporting country, population of exporting country, exchange rate and export tax. There is no significant variable which can explain trade flows of cocoa, code 1804 from Indonesia to European Union. It would be concluded that in this case gravity model is not the best model. The next research should consider the other variable which can explain the trade flows well.
v
ABSTRAK
RATNA MEGA SARI, Faktor-Faktor yang Mempengaruhi Ekspor Kakao Indonesia - Uni Eropa. Dibawah Bimbingan ANDRIYONO KILAT ADHI,
SUHARNO, danBERNHARD BRUEMMER
Kakao adalah salah satu komoditi perkebunan yang potensial dikembangkan di Indonesia. Indonesia merupakan negara eksportir kakao terbesar ke tiga di dunia setelah Pantai Gading dan Ghana. Meskipun Indonesia merupakan salah satu produsen kakao terbesar di dunia namun hanya 1.07 persen biji kakao dan 7.79 persen minyak dan mentega kakao yang dapat memasuki pasar Uni Eropa sebagai konsumen kakao terbesar di dunia. Berdasarkan permasalahan tersebut penelitian ini akan menganalisis faktor-faktor apa saja yang mempengaruhi ekspor kakao Indonesia ke Uni Eropa dan bagaimana implikasi kebijakan yang dapat dilakukan terkait dengan kondisi tersebut.
Pengolahan data dilakukan dengan menggunakan stata. Analisis yang dilakukan adalah analisis panel data dengan menggunakan model gravitasi. Terdapat tiga model yang bisa diestimasi dalam panel data. Penelitian ini menganalisis aliran perdagangan antara Indonesia dan Uni Eropa. Oleh karena itu FE (Fixed Effects) lebih tepat dari pada menggunakan RE (Random Effects). Sebelas negara importir dipilih pada periode tahun 1996 - 2011. Adapun kesebelas negara tersebut adalah Jerman, Perancis, Belanda, Inggris, Belgia, Italia, Spanyol, Austria, Hongaria, Polandia dan Republik Ceko.
Berdasarkan analisis ekonometrik, terdapat empat variabel signifikan yang mempengaruhi perdagangan kakao kode 1801 dari Indonesia ke Uni Eropa. Variabel-variabel tersebut adalah GDP negara eksportir, populasi negara eksportir, nilai tukar dan pajak ekspor. Pada kode kakao 1804, tidak terdapat variabel yang signifikan yang dapat menjelaskan aliran perdagangan kakao dari Indonesia ke Uni Eropa. Oleh karena itu dapat disimpulkan bahwa pada kasus ini model gravitasi bukan merupakan model yang terbaik. Penelitian selanjutnya sebaiknya mempertimbangkan variabel lain yang dapat menerangkan aliran perdagangan dengan baik.
vii
SUMMARY
RATNA MEGA SARI, Factors Influencing Indonesian Cocoa Export to the European Union. Under direction ANDRIYONO KILAT ADHI, SUHARNO, andBERNHARD BRUEMMER.
Indonesia is the third largest exporter of cocoa bean after Ivory Coast and Ghana. Even though Indonesia is one of the biggest cocoa producer countries but only 1.07 percent of cocoa bean and 7.79 percent of cocoa butter and oil can enter European Union Market as the biggest cocoa consumer in the world. Based on that problem this paper will analyze what factors which can influence cocoa export of Indonesia to European Union and what policy implication can be conducted regarding to this condition.
Data used is panel data from 1998 - 2011 including cocoa export value of Indonesia to eleven countries, GDP of exporter and importer countries, population of exporter and importer countries, exchange rate and physical distance. Data processing was conducted by using stata which used panel data analysis with gravity model panel data. There are three models which can be estimated in panel data. This study deals with the flows of trade between Indonesia and Countries in European Union. Therefore the FE will be a more appropriate model than random specification. The eleven importer countries are selected for the period 1998 -2011. Those countries are Germany, France, Netherlands, United Kingdom, Belgium, Italy, Spain, Austria, Hungary, Poland and Czech Republic
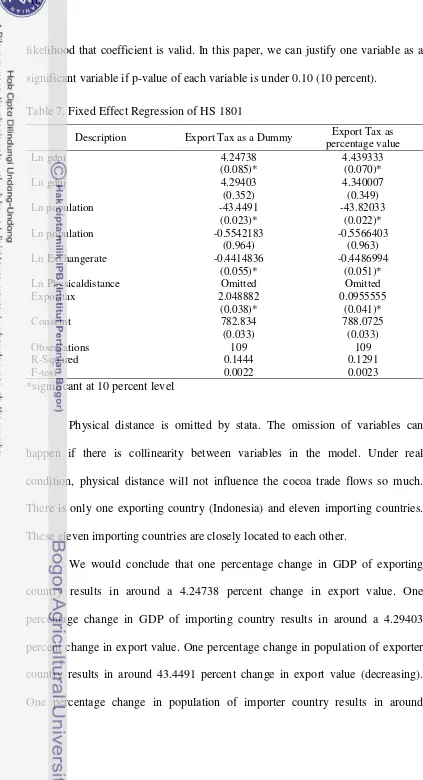
Based on econometric results there are four significant variables that influence trade flows of cocoa code 1801 from Indonesia to European Union. Those are GDP of exporting country, population of exporting country, exchange rate and export tax. There is no significant variable which can explain trade flows of cocoa, code 1804 from Indonesia to European Union. It would be concluded that in this case gravity model is not the best model. The next research should consider the other variable which can explain the trade flows well.
In case of export tax, this variable also significantly influences trade flows of Indonesia cocoa, code 1801 to European Union positively. Exchange rate has the same condition with export tax which is not consistent with general previous studies. In this case cocoa bean exporter should not be worry about applied export tax in the years later and exchange rate. In specific condition (European Union Market), those variables do not influence cocoa demand. Indonesia cocoa exporter can focus on optimizing potential market, searching the new buyer etc. In order to achieve this goal, exporters have to pay attention to requirement of European Union people to cocoa they consume. Requirement could be related to the safety and quality of cocoa entering to their market.
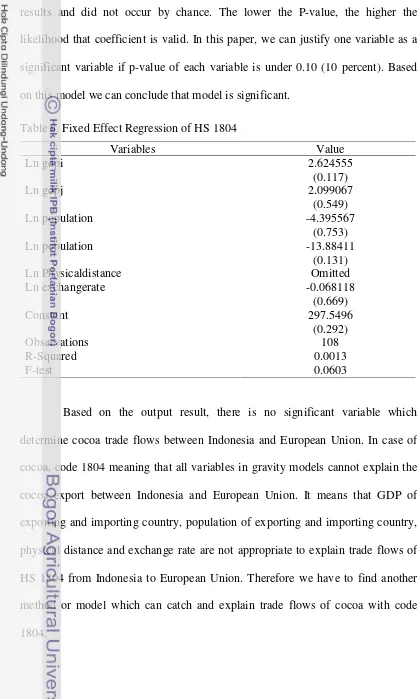
Based on the output result, there is no significant variable which can explain trade flows of cocoa, code 1804 from Indonesia to European Union. It would be concluded that in this case gravity model is not the best model. The next research should consider the other variable which can explain the trade flows well. The model has to include variable.
ix
Copyright© 2012. Bogor Agricultural University All Right Reserved
1. No part or all of this thesis maybe excerpted without inclusion and mentioning the sources.
a. Excerption only for research and education use, writing for scientific papers, reporting, critical writing or reviewing of a problem.
b. Excerption does not inflict a financial loss in the proper interest of Bogor Agricultural University.
xi
FACTORS INFLUENCING INDONESIAN COCOA EXPORT
TO THE EUROPEAN UNION
RATNA MEGA SARI
A thesis
Submitted to the Graduate School in Partial Fulfillment of the Requirement for Master of Science Degree in Agribusiness
GRADUATE SCHOOL
BOGOR AGRICULTURAL UNIVERSITY
BOGOR
xiii
Thesis Tittle : Factors Influencing Indonesian Cocoa Export to the European Union
Name : Ratna Mega Sari
NRP : H451100071
Mayor : Agribusiness
Approved by
Advisory Committee
Agreed by
Examination Date : Submission Date :
Dr. Ir. Andriyono Kilat Adhi Chairman
Dr. Ir. Suharno, M.Adev. Member
Prof. Dr. Bernhard Bruemmer Member
Coordinator of Major Agribusiness
Prof. Dr. Rita Nurmalina, MS.
Dean of Graduate School
xv
ACKNOWLEDGEMENT
This research would have been impossible without the support from many people. I would like to appreciate everything they have given to me. First of all, all praise to God, who the most precious and the most merciful for His blessing from the first until the last step of the research process. I would like to acknowledge the support of the National Education Ministry of Indonesia for funding my study in Germany.
I would acknowledge my supervisors in Indonesia, Dr. Ir. Andriyono Kilat Adhi and Dr. Ir. Suharno, M. Adev from Bogor Agricultural University Indonesia, for their support and their insight to my research and my study. I also thank to Dr. Amzul Rifin S.P. M.A. and as examiners in my final examination for their constructive critics and comments. I am indebted to my supervisor in Germany Prof. Dr Bernhard Bruemmer from Goettingen University, who supports me academically and mentally in thesis writing from the beginning until the last step. I would like also to thank for their insight and his constructive criticism of my thesis.
My Special thank to my husband Efri Junaidi, Mas Rangga, Ratna SS, Krystal Lin, Pak Samsul, Mas Iqbal, Ria, Mas Adnan, Bang Firman, Mba Ira, Ulf Roemer, and Dek Am for discussion and proof reading this thesis. My sincere thank further to all my friends and family in SIA program and in Goettingen Indonesian Student Community, especially for the ‘Roko Jaya Family’ for providing me a friendly and warm environment during my study in Goettingen. Finally I would like to thank my family for their love and their support for me. I dedicate this work to my beloved mothers and fathers who always pray for me and give me their love and taught me the values of life.
Bogor, January 2013
AUTOBIOGRAPHY
Ratna Mega Sari, the author of this thesis, was born in Dumai, on 16th of August 1987. She completed her primary education in 1999 at SDN 002 Pangkalan Sesai Dumai Barat. She did her Junior high school at SLTPN 4 Dumai in 2002 and completed her senior high school at SMAN 2 Dumai in 2005. She spent her bachelor degree in Bogor Agricultural University with major Agribusiness. She got her B.A in 2009 supported by Dumai Government.
She was active in some organizations during her study period in Bachelor degree such as DKM Al-hurriyah, HIPMA IPB, FORCES IPB and IKPMR. She participated in some paper competition and being a winner in some events. In 2009, She got scholarship to be a participant of IELSP (Indonesian English Languange Study Program) in Ohio University, United States of America.
xvii
1.4. Significance of the Research ... 7
II. LITERATURE REVIEW ... 9
2.1. International Trade of Indonesia Cococa ... 9
2.2. Gravity Models of Trade... 11
2.3. Gross Domestic (GDP), Population, Physical Distance, Exchange Rates, and Export Tax ... 15
2.3.1. Gross Domestic Product ... 15
3.1. Theory of International Trade on Indonesian Cocoa ... 19
3.2. International Demand and Supply of Cocoa... 23
3.3. Export Import Theory... 25
4.4.1. Model Formulation of HS 1801 (Cocoa Beans, Whole Or Broken, Raw or Roasted... 35
4.4.2. Model Formulation of HS 1804 (Cocoa Butter, Fat and Oil ... 36
V. DESCRIPTION OF INDONESIAN COCOA... 39
5.1. Development of Indonesian Cocoa... 39
5.3. Cocoa Development Policy in Indonesia ... 40
VI. RESULT AND DISCUSSION... 45
6.1. HS 1801 (Cocoa Beans, Whole or Broken, Raw or Roasted).. 45
6.2. HS 1804 (Cocoa Butter, fat, and Oil)... 51
VII. CONCLUSION, POLICY AND RESEARCH OUTLOOK... 53
REFERENCES ... 55
xix
LIST OF TABLES
Number Page
1. Export and Import of Cocoa and Cocoa’s
Processing In Indonesia ... 4
2. The Progression of Cocoa Consumption in 2001/2002 -2006/2007 ... 5
3. Absolute Advantages ... 19
4. Comparative Advantages ... 20
5. Sources of Data ... 29
6. Budget Recapitulation of Cocoa Program for Three Years 2009 - 2011 ... 41
7. Fixed Effect Regression of HS 1801 ... 46
LIST OF FIGURES
Number Page
1. Gross Domestic Product on The Basis of Constant Price
in 2000 According to Sector in 2004 - 2008 ... 1
2. Export Value of Indonesian Plantation Commodity
in 2004 -2008... 2
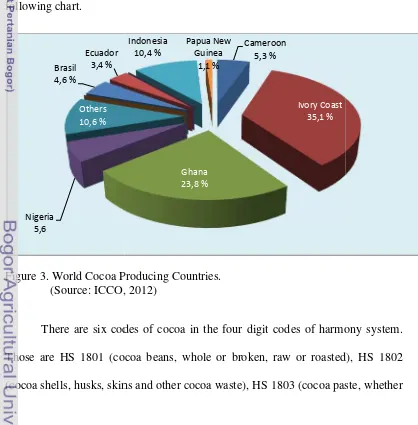
3. World Cocoa Producing Countries... 3
4. The Progression of Export Volumes of Cocoa Bean
According to the Destination Country in 2004 - 2008 ... 6
xxi
LIST OF APPENDICES
Number Page
1. HS 1801 ( Export tax as dummy variable)... 61
2. HS 1801 (Export tax as percentage value)... 62
LIST OF ABBREVIATION
FE Fixed Effects
GDP Gross Domestic Product
0,00 2.000,00 4.000,00 6.000,00 8.000,00 10.000,00
2004 2005 2006 2007 2008
E
xp
o
rt
Va
lu
e
(
M
il
li
o
n
Year
percent). Hence, smallhol
llholder plantation contributes 90 percent of
t al, 2008).
processed to be many kind of food and
ocoa is not only for food or beverage industries but
y other beauty products. It can be turned to be w
k of cocoa.
beans in the world are produced by three count
frica and also Indonesia. In 2002, Indonesia was
oa bean after Ivory Coast. But this condition
or not defatted), HS 1804 (cocoa butter, fat, and oil), HS 1805 (cocoa powder, not
containing added sugar or other sweetening matter), and HS 1806 (chocolate and
other food preparations containing cocoa). Most of Indonesian cocoa is exported
in the form of cocoa beans, whole or broken, raw or roasted (HS 1801) and cocoa
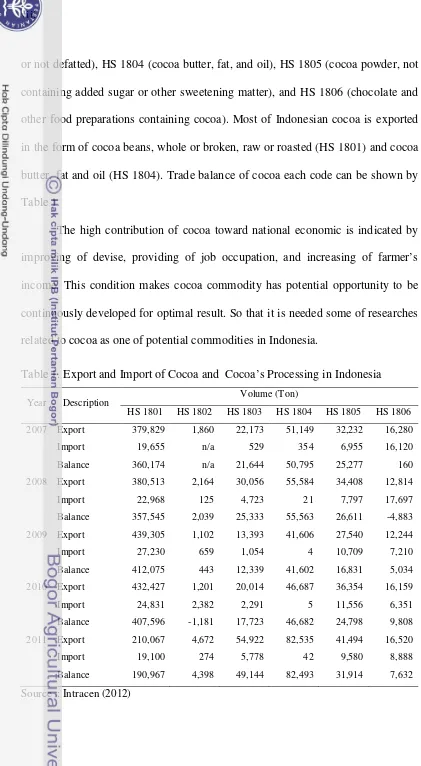
butter, fat and oil (HS 1804). Trade balance of cocoa each code can be shown by
Table 1.
The high contribution of cocoa toward national economic is indicated by
improving of devise, providing of job occupation, and increasing of farmer’s
income. This condition makes cocoa commodity has potential opportunity to be
continuously developed for optimal result. So that it is needed some of researches
related to cocoa as one of potential commodities in Indonesia.
Table 1. Export and Import of Cocoa and Cocoa’s Processing in Indonesia
Year Description Volume (Ton)
HS 1801 HS 1802 HS 1803 HS 1804 HS 1805 HS 1806
2007 Export 379,829 1,860 22,173 51,149 32,232 16,280
Import 19,655 n/a 529 354 6,955 16,120
Balance 360,174 n/a 21,644 50,795 25,277 160
2008 Export 380,513 2,164 30,056 55,584 34,408 12,814
Import 22,968 125 4,723 21 7,797 17,697
Balance 357,545 2,039 25,333 55,563 26,611 -4,883
2009 Export 439,305 1,102 13,393 41,606 27,540 12,244
Import 27,230 659 1,054 4 10,709 7,210
Balance 412,075 443 12,339 41,602 16,831 5,034
2010 Export 432,427 1,201 20,014 46,687 36,354 16,159
Import 24,831 2,382 2,291 5 11,556 6,351
Balance 407,596 -1,181 17,723 46,682 24,798 9,808
2011 Export 210,067 4,672 54,922 82,535 41,494 16,520
Import 19,100 274 5,778 42 9,580 8,888
Balance 190,967 4,398 49,144 82,493 31,914 7,632
5
1.2 Problem Statements
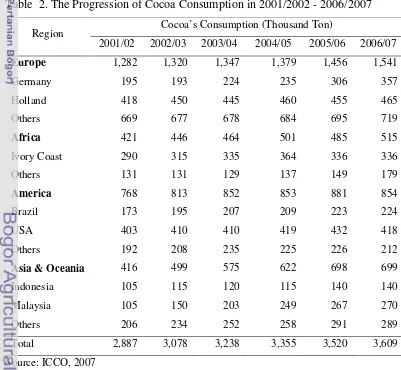
World’s cocoa consumption tends to increase over year and even world’s
cocoa consumption is more than production. Europe is the biggest cocoa
consumer in the world. European Union has the highest number of consumption
per capita in the world. FAO (2003) explained that world cocoa market is
concentrated in EU around 40 percent of world production are consumed. This
condition is caused some countries in Europe such as Germany and Holland have
big downstream industries so that cocoa bean is needed for that purpose. The
other big cocoa consumer country is America especially United States of
America.
Table 2. The Progression of Cocoa Consumption in 2001/2002 - 2006/2007
Region Cocoa’s Consumption (Thousand Ton)
2001/02 2002/03 2003/04 2004/05 2005/06 2006/07
Europe 1,282 1,320 1,347 1,379 1,456 1,541
Germany
Africa 421 446 464 501 485 515
Ivory Coast
America 768 813 852 853 881 854
Brazil
Asia & Oceania 416 499 575 622 698 699
Indonesia
Total 2,887 3,078 3,238 3,355 3,520 3,609
0 50000 100000 150000 200000
2004 2005 2006 2007 2008
7
Cocoa which is imported by European Union is processed to be some products.
Although European Union is the biggest cocoa consumer in the world, Indonesia
cannot export cocoa to this region in big volume. Competitors of Indonesian
cocoa in European Union are Ivory Coast which is supplied 41.54 percent of
Cocoa and followed by Ghana, Nigeria, Cameroon, Brazil, Ecuador and
Switzerland.
Based on that description, the problem that will be analyzed in this
research are what factors that can influence cocoa export of Indonesia to European
Union and what policy implication can be conducted regarding to this condition.
1.3 Objective
According to the background and problem statement which has been
explained, so the purposes of this research is to identify factors that influence
Indonesia cocoa export to European Union and briefly determine policy
implication regarding factors influencing Indonesia Cocoa Export to European
Union.
1.4 Significance of the Research
The Study is expected to:
1. Provide information in the formulation of international trade policy of cocoa.
2. Increase knowledge in applying science which has been obtained in analytical
problem solving skills.
II.
LITERATURE REVIEW
2.1 International Trade of Indonesia Cocoa
Trade relations among countries occur because of differences in potential
resources, cost of production and tastes, differences in demand and supply, as well
as desire to expand market and to raise foreign exchange. In international trade
there are many factors affecting exports. It can be analyzed from demand and
supply that occurred in those commodities both domestically and internationally.
Theoretically, export volume of a particular commodity from one country to
another is difference between higher domestic supply and domestic demand which
is referred to excess supply. At that time, domestic excess supply will be used by
other country that is having excess demand. In addition, Solvatore (1997) showed
that exports are also affected by commodity price and other factors that may also
affect either directly or indirectly. There are some main export products including
plantation commodity in Indonesia.
Plantation products are widely traded commodity. Cocoa is one of the
plantation commodities which have an important contribution to the national
economy. This was demonstrated by research of Hadi and Mardianto (2004)
which showed that cocoa products are one group commodities in 1999 - 2001
(when Indonesia had decreasing of export competitiveness) has a positive
composition effect so need to get greater attention to be exported.
Lolowang (1999) conducted an analysis of supply and demand for
Indonesian cocoa in domestic and international markets that are formulated in the
form of simultaneous equations. Model is suspected by Three Stage Least Squares
domestic and international markets in the form of simultaneous equations. Result
of this study indicates that behavior of plant areas in west and east Indonesia in
the short time are not responsive to the domestic cocoa price, domestic coffee
price, labor rates and bank interest rates. Productivity of cocoa in western and
eastern of Indonesia in the short time is not responsive to the domestic price of
cocoa, fertilizer price and plant areas.
Exports of cocoa beans are the difference between productions or
consumption reduced by domestic demand coupled with the stock of the previous
year. According to research Nurasa and Muslim (2008) Indonesian cocoa exports
have a tendency to increase from year to year. But still be exported cocoa beans
that have not undergone processing.
According to research of Widianingsih (2009), Indonesian cocoa export to
Malaysia, Singapore and China is determined by some factors. Those are export
price, population of Malaysia, Singapore and China, exchange rate and gross
domestic product per capita. Her research found that export price has not
significant and negative correlation to export demand of Indonesia cocoa.
Population has positive significant influence because increasing population will
increase cocoa consumption. Exchange rate and GDP per capita also has positive
influence to export demand.
Sitorus (2009) also conducted the cocoa trade analysis of Indonesia,
Malaysia, Singapore, Hongkong and Thailand to China. She concluded that cocoa
export is significantly influenced by exporter GDP, exporter population, exchange
11
Although exports have increased from year to year, Indonesia experienced
obstacles in marketing their cocoa to the EU. Indonesia must compete with the
cocoa from Africa who enters the EU without tariffs. This rate gives a negative
effect for cocoa exports.
2.2 Gravity Models of Trade
The gravity model is one of the great success stories of economics. The
success of the model is its great explanatory power. The equations fit well
statistically and give quite similar answers across many different datasets-inferred
bilateral trade cost are big, varying with distance and border crossings. Gravity
model became very popular because of its quite simple usage combined with a
substantial power of explaining the flows in general. The gravity equation has
been exploited as an instrument to model not only international trade flows but
also tourism or migration. Subsequently it has been recognized that gravity
equation can be derived from different models including Ricardian,
Hecksher-Ohlin, and the monopolistic competition model. Gravity has long been one of the
most successful empirical models in economics. In corporating deeper theoretical
foundations of gravity in to recent practice has led to a richer and more acurate
estimation and interpretation of the spatial relations described by gravity.
Despite this success, the inferred trade costs have had little impact on the
broader concerns of economics until very recently. There are two difficulties.
First, national buyer and seller responses to bilateral trade cost depend on their
incidence instead of the full cost. Second, the high dimensionality of bilateral
and for use in the wide class of trade models that focus on resource and
expenditure allocation as sectoral aggregates (Anderson, 2003).
The classical conception of gravity model originally reported by Tinbergen
(1963) was inspired by the Newton’s law of universal gravitation. This law states
that every point mass attracts every other point mass with a gravity force Fg that is
directly proportional to the product of their masses M1 and M2 and inversely
proportional to the square of the distance between them:
= 1 2
Before Tinbergen, Ravenstein (1885) and Zipf (1946) used gravity
concepts to model migration flows. Independently from Tinbergen, Poeyhoenen
(1963), inspired by Leo Tornqvist, published a paper using a similar approach.
Tinbergen’s student and team-member of the Netherlands Economic Institute,
Hans Linneman published a follow up study (Linneman 1966) which extended the
analysis and discussed the theoritical basis of the gravity equation using the
Walrasian model as a benchmark. By the 1970s the gravity equation was already a
must. The famous international trade book by Edward Leamer and Robert Stern
included almost an entire chapter on it (Leamer and Stern 1970, pp.157-170),
based on the contribution of Savage and Deutsch (1960). Leamer and Stern’s book
introduced trade economist to the term resistance, that entered their glosary as a
synonim for distance and other trade impediments. To make a long story short,
from the first conceptualisation of Tinbergen (1962) the gravity equation has been
used time and again to empirically analyse trade between countries. It has been
13
life” in the field of research (Deardorff, 1998). The gravity equation’s ability to
correctly approximate bilateral trade flows makes it one of the most stable
empirical relationship in economics (Leamer and Levinson 1995)
Gravity model for international trade considers the bilateral trade as the
“gravity force” between two countries and suggests the same relationship between
this force, masses of the countries proxied by GDP and the distance between
them.
The basic gravity model is developed by Tinbergen in the 1960s
explaining bilateral trade between two countries depending positively on their
economic sizes and negatively distances between them. Tinbergen (1963)
explained that an economic model describing international trade flows can be
formulated in varying degrees of detail. The model consists of only one equation
in which the value of total exports from one country to another is explained by a
small number of variables. The explanatory variables that play a preponderant role
are:
a. The Gross National Product (GNP) of the exporting country;
b. The Gross National Product of the importing country; and
c. The distance between the two countries.
In several calculations other explanatory variables were introduced;
however, their contribution to an explanation of the value of exports was very
limited as compared to that the three main variables. Other important
characteristics of the present analysis are that:
a. No separate demand and supply functions for exports are introduced-meaning
b. Only a statistic analysis is made – no attention is paid to the development of
exports over time.
For estimating purposes, the traditional gravity model of international
trade could be written in the form:
Xji= β0 GDPjβ1GDPiβ2Dijβ3εij
Where Xji stands for the bilateral trade between countries i and j; Dij is a
distance between these two countries; εij stands for the error term and β0, β1, β2
and β3are parameters to be estimated.
We assume that the error term εij is statistically independent on the other
regressors; moreover, we further assume that E (εij GDPi, GDPj, Dij) = 1. This
assumption leads to:
E (Xji GDPi, GDPj, Dij) = β0 GDPjβ1GDPiβ2Dijβ3
However, the gravity model is identified in multiplicative form, which
does not permit for employing standard estimation techniques. The traditional
way in the literature how to deal with estimation of multiplicative form of the
model is to estimate the logarithmic transformed model:
15
2.3 Gross Domestic Product (GDP), Population, Physical Distance, Exchange Rate, and Export Tax
2.3.1 Gross Domestic Product
Gross domestic product is used to measure the country’s total output. It is
one of the primary indicators used to gauge the health of a country’s economy.
Economic production and growth, what GDP represents, has a large impact on
nearly everyone within that economy. According to the gravity model, a large
economy spends more on imports and exports. GDP influence country’s ability
towards trade flows. The higher GDP of one country means more trade for a
country. Bergstrand (1989) reports a positive GDP per capita coefficient. He
interprets a negative GDP per capita coefficient in a way that the product group
which is subject to the estimation is not capital intensive but labor intensive.
However, in the long run higher population has a tendency to decrease
income per capita, making every individual poorer, and therefore it may cause
production and exports to decrease. In addition to that, lower income per capita
tends to decrease the demand for imports as well.
2.3.2 Population
Big population can possibly increase trade flows between countries. It is
possible to extend the basic gravity model by including the populations of
exporting and importing countries to see what the effect of population on bilateral
trade flows between two countries is. It is possible to modify the basic gravity
model by including populations of exporting and importing counties to know the
effect of population on bilateral trade flows between two countries. Matyas (1997)
conclude that population has a tendency to increase trade and the level of
(1999) finds a negative population coefficient which means a negative
relationship between population and trade flows, suggesting that imports and
exports are capital intensive in production.
Moreover, according to Bertrand (1989) the impact of population on trade
may also differ depending on the length of the estimation period (short term vs.
long term). Population may have a positive impact on trade flows in the short run,
since it may increase the amount of labor force, the level of specialization and
more products to export as a result.
2.3.3 Distance
The concept of bilateral distance is the main determining characteristic of
the gravity model and thus measurement issues related to distance are key to the
validity of any empirical application, but also to the interpretation of the result of
the econometric findings. Economics is no physics. In the natural sciences
distance is well defined and its measurement can be exact and unambiguous.
Economic distance however is a multifaceted concept, and measurement and
interpretation accordingly are subject to continuous debate. Originally distance
entered the model because it could be used as an approximation of transportation
cost and transport time. Also distance was used as a measure for the “mental”
distance of exporters and importers that increases with distance. New and
challenging measures of intangible distances related to different legal and
economic institutions, different cultures and different technologies have recently
been added to the gravity model (Martinez-Zarzoso and Marquez-Ramos 2005;
Dekker et al.2006). Furthermore, larger distances between countries are expected
17
2.3.4 Exchange Rates
Another variable supposed to affect the level of international trade is the
exchange rates. Including exchange rates is also a common practice in the gravity
literature, as the depreciation of a currency makes the exports of a given economy
more competitive in the rest of the world as they get cheaper (Anderson and Van
Wincoop, 2003). We expect a positive sign for exchange rates because
depreciation of home country relative to the foreign country currency will lead to
more export and less export for the home country.
Zarzoso and Lehman (2003) apply the gravity trade model to asses
Mercosur-European Union trade and trade potential following the agreement
reached recently between both trade blocs. The model is tested for sample 20
countries, the four formal members of Mercosur, Chile, and fifteen members of
the European Union. The research finds that exchange rate is one of the important
variables of bilateral trade flows.
Exchange rates, in some cases, have no influence to explain some
country’s trade. Rahman (2006) who analyzes the Bangladesh’s trade with its
major trading partners using the panel data estimation finds that exchange rate has
no effect on the Bangladesh’s import. This also happen in export behavior of
Ethiopia which is investigated by Taye (2009). He finds that real exchange rate is
statistically insignificant to determine Ethiopia’s export performance.
2.3.5 Export Tax
The compound effect of export taxes on trade is ambiguous, depending on
market structure and market power of the applying country. Export tax can
of downstream industries. Overall the impact of export tax on trade is expected to
be negative (Solleder, 2012) that export taxes negatively affect export values and
quantities of tax imposing nations. Burger (2007) conducted research on cocoa
export tax by a case study on Cocoa commodity contained in the Ivory Coast. His
research concluded that the Ivory Coast who has contributed 40 percent of world
cocoa demand almost did not get the benefit of the export tax changes.
Moreover with the above mentioned variables, international or bilateral
trade is affected by many other factors such as common language, common
border, and colonial ties, being in the same trade union or free trade area, sharing
a common culture and religion and so on.
Mehanna (2003) analyzes the effects of politics, as represented by political
freedom and corruption, and cultures as represented by religion and language
affiliation, on Intra-Middle East trade for the period 1996-1999 for sample of 33
countries. It employs an extended version of the gravity model by controlling for
oil exporting countries. The results showed that religion and culture has a
statistically significant effect on the Middle-East trade. However, corruption is
shown to have a highly statistically negative effect on both exports and imports in
the Middle East. In addition she finds that the level of political freedom in these
countries does not statistically affect Middle-East trade.
Gassebneret.al (2006) even includes disaster variable to gravity model in
their paper which examine the impact of major disasters on international trade
flows using a gravity model. Their research consists of more than 170 countries
IV. THEORITICAL FRAMEWORK
3.1 Theory of International Trade on Indonesian Cocoa.
No country in the world that can live without interaction with other
countries. As rich as any natural resources, a country would require other states in
ensuring the survival of its people. International trade is a form of interaction
between countries is one important issue in world economic activity. It is then not
only related to economic issues, but then also extends to political and social
issues.
International trade in principle arises as a result of the interaction between
demand and supply is competitive. This is not apart from the concept of absolute
advantage and comparative advantage. Adam Smith stated that the concept of
inter-state trade is affected by absolute advantage. If a country produces a
commodity with a more cost efficient than other commodities and also compared
with other countries so the concept of specialization of production would be more
beneficial for the country. This means that a country does not need to produce all
the required items.
Tabel 3. Absolute Advantages
Commodity Indonesia Malaysia
Rubber (1 unit) 2 4
Tobacco (1 unit) 4 2
Total 6 6
With the advantage absolute different in each country, each country does
not need to produce all the goods. Malaysia and Indonesia can share the role. For
one unit of rubber Indonesia requires less labor than Malaysia. Meanwhile, for a
and Malaysia can share the role. To focus on Indonesian rubber production
activities while Malaysia produces tobacco.
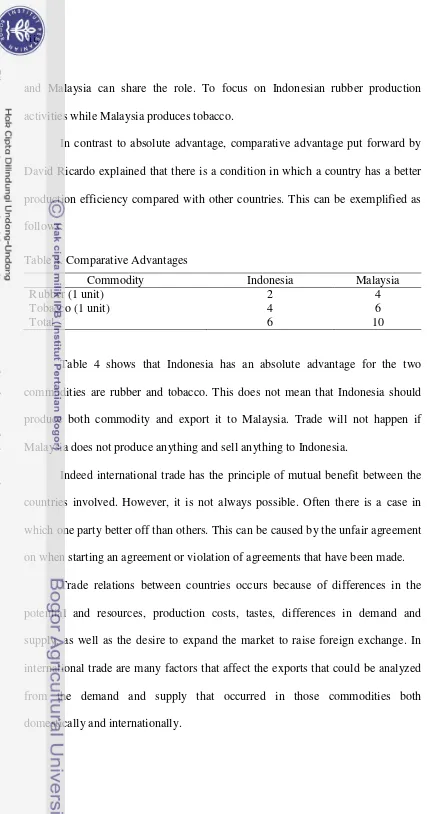
In contrast to absolute advantage, comparative advantage put forward by
David Ricardo explained that there is a condition in which a country has a better
production efficiency compared with other countries. This can be exemplified as
follows:
Table 4. Comparative Advantages
Commodity Indonesia Malaysia
Rubber (1 unit) 2 4
Tobacco (1 unit) 4 6
Total 6 10
Table 4 shows that Indonesia has an absolute advantage for the two
commodities are rubber and tobacco. This does not mean that Indonesia should
produce both commodity and export it to Malaysia. Trade will not happen if
Malaysia does not produce anything and sell anything to Indonesia.
Indeed international trade has the principle of mutual benefit between the
countries involved. However, it is not always possible. Often there is a case in
which one party better off than others. This can be caused by the unfair agreement
on when starting an agreement or violation of agreements that have been made.
Trade relations between countries occurs because of differences in the
potential and resources, production costs, tastes, differences in demand and
supply, as well as the desire to expand the market to raise foreign exchange. In
international trade are many factors that affect the exports that could be analyzed
from the demand and supply that occurred in those commodities both
21
Theoretically, the volume of exports of a particular commodity from one
country to another is the difference between domestic supply is referred to as
excess supply. At the time of the excess supply of domestic used by other
countries that are experiencing excess demand. In addition, exports are also
affected by commodity price and other factors that may also affect either directly
or indirectly (Salvatore, 1997).
Offering country exports of cocoa beans is the difference between
productions or consumptions is reduced by domestic demand coupled with the
stock of the previous year. According to research Nurasa and Muslim (2008)
Indonesian cocoa exports have a tendency to increase from year to year. But still
be exported cocoa beans that have not undergone processing.
Although exports have increased from year to year, Indonesia experienced
obstacles in marketing their cocoa to the EU. Indonesia must compete with the
cocoa from Africa who enters the EU without tariffs. This rate gives a negative
effect for cocoa exports. Burger (2007) conducted research on cocoa export tax by
a case study on Cocoa commodity contained in the Ivory Coast. His research
concluded that the Ivory Coast who has contributed 40% of world cocoa demand
almost did not get the benefit of the export tax changes. In the long run this will
have negative consequences for farmers. Welfare of farmers will be affected by
high taxes.
Research on cocoa has also been performed by Armanda (2009) and
Lolowang (1999). The results Armanda (2009) showed that the response of cocoa
of CPO a year earlier, the area under the previous cocoa, cocoa prices the previous
year and the rainfall the previous year.
Generally, the analysis of international trade is done by using
simultaneous equations model. According to Nachrowi (2006), simultaneous
equations consist of endogenous and exogenous variables. Endogenous variables
are variables whose values are determined in the model. Although not identical,
the endogenous variables is similar to the dependent variable in the regression
equation, where its value can be determined if the value of independent variables
has been determined in advance. While the exogenous variables are variables
which are determined from outside of the model. Endogenous variables in an
equation affect the endogenous variables in other equations.
In a simultaneous equations model there are two types of structural models
and model reduction. Structural model is also called behavioral models, has a
form based on the underlying theory to fit the behavior or structure of existing
markets. While model reduction is a simple structural model.
Studies using simultaneous equation analysis have been done by
Lolowang (1999) Sanjaya (2009), Setiawan (2005) and Sihotang (1996). In his
research, Lolowang (1999) and Sihotang (1996) using the estimation methods
Three Stage Least Squares (3SLS) while Sanjaya (2009) analyzed the response
deals with the estimation method of Ordinary Least Square (OLS).
Cocoa bean is one of the export commodities that are able to contribute in
the efforts to increase foreign exchange Indonesia. As specified in the objectives
of this study emphasize the study of the factors that influence development of
23
cocoa, domestic consumption of cocoa beans, cocoa beans Indonesia export
supply to the EU and the impact of economic policies and external to the grain
market balance Indonesian cocoa. As a commodity traded on world markets,
cocoa Indonesia is more oriented to export. With these considerations the model
formulated must be related to the order of the market in cocoa beans producer and
consumer countries.
Indonesia exports of cocoa beans were analyzed based on the country's
main export destination of Indonesia to find out whether there are differences in
the behavior of Indonesian cocoa exports offerings based on the segmentation or
differentiation of export destinations. Analysis of the domestic price of cocoa
beans is expected to inform the extent to which the prospect of the domestic price
of cocoa beans is affected by the change from the side of consumers and
producers, as well as domestic policy.
3.2 International Demand and Supply of Cocoa
Trade relations among countries occur because of differences in potential
resources, cost of production and tastes, differences in demand and supply, as well
as desire to expand market and to raise foreign exchange. In international trade
there are many factors that affect exports that can be analyzed from demand and
supply that occurred in those commodities both domestically and internationally.
Cocoa export is difference between production and consumption which is
reduced by domestic demand and coupled with stock of the previous year.
Therefore cocoa exports are as follows:
Where:
QXt= Total exports of cocoa in the year t
QPt= Total production of cocoa in the year t
QCt= Total consumption of cocoa in the year t
St-1= Stock of previous year
Assumptions used in this equation are import of cocoa-exporting countries
is relatively small when compared with production, so it can be ignored. Then,
considering the amount of cocoa production when compared with demand stock
demand in producer countries suspected rather than functioning as a buffer to
adjust market conditions, but the rest of the production at the end of the year that
are not sold and entered into this year offerings, because these factors are
relatively constant value then the variables can be excluded from the model. Then
the formula becomes as follows:
QXt= QPt- QCt
QPt= Area (At) x Productivity (Yt)
Commodity price is positively related to production. It means that higher
price commodity will increase production. It is similar to area. Higher land area
will increase production. For wages and interest rates, the hypothesis is negatively
related. It means that increasing of wage and interest rate will reduce production.
Cocoa production produced in part will be consumed and the rest is used for
export. Amount of cocoa beans that are required or consumes at a certain period is
25
income (Y), related-price commodity (HL), Number of population (Pop).
Mathematically, function of cocoa consumption is as follows:
QCt=f(PDt, Yt, HLt, Popt)
3.3 Export Import Theory
Exports are a product that a country produces more than it can consume in
order to ship to other countries for a profit. An Import is product that a country
gets from another country because it has a lower price than if they were to
produce it themselves.
Exports consist of transaction in good and services from residents to non
residents. Meanwhile imports consist of transaction in good and services from non
residents to residents. An export of a good occurs when there is a change of
ownership from a resident to a non resident. Export of commercial quantities of
goods normally requires involvement of the customs in both the country of export
and the country of import.
International trade can give devise contribution. This condition will
increase economic development of country. Amir (1995) stated that general
characteristic of a commodity which is potential to be exported are:
1. Having production surplus.
2. Having certain advantages such as: scarce, good quality compared to the
same products from the other countries.
3. Export oriented.
(Export activities contribute big benefit to country. Benefit of export for
government are increasing country’s devise, enlarging benefit of national
resources etc).
3.4 Operational Framework
Cocoa is one of the most important commodity in Indonesia. Export value
of cocoa bean has third rank after oil palm and rubber. Indonesia is also the big
three of cocoa producing countries in the world. But apparently Indonesia cannot
export cocoa to the European Union in a big volume although FAO (2003)
explained that world cocoa market is concentrated in EU around 40 percent of
world production are consumed. By using gravity model, this research will
determine what factors which can influence indonesian cocoa trade flows to
European Union. There are two codes of cocoa which will be analyzed in this
paper. Those are HS 1801 and HS 1804. Determination of these codes based on
the two highest cocoa export of Indonesia. Based on this condition operational
IV. RESEARCH METHOD
4.1 Scope of Study
This research was conducted in Indonesia focusing on factors that
influence Indonesian cocoa export to the European Union.
4.2 Types of Data and Sources
The type of data used in this research is secondary data time series (time
series) and cross section as much as 14 years, start from 1998 until 2011. The data
obtained from several agencies such as: Statistics of Indonesia, Agricultural
Ministry, ICCO, Global Trade Atlas Navigator and other institutions. Data used
are export volume of cocoa, the distance between countries, Gross Domestic
Product and population.
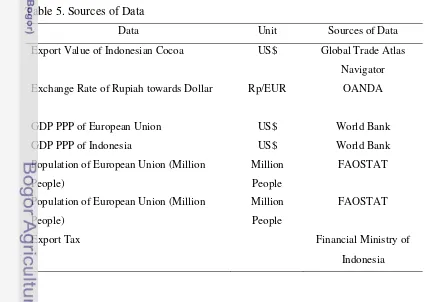
Table 5. Sources of Data
Data Unit Sources of Data
Export Value of Indonesian Cocoa US$ Global Trade Atlas Navigator Exchange Rate of Rupiah towards Dollar Rp/EUR OANDA
GDP PPP of European Union US$ World Bank
GDP PPP of Indonesia US$ World Bank
4.3 Data Analysis Methods
Data processing was conducted by using stata which use panel data
Analysis with gravity model panel data. We often find problem regarding to data
availability. Sometimes time series data provided are short and sometimes cross
section data provided are limited. In Econometrics this problem can be solved by
using pooled data in order to get efficient estimation.
A panel data set, while having both a cross sectional and a time series
dimension, differs in some important respects from independently pooled cross
section. To collect panel data, sometimes called longitudinal data, we follow (or
attempt to follow) the same individuals, families, firms, cities, states, or across
time. For example a panel data set on individual wages, hours, education and
other factors is collected by randomly selecting people from a population at a
given point in time. Then, these same people are interviewed at several
subsequent points in time. This gives us data on wages, hours, education, and so
on, for the same group of people in different years.
Panel data sets are fairly easy to collect for school districts, cities,
counties, states, and countries, and policy analysis is greatly enhanced by using
panel data sets. Hsiao (2003) lists several benefits from using panel data.
1. Controlling for individual heterogeneity.
2. Panel data give more informative data, more variability, less collinearity
among the variables, more degrees of freedom and more efficiency.
31
4. Panel data are also well suited to study the duration of economic states like
unemployment and poverty, and if these panels are long enough, they can
shed light on the speed of adjustments to economic policy changes.
5. Panel data are better able to identify and measure effects that are simply not
detectable in pure cross section or pure time-series data.
6. Panel data models allow us to construct and test more complicated
behavioral models than purely cross-section or time series data.
7. Micro panel data gathered on individuals, firms and household may be more
accurately measured than similar variables measured at the macro level.
Biases resulting from aggregation over firms or individuals may be reduced
or eliminated.
8. Macro panel data on the other hand have a longer times and unlike the
problem of nonstandard distribution typical of unit roots tests in time series
analysis.
There are three model which can be estimated in panel data. These are
Pooled Least Square, Fixed Effects and Random Effects.
4.3.1 Pooled Least Square
Pooled least square use panel data by using cross section, time series and
pooling. Every observation (each period) has regression. We can know N
(Quantity of unit cross section) and T (period of time). From all of the
observations (N.T), we can write function
Yit= α + Xitβj + εit
where:
Yit = endogenous variable
Xit = exogenous variable
α = intercept
β = slope
i = individual i
t = period year t
ε = error
N = Quantity of unit cross section
T = Quantity of time period
The simplest approach to estimate this function is ignoring cross section
and time series dimension from panel data and estimating by ordinary least square
which is determined by pool data.
In this method, model assume that variable’s intercept is the same, then
this model also assume that coefficient slope from two variables is identical for all
unit cross section. This is strict assumption. Although PLS method (pooled least
square) is relatively easy, but model possibly distort the real relationship between
Y and X in unit of cross section.
Pooled Least Square models are consistent if the dependent variables are
not correlated to the error. Pooled models also produce an unbiased estimator if
the unit effects (αi ) are uncorrelated with the independent variable (x). But,
commonly αi is correlated to the x, therefore pooled and pa tend to produce a bias
estimator of β (Clark and Linzer, 2012). Fixed effects and random effects model
33
model will produce unbiased estimates of β, but those estimates need a high
variability on the sample.
4.3.2 Fixed Effect Model
Fixed effect model is model which considers eliminated variables can
change intercept of cross section and time series. Dummy variables can be added
to the model to make intercept changes possible. Afterward model is estimated by
using Ordinary Least Square (OLS)
Yit=αiDi+ β Xit+ εit
Where:
Yit = endogenous variable
Xit = exogenous variable
α = intercept
D = dummy variable
β = slope
i = individual i
t = period year t
ε = error
4.3.3 Random Effect Model
Additional of dummy in fixed effect can reduce quantity of degree of
freedom. This condition will also reduce efficiency of estimated parameter.
Random effect model can be used to solve this problem. In this model, different
parameter between individual and time is included to error. Random effect model
Yit= Xitβj+ εit
εit = uit+vit+ wit
Where:
uit~ N(0,δu2) = component of cross section error
vit~ N(0,δv2) = component of time series error
wit~ N(0,δv2) = component of combination error
It can also be assumed that individual error and combination error is not
correlated each other. Using of random effect model can reduce using of degree of
freedom. It has implication that estimated parameter will be more efficient.
Nachrowi and Usman (2006) suggested that it is better to use fixed effects
model if we have T (time) bigger than amount of individual. On contrary, if we
have amount of individual is bigger than amount of time, so it would be better if
we use random effects model. Egger (2000) explained that since individual effects
are include in the regressions a decision should be made whether they are treated
as random or fixed. A random effects model can be more appropriate when
estimating the flows of trade between a randomly drawn sample of trading
partners from a large population. A fixed effects model would be a better model
when estimating flows of trade between an ex ante predetermined selection of
countries).
This study deals with the flows of trade between Indonesia and Countries
in European Union which is main importer of Indonesia cocoa. Those are
Germany, France, Netherlands, United Kingdom, Belgium, Italy, Spain, Austria,
35
appropriate model than random specification. The eleven importer countries are
selected for the period 1998 - 2011.
4.4 Model Formulation
There are two codes of cocoa which will be analyzed in this paper. Those
are HS 1801 and HS 1804. Determination of these codes based on the two highest
cocoa export of Indonesia.
4.4.1 Model Formulation of HS 1801 (Cocoa Beans, Whole or Broken, Raw or Roasted)
Analysis used in this research is Gravity Model approach which consists
of Dependent variables and some Independent variables. Independent variables
used are GDP of exporter and importer countries, population of exporter and
importer countries, physical distance, exchange rate and export tax.
We will divide Analysis of code HS 1801 (Cocoa beans, whole or broken,
raw or roasted) into two analyses. Firstly, export tax is treated as dummy variable
and secondly, export tax is analyzed as percentage value. It is intended to know
the effect of the export tax to European Union as whole, before and after export
tax policy and also the effect of export tax (in percentage value) to trade flows
(export value). The model formulation could be written as follows:
ln Yijt = β0+ β1lnGit+β2lnGjt+β3lnSit+β4lnSjt+ β5ln Eijt + β6lnLij+ β7Tt+ ε
where:
β0 = Intercept
β1, β2,β5 = Parameter of each variable which will be tested statistically and
econometrically
i,j = (1,…,N) Bilateraltrades between country i and j
Yijt = Trade flows (Export Values) of Cocoa from country i to j in the
year t
Git = GDP of country i in the year of t
Gjt = GDP of country j in the year of t
Sit = Population of country i in the year t (people)
Sjt = Population of country j in the year t (people)
Eijt = Exchange rate of country i and j in the year t
Lij = The distance between exporter countries and importer countries
(Kilometres)
T = Export Tax (dummy and percentage)
ε = Error
4.4.2 Model formulation of HS 1804 (Cocoa Butter, Fat, and Oil)
In case of cocoa HS 1804, we still use the same variables with cocoa
HS1801. Since there is no export tax imposed on this cocoa code, here we
eliminate export tax variable. Independent variables used are GDP of exporter and
importer countries, population of exporter and importer countries, physical
distance, and exchange rate. The model formulation could be written as follows
Yijt = β0+ β1lnGit+ β2lnGjt+β3lnSit+β4lnSjt+ β5ln Eijt + β6lnLij+ ε
where:
β0 = Intercept
β1, β2,β7 = Parameter of each variable which will be tested statistically and
37
t = (1,…,T) between 1998–2011
i,j = (1,…,N) Bilateral trades between country i and j
Yijt = Trade flows (Export Values) of Cocoa from country i to j in the
year t
Git = GDP of country i in the year of t
Gjt = GDP of country j in the year of t
Sit = Population of country i in the year t (people)
Sjt = Population of country j in the year t (people)
Eijt = Exchange rate of country i and j in the year t (Rp/Euro)
Lij = The distance between exporter countries and importer countries
(Kilometres)
V. DESCRIPTION OF INDONESIA COCOA
5.1 Development of Indonesia Cocoa
Cocoa is a commodity from Amazon River and originated from tropical
forests in Central land South America (Wahyudi et.al, 2008). Cocoa was brought
to Indonesia through North Sulawesi by Spanish in 1560s and it became an
important commodity in Indonesia. Its growth is strongly influenced by climatic
and soil factors which also has implication on its production. Rainfall,
temperature and sunlight are parts of factors that determine climate whereas
chemical and physical properties of the soil will affect root absorption of soil
nutrients.
Generally, there are three types of cocoa that can be grown in tropical
areas. They are Criolo, which is consisted of Criolo from Central and South
America,Forasterowhich is known as bulk or ordinary cocoa andtrinitariowhich
is derived from crossing species between Criolo and Forastero. According to
Supriatna (2004), the most developed cocoa is fine or flavor and bulk cocoa in
Indonesia. Noble cocoa comes from Criolowith red fruit and bulk cocoa from
ForasteroandTrinitariowith green fruit.
5.2 Production of Indonesia Cocoa
Indonesia is the third biggest cocoa producer in the world. The total cocoa
acreage in Indonesia reached 1,563,423 by 2008. This was dominated by
smallholders (93.11 percent),and the number of farmers who are directly involved
are as many as 1,526,271 households. Cocoa evenly spread in almost all the major
Sumatera; 17.3 percent, Java; 5.6 percent, Nusa Tenggara and Bali; 4.1 percent,
Borneo; 3.7 percent, Maluku and Papua for 7.0 percent (Ministry of Agriculture,
2009).
Centrals of Cocoa plantations largely are concentrated in four provinces
namely South Sulawesi, Southeast Sulawesi, West Sulawesi, and Central
Sulawesi. There are three types of ownership of these plantations; government,
private and smallholders.
According to the Ministry of Agriculture (2009), South Sulawesi is a
province with the largest cocoa grower areas in Indonesia, which covers 262,807
ha, followed by Central Sulawesi with of 221,667 ha, and then Southeast Sulawesi
and West Sulawesi with 197,449 ha and 153,043 ha. Although South Sulawesi is
the largest grower of cocoa in Indonesia, but in contrast, it has the lowest
production.
5.3 Cocoa Development Policy in Indonesia
Cocoa in Indonesia began to be developed in 1980. This indicates that
cocoa plans in Indonesia are old now; therefore they need rejuvenation,
rehabilitation and intensification. Due to this condition, government began
running a program related to cocoa production and quality to increase national
income. The total budget spent to perform this program reached 13.7 trillion
41
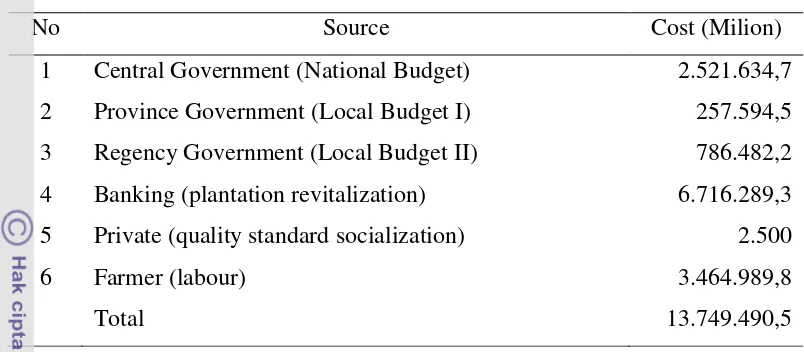
Table 6. Budget recapitulation of cocoa program for three years (2009 - 2011)
No Source Cost (Milion)
1 Central Government (National Budget) 2.521.634,7
2 Province Government (Local Budget I) 257.594,5
3 Regency Government (Local Budget II) 786.482,2
4 Banking (plantation revitalization) 6.716.289,3
5 Private (quality standard socialization) 2.500
6 Farmer (labour) 3.464.989,8
Total 13.749.490,5
Source: Portal Nasional Republik Indonesia, 2009
According to the General Directorate of Plantations (2009), locations of te
program cover nine provinces in 40 districts, they are:
a. West Sulawesi in five districts: Mamasa, Polewali Mandar, Majene,
Mamuju and North Mamuju.
b. South Sulawesi in 10 districts: Bantaeng, Bone, Soppeng, Wajo,
SindenrengRappang, Pinrang, Enrekang, Luwu, North Luwu.
c. Southeast Sulawesi in five districts:Konawe, Kolaka North, South and
MunaKonawe.
d. Central Sulawesi in eight districts: Donggala, Moutong, Parigi, Poso,
Morowali, Banggai, ToliToli, Buol and Tojo Una-Una.
e. East Nusa Tenggara in Sikka and Ende, Tabanan and Jembrana.
f. Maluku in the District of West Seram and Buru.
g. West Papua in Manokwari and Sorong.
h. Yapen Islands of Papua in Sarmi, Keerom and Jayapura districts.
There are some activities which are conducted in this Production
rejuvenating 70,000 ha plantations, rehabilitating 235.000 ha plantations,
intensification which covered 145,000 ha areas, farmer training for 450,000
people to realize quality improvement.
Supporting activities are training 360 people, constructing sub-station
research, building four units of experimental garden and strengthening seven units
of field laboratories, manufacturing cocoa cultivation technology database
systems, rehabilitating 90 units of UPP, soil and leaf analysis for fertilizer
recommendation, monitoring and evaluating are done by universities.
Cocoa production and quality improvement program involves various
parties to exploit potential available resources. They include central government,
provinces, foreign countries, private companies, banks and farmers with the duties
and responsibilities as follows:
1. Central government: providing financing for planting materials, fertilizers,
rejuvenation, rehabilitation and intensification, labor assistance for farmers,
pest control tools and materials, professional assistants, farmer
empowerment, development of sub-station study, strengthening and
developing labs and field application of quality or socialize the
implementation of quality standards.
2. Provincial government: allocating budget to support program
implementation and cocoa certification and providing land for sub-station
construction.
3. District Government: providing budget to support the program and selecting
43
4. Banking: providing credit to finance revitalization of farm fertilizers,
pesticides, agricultural tools and land certificate.
5. Private: providing financing for SNI Implementation.
6. Farmers: providing shade trees and labor.
The implementation of cocoa production and quality improvement
program will provide these benefits:
1. Increasing cocoa productivity in program location.
2. Increasing cocoa production in program location.
3. Increasing farmer income in program location.
4. Increasing money supply in rural location.
5. Increasing foreign exchange earning in program location.
6. Increasing cocoa quality in accordance with SNI.
7. Fulfilling raw material needs of domestic industry.
In April 2010 Indonesian government started to impose tax policy for
cocoa bean under decree No. 67/2010. The Finance Minister imposed a five
percent tax on exported cocoa beans, and priced ranging from US$ 2000 - 2750
per ton. This tax rate is increased to 10 percent for beans sold for more than $
2750.
This tax policy was aimed to push domestic cocoa downstream industry.
Government considers that the cocoa tax policy will revive the cocoa industry. It
was made to encourage more production of cocoa beans in Indonesia, to improve
the benefit from marketing value-added product for the country. It would benefit
not only the cocoa industry but also cocoa farmers, who currently have more