ESTIMATION OF NET PRIMARY PRODUCTION
USING THE NetPro 1.0 MODEL
(Case Study: Cidanau Watershed, Serang)
ANIA SUPENI
DEPARTMENT OF GEOPHYSICS AND METEOROLOGY
FACULTY OF MATH AND NATURAL SCIENCES
ESTIMATION OF NET PRIMARY PRODUCTION
USING THE NetPro 1.0 MODEL
(Case Study: Cidanau Watershed)
ANIA SUPENI
G02400020
Undergraduate research report
to fulfil the requirement for a bachelor degree in science
at the Department of Geophysics and Meteorology
Faculty of Math and Natural Sciences
DEPARTMENT OF GEOPHYSICS AND METEOROLOGY
FACULTY OF MATH AND NATURAL SCIENCES
BOGOR AGRICULTURAL UNIVERSITY
ABSTRACT
ANIA SUPENI. Estimation of Net Primary Production Using the Net Pro 1.0 Model (case study: Cidanau Watershed, Serang). Advised by TANIA JUNE and BUDHI PRIYANTO.
A payment for environmental services scheme is held in Cidanau watershed, Serang. Cibojong and Citaman are villages chosen for payment model. The scheme was intended to maintain water supply mainly for the industry in Cilegon. The watershed also has a swamp forest protected as a natural preserve, the Rawa Danau preserve. It is also important for the Cidanau river water supply. Rawa Danau as well as private garden managed for this scheme have carbon sequestration potency. This potency is described using net primary production (NPP) estimated using the NetPro v. 1.0 model. Inputs for the model for this research were Landsat 7 NDVI 2002 and 2004 data, 2002 and 2004 daily radiation data, and 2002 and 2004 daily minimum and maximum temperature.
In 2002 there were seven NDVI classes and in 2004 there were eight NDVI classes. For both years, lower NDVI classes, Class 1 and Class 2, occurred in paddy field and higher NDVI classes occurred in forest and garden. In 2004 the overall Cidanau NPP was lower than 2002 because there were decrease in higher classes NDVI coverage. A decrease also occurred for Cibojong. Meanwhile NPP of Rawa Danau and Citaman were higher in 2004 than in 2002. NPP of Cidanau in 2002 was 1327 gC m-2 year-1 and in 2004 was 1190 gC m-2 year-1. NPP of Rawa Danau preserve were 1481 gC m-2 year-1 (2002) and 1784 gC m-2 year-1 (2004), NPP of Cibojong were 3184 gC m-2 year-1 (2002) and 2684 gC m-2 year-1 (2004), and NPP of Citaman were 2060 gC m-2 year-1 (2002) and 2102 gC m-2 year-1 (2004). Carbon appraisal derived from NPP for Citaman and Cibojong showed value between IDR 1.2 million to IDR 3.8 billion. The compensation payment is within this range. Compared to some tropical forest NPP, the NPP of private garden of Citaman and Cibojong were within their range.
RINGKASAN
ANIA SUPENI. Estimation of Net Primary Production Using the Net Pro 1.0 Model (case study: Cidanau Watershed, Serang). Di bawah bimbingan TANIA JUNE dan BUDHI PRIYANTO.
Suatu skema pembayaran jasa lingkungan diselenggarakan di DAS Cidanau, Serang. Kelurahan Cibojong dan Citaman terpilih sebagai model pembayaran. Skema pembayaran tersebut bertujuan untuk menjamin ketersediaan air terutama untuk indistri di Clegon. DAS Cidanau juga memiliki Rawa Danau, suatu kawasan hutan rawa yang dilindungi sebagai cagar alam, dan juga penting bagi ketersediaan air sungai Cidanau. Rawa Danau dan kebun milik pribadi yang dikelola dalam skema pembayaran ini memiliki potensi penyerapan karbon. Potensi ini digambarkan dengan nilai net primary production (NPP) yang diduga menggunakan model NetPro v. 1.0. Dalam penggunaannya untuk penelitian ini diperlukan input NDVI yang diperoleh dari data Landsat 7 tahun 2002 dan 2004, data radiasi harian tahun 2002 dan 2004, dan suhu maksimum dan minimum harian tahun 2002 dan 2004.
Title
: Estimation of Net Primary Production
Using the NetPro 1.0 Model
(Case Study: Cidanau watershed, Serang)
Student’s Name
: ANIA SUPENI
NRP :
G02400020
Approved by the Advisory Board
DR Ir. Tania June, MSc DR. Ir. Budhi Priyanto, MSc.
1
stAdvisor 2
ndAdvisor
The Sky is the Limit
(an
English
proverb)
PERSONAL DATA
PREFACE
Firstly, I would like to show my grateful to the Arrahman-Arrahiim for every
chance given to me, including the chance to finish this final task of my undergraduate
study.
We have many environmental problems, many causes, and many theories
about them. What we can do is to always try solving our problems, it doesn’t matter
how big they are, who cause them, or whose theory is the right one. There is only one
earth for us, and from the outer space exploration during 20
thcentury it is concluded
that we can’t even move to our nearest neighbor, the moon, without expensive and
sophisticated effort. A slogan “act locally, think globally” seems the best advice for
us now. This report is only a light reading material to remind us that environmental
problem, especially global warming, is not only a stakeholders’ problem. We can also
aware about it.
I would like to give some respectful words for some people because this
report and my research were fully supported by them. They are:
1.
Mrs. Tania June, for the chance her patience given to me, she has been my
advisor since my academic internship.
2.
Mr. Budhi Priyanto, from BTL-BPPT for the chance, knowledge, and
patience given to me.
3.
Mr. Bregas, the third examiner in my final undergraduate research exam.
4.
Mrs. Irma Barus, IPB English lecturer, who helped me with this report
writing.
5.
BMG Bawil II staffs and BMG Serang staff, Mrs. Dian for their help in
climatological data preparation.
Finally, there were hopes when this report was finished. I hoped this report
would be useful for others and would be a reminder for me to always try my best in
doing anything and explore His creatures.
List of Content
List of content………...
List of tables………..
List of figures………..………... vii
viii
ix
I Introduction
1.1. Research background……….... 1.2. Research objective………
II Literature review………..………... 2.1. Issues on carbon dioxide………..…... 2.2. Issues on Cidanau watershed……….. 2.3. Net Primary Production (NPP)……….…... 2.3.1. fAPAR and PAR……….………...… 2.3.2. Radiation use efficiency……… 2.4. Vegetation indices from remote sensing………... 2.4.1. Landsat 7 ETM………...………... 2.4.2. Normalized Difference Vegetation Index (NDVI)...…………... 2.5. Leaf Area Index (LAI)……….………… 2.6. The NetPro v.1.0 model……….………….. .
III Methods... 3.1. Normalized Difference Vegetation Index (NDVI)... 3.2. PAR... 3.3. fAPAR... 3.4. LAI (Leaf Area Index)……… 3.5. Net Primary Productivity (NPP)……….………
IV Result and discussion………... 4.1. NDVI……….. 4.2. LAI………... 4.3. NPP………... 4.3.1. NPP of Cidanau watershed………...……….. 4.3.2. NPP of Rawa Danau preserve……….……….. 4.3.3. NPP of water compensation payment scheme sites…..………... 4.4. Carbon appraisal……….. 4.5. The world’s NPP………...
V Conclusion and Suggestion……….
VI References……….………..…... 1 1 1 1 2 4 4 4 4 4 5 6 7 7 7 8 8 8 8 8 8 9 18 18 20 20 23 24 25 25
APPENDIX 1. NetPro v. 1. 0 Output – e Ochi & Shibasaki and Dynamic e………
APPENDIX 2. NPP of several world biomes……….
APPENDIX 3. NetPro climate data input (BMG Serang Climatological Station)…. 28
List of Tables
1. Landsat 7 ETM characteristics……….. 5
2. fAPAR equations used by Net Pro v. 1.0……….. 8
3. Class of NDVI of the Cidanau watershed, 2002 and 2004……… 9
4. LAI of Cidanau watershed………. 18
5. LAI of some vegetation types……… 18
6. NPP of Cidanau watershed, e June……… 20
7. NPP of Rawa Danau preserve, e June………... 21
8. NPP of Cibojong, e June……… 23
9. NPP of Citaman, e June………. 23
10. Cibojong and Citaman carbon appraisal under a hypothetical CDM……… 24
List of Figures
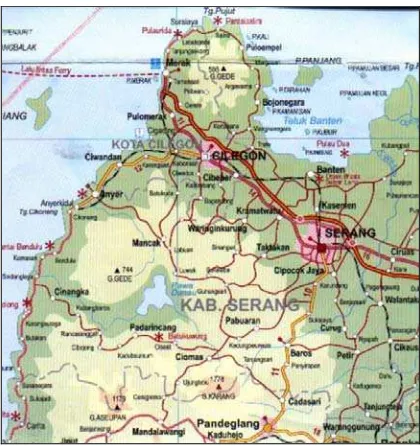
Figure 1. Map of Serang district……… 3
Figure2. Sketch of hypothetical additive reflectance from a two leaf layer canopy (Jensen, 2000)………... 6
Figure 3. The NetPro model user’s interface………... 7
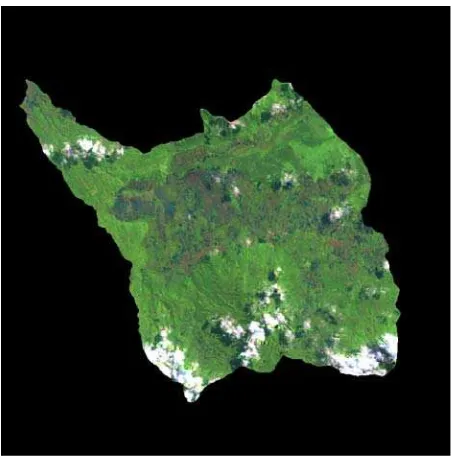
Figure 4. Satellite image of Cidanau watershed 2002………... 10
Figure 5. Satellite image of Cidanau watershed 2004……….. 11
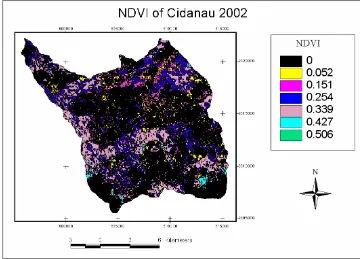
Figure 6. NDVI of Cidanau 2002………. 11
Figure 7. NDVI of Cidanau 2004………. 11
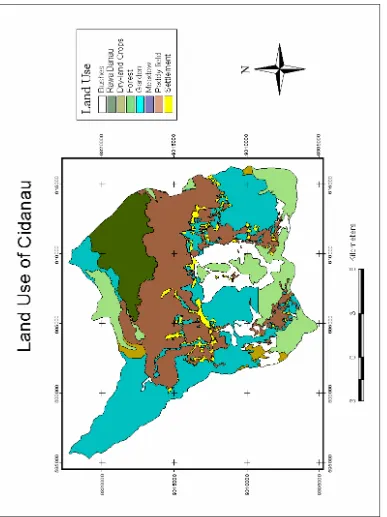
Figure 8. Land use of Cidanau………. 12
Figure 9. Class 1 and 2 NDVI of Cidanau watershed 2002………. 13
Figure 10. Class 4-7 NDVI of Cidanau watershed 2002………. 13
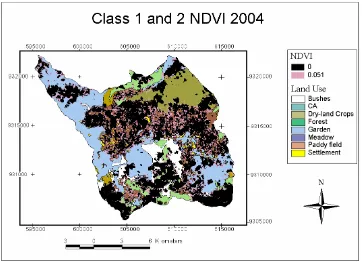
Figure 11. Class 1 and 2 NDVI of Cidanau watershed 2004………... 14
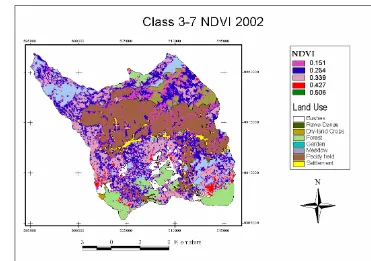
Figure 12. Class 3-7 NDVI of Cidanau watershed 2004………. 14
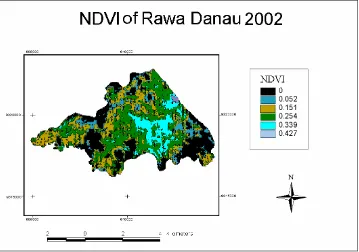
Figure 13. NDVI of Rawa Danau Preserve 2002………. 15
Figure 14. NDVI of Rawa Danau Preserve 2004………. 15
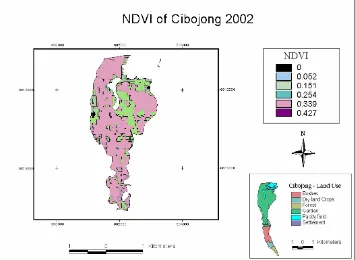
Figure 15. NDVI of Cibojong garden 2002………. 16
Figure 16. NDVI of Cibojong garden 2004………. 16
Figure 17. NDVI of Citaman garden 2002………... 17
Figure 18. NDVI of Citaman garden 2004………... 17
Figure 19. Comparison of per Class NPP Cidanau watershed (e June)………...……… 18
Figure 20. Cidanau watershed NPP of the research years………... 19
Figure 21. Rawa Danau Preserve NPP of the research years………... 20
Figure 22. Cibojong garden NPP of the research years………... 21
I INTRODUCTION 1.1. Research background
Together with technological and industrial development, negative effects from human activities disturb the environment. Those two aspects of human life, development and environment, cannot be treated separately. The increasing population of earth needs development for the quality of life, and human also needs to keep his environment in good condition to support man’s life. Most environmental issues are related to development, they are climate change, biodiversity, endangered species, clean water, forestry, ozone depletion, and sustainable development.
Carbon dioxide is a well-known term in global warming issues. Carbon dioxide is interesting; it is one of major greenhouse gasses, the cause of global warming. Beside that, it is also the main input of an important biological process, the plant’s photosynthesis. Plant, therefore, is believed to reduce its role to global warming effect through photosynthesis. Plant’s carbon sequestration is best described as net primary production (NPP). NPP is the difference between the total carbon uptake from the air through photosynthesis and the carbon loss due to respiration by living plants (June 2004).
This research discussed NPP in Cidanau watershed. The area is economically important since it supplies water for Krakatau Industrial Complex, Suralaya Coal Power Plant, Krakatau Tirta Industri (PT KTI), and a local water company (PDAM) for domestic water use of Cilegon city (Utomo, 1996). Ecologically, it consists of two nature reserves, the Rawa Danau and Tukung Gede Mountain. Rawa Danau is the only remaining fresh water swamp forest in Java. Several researchers (Melisch et al., 1993) also found endemic and rare mammals and bird species, protected under Indonesian law and IUCN list.
The local water company, PT Krakatau Tirta Industri (KTI), local government elements and some institutions established the Communication Forum of DAS Cidanau (FKDC), a forum where Cidanau watershed management is discusSsed among the stakeholders. The local government elements are the Province of Banten government, Kabupaten Serang, Pandeglang, and Cilegon local government. To keep water supply for Cidanau watershed, FKDC discusses compensation from PT KTI for people living in
upper area of Cidanau if they can keep the condition of their environment (FKDC web site).
The purpose of compensation is indeed for the water, but when vegetation is maintained, it can also absorb carbon dioxide, and it is useful to estimate the carbon sequestration of the area. It is still an open chance for Indonesia to get involved in the Clean Development Mechanism (CDM). NPP can be used to describe not only the productivity of forest but also croplands (June, 2004). Regarding the direct payment initiatives are still less common in low-income nations (Ferraro and Simpson, 2005), may be in the future Cidanau watershed can be an example of integrated watershed management in Indonesia where direct payment initiatives for environmental services are arranged.
1.2. Research objective
The objective of this research is to estimate NPP of Cidanau watershed using the prototype of NetPro 1.0 model (June, 2004). It integrates the use of remote sensing and needs satellite images processing. Data used were 2002 and 2004 Landsat 7 images.
II LITERATURE REVIEW 2.1. Issues on carbon dioxide
Global warming, climate change, and carbon issues have been very famous recently. They have been discussed by experts, stakeholders, people in universities, and common people. These global issues for some people sound not very easy to be understood. They include many aspects, not only from climatological and ecological perspectives, but also from social, economical, politics, and agricultural perspectives. This section explains the processes of international agreement on global carbon issue briefly, especially those connected to carbon sink.
and gave three mechanisms about emission reduction to be adopted by the parties. They include the Joint Implementation (JI), the Clean Development Mechanism (CDM), and International Emission Trading (IET) (Haites and Aslam, 2000).
Worries about carbon dioxide based on research show that at pre-industrial time, carbon dioxide concentration was about 280-290 ppm whereas the present concentration is approximately 350 ppm. Carbon dioxide that causes greenhouse effect is originated from fossil fuel burning called anthropogenic. It is proved by the comparison between the amount of C-12 isotope and C-14 isotope. C-12 isotope is a transformed product of C-14 from organic matter for centuries (Bowen, 1991). Fossil fuel contains C-12 rather than C-14 therefore higher C-12 amount in atmosphere shows that the present CO2 is caused more by fossil fuel burning.
Greenhouse effect of carbon dioxide, in fact, has been realized since 1861 by John Tyndall. Carbon dioxide is relatively transparent to the short-wave radiation received from the sun, but is relatively opaque to the long-wave radiation reflected back into space. He speculated that carbon dioxide and water vapour changes in composition could cause mutations of climate. He also measured absorptive properties of chemicals such as nitrous oxide, ozone, and methane, which are now recognized as greenhouse gasses. Next prediction was in 1890 from Svante Arrhenius about the consequence of coal burning during the industrial revolution and the doubling of atmospheric carbon dioxide content, which might lead to a 5oC global warming (Bowen, 1991). Interactions between anthropogenic greenhouse gasses result in greater impact to plant rather than greenhouse gas individual impact, for example, between SO2 and NO2 and between ozone and SO2. Interactions between greenhouse gasses and climatic condition also add stress to plants (Heber et al. 1995).
The increase of carbon dioxide concentration in the atmosphere results changes in natural disturbance, insect herbivores, species composition and diversity, and productivity. These changes remain nonlinear responses to direct and indirect effect to the plants. CO2 enrichment has effect on photosynthesis, increasing of temperature, soil moisture changing, C-N ratio of the plants tissue, and
growing season changing (Clark and Reid, 1993); however, the effects can be advantageous or disadvantageous. U.S EPA reported in 1989 about climate change of aggregate economic impacts on agriculture that was predicted by the Goddard Institute Global Circulation Model. Without considering higher CO2 effect on photosynthesis and improved water-use efficiency, it estimated that net agricultural loss was US $ 5.9 billion; however, when considering those two factors, it estimated that net agricultural gain was $ 10.6 billion (Fisher and Hanemann, 1993).
Global concern about ecological problems and their impacts on human have resulted new paradigm on how people consider about his relation to nature. From control of dominance over nature to in harmony with nature, from economic growth orientations to non-material goals or sustainability and from consumer culture altered to basic needs or recycling habit are examples of the new paradigm (Redclift 1981 in Stehr 1999).
2.2. Issues on Cidanau watershed
Cidanau watershed is located in southern part of Serang, between 6o07’30’’-6o18’00’’ south and 105o 49’00’’-106o04’00’’ east (See map on Figure 1.). Cidanau watershed covers five kecamatan in Kabupaten Serang and one kecamatan in Kabupaten Pandeglang (Appendix 4) and is important for the new province of Banten. It supplies water for domestic and industrial uses for the city of Cilegon. Water from Cidanau is collected to a dam near Cilegon through underground pipe then pumped to Krenceng Water Treatment and Reservoir (Utomo, 1996).
Figure 1. Map of Kabupaten Serang (Bakosurtanal, 2000)
As mentioned before, Cidanau consists of two nature reserves, Rawa Danau and Tukung Gede Mountain. Rawa Danau was gazetted as nature reserve in 1921. The importance of swamps is, it can store water and release it during the dry season and absorb excessive water during the rainy season (Creemers and Postema, 1992); however, it also faces same problems as Cidanau. In addition, noxious exotic species are introduced to the lake such as water hyacinth or eceng gondok (Eichhornia crassipes), Salvinia molesta, and Mimosa pigra, which can block water flow. (Melisch et al. 1993) According to Creemers and Postema (1992), the 2,250 ha nature reserve is too small to stand any increase in agriculture, grazing, fishing, poaching, or firewood cutting disturbances.
Besides Rawa Danau, the watershed consists of another nature reserve, the Tukung Gede. It was gazetted in 1979. With its two nature reserves, Cidanau watershed faces deforestation like other forests in Indonesia do (Rahadian, 2003). Cidanau, like other Indonesian forests elsewhere has been facing deforestation problems for years. Sunderlin et al. (1999) mentioned that the pressures come from shifting cultivation method, tree crop production (rubber), transmigration, population density, and logging and timber plantations. These are cautious because watershed rehabilitation costs are more
expensive than watershed conservation costs (Asdak, 1995).
Regional Planning Board (Bappeda) Serang reported that several active scheme have been taken in Rawa Danau area including reforestation of 200 ha by PT Perhutani (1986), re-greening of 2188 ha by Forest Department (1987), rehabilitation and reforestation of 500 ha (1992/3), replanting of plantation trees of 350 ha (1993/4) (Utomo 1996). However, land clearing and illegal land occupation are still the main problem. FKDC report indicated that problems faced by Cidanau, erosion and siltation, and utilization of chemicals are the cause of eutrophication (Rahadian, 2003).
southern part of Cidanau (Priyanto, staff of Institute of Environment Technology-Indonesian Agency for the Assessment and Application of Technology, pers. comm.).
The scheme is intended to private land managed as garden. Most of garden in Cidanau are planted as agroforest. Well known ecological functions of agroforest are as local species conservation (Hairiah et al., 2003), water and soil conservation (Young 1989), and carbon sequester (IIED, 2000). Therefore, private garden in Cidanau also plays role as carbon sequester.
The importance of the compensation scheme stated by Asdak (1995) that a good watershed management occurs when all costs and benefits of the activities are distributed evenly among the parties i.e. the government, the community group, and local society. In addition, the benefits from ecological improvement from activities held in one area should be returned to the area to keep or improve productivity there, and they should still be suitable to soil and water conservation principles. There is a conclusion from Ferraro and Simpson (2005) that private landowners will devote their holdings to whatever activity provides them with the greatest benefits: purely financial, purely aesthetic, purely ethical, or combination. People cannot be expected to conserve unless they are compensated.
2.3. Net primary production (NPP)
Net Primary Production (NPP) is the difference between the total carbon uptake from the air through photosynthesis and the carbon loss due to respiration by living plants. Moreover, it constitutes to the total annual growth increment (both above and below ground) including the number of grown sheds in senescence, reproduction or death of short-lived individual in a stand and the amount consumed by herbivores (June, 2004). From a number of studies, NPP was obtained approximately 0.45 ± 0.05 of Gross Primary Productivity (GPP) (Coops et al., 1997).
NPP was firstly proposed by Monteith (1972 and 1977, in June 2004) and formulated as:
PAR
f
e
NPP
=
∑
APAR365
1
(1)
Examples of NPP models are Physiological Principles in Predicting Growth, 3PG (e.g. Sampson et al., 2005), Eddy correlations (e.g.
Amiro et al., 2003), annual net biomass accretion (e.g. Lodhiyal and Lodhiyal, 2003), and NetPro (June 2004).
2.3.1. fAPAR and PAR
Photosynthetically Active Radiation, PAR, refers to the part of solar radiation in wavelength which a plant can use for photosynthesis. PAR is in the red and blue parts of visible light portions. Solar radiation absorbed by a plant is called Absorbed PAR (APAR), and the ratio of PAR absorbed by the canopy of the plant is called the fraction of PAR (fAPAR) (Hirano, et al., 1998). fAPAR is estimated using NDVI, and PAR is estimated using daily radiation data.
2.3.2. Radiation use efficiency (e)
Also named The Efficiency index (e), Hirano et al. (1998) defined e as the ratio of radiation energy changed into the organic substances and June (2004) defined it as the mol of CO2 assimilated by plants per mol of absorbed light as. Formulated by June (2004) as:
Ic
Ac
e
=
(2)Ac : Net canopy assimilation rate (μmolm-2s-1) Ic : Light intensity incident on canopy surface
(μmolm-2s-1)
The approach in equation (1) is used by determining the value of e as constant and based on net biomass growth while the NetPro determined e as photosynthesis and respiration approach (June, pers. comm.).
NetPro uses constant and dynamic e. Constant e used are 1.8 gMJ-1 (June, 2004, Coops et al., 1998) and 1.5 gMJ-1 as a global average (Ochi and Murai, 2000 and Hirano et al., 1998). Dynamic e is mechanistically or semi mechanistically modeled daily based on the changing climate and plant parameter like Leaf Area Index. NetPro simulates dynamic e in the based on changing global radiation, temperature, atmospheric CO2 concentration, and leaf nitrogen level (June, 2004).
2.4. Vegetation Indices from Remote Sensing 2.4.1. Landsat 7 ETM
Remote sensing of vegetation can use aeroplane or satellite to carry the sensor and other instruments. This research used Landsat 7 ETM images and ER Mapper 6.4 software to do satellite image processing. ER Mapper has a ready to use equation to calculate NDVI data. Arc View 3.2 software is used to manage and display the data as NetPro model required.
Normalized Difference Vegetation Index (NDVI) is derived from band 3 (red) and band 4 (near infra-red) values of Landsat 7 ETM data (see Table 1).
2.4.2. Normalized Difference Vegetation Index (NDVI)
Normalized Difference Vegetation Index (NDVI) is one of several remote sensing vegetation indices that use red and near-infrared reflectance. The ER Mapper software provides NDVI equation that is ready to run for Landsat image processing. The equations developed by Rouse et al. 1974 (in Jensen, 2000).
red
NIR
red
NIR
NDVI
+
−
=
(3)Table 1. Landsat 7 ETM characteristics
Spectral Resolution (μm)
Spatial Resolution (m) at nadir
1 (blue) 0.450-0.515 30 x 30
2 (green) 0.525-0.605 30 x 30
3 (red) 0.630-0.690 30 x 30
4 (near IR) 0.750-0.900 30 x 30
5 mid-IR 1.55-1.75 30 x 30
6 (thermal IR) 10.40-12.50 60 x 60
7 (mid IR) 2.08-2.35 30 x 30
Band
8 (pan) 0.52-0.90 15 x 15
Sensor Technology Scanning mirror spectrometer
Swath Width 185 km
Date Rate 250 images per day @ 31450 km2
Revisit 16 days
Orbit and Inclination
705 km
sun-synchronous
Inclination=98.2o. Equatorial crossing 10.00
a.m ±15 min.
Launch April 15, 1999
Chlorophyll a absorbs wavelengths of 0.43 μm and 0.66 μm, and chlorophyll b absorbs wavelengths of 0.45 μm and 0.65 μm or mostly in the blue and red portion of electromagnetic spectrums (Jensen, 2000) causing leaves to look green. This kind of interaction and properties between leaves and electromagnetic spectrums are the basis of vegetation indices observation through remote sensing. NDVI is correlated with fraction of PAR absorbed (fPAR) (Coops et al., 1997), and therefore, it is used as an input of NPP estimation.
NDVI describes difference of leaf’s reactions to red and infrared energy. A healthy leaf absorbs red energy for photosynthesis, transmits, and reflects infrared energy. The combination between red and near-infrared reflectance measurement is more highly correlated with biomass than either only red or near-infrared measurement (Jensen, 2000). The greater the red absorption is, and the least the infrared reflection is, indicating greener leaf. Generally, NDVI is known as “greenness index” of a leaf.
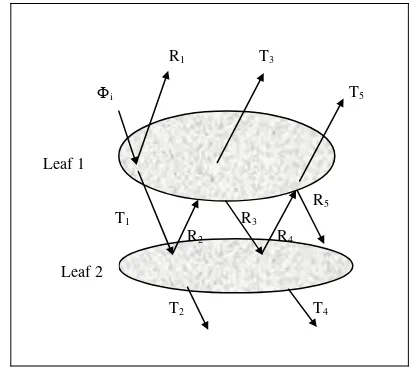
Figure 2. Sketch of hypothetical additive reflectance from a two-leaf layer canopy (Jensen, 2000).
Interaction between near-infrared energy and the leaf is controlled by the spongy mesophyll cells. Heating effect of near-infrared energy can cause irreversible denaturation of its protein. Near-infrared energy is transmitted by the upper leaf layer, and then transmitted again and reflected by the lower layer back to the upper layer. Therefore, the greater the number of leaf layers is, the greater the near-infrared reflectance,
and its spectral properties may provide information on plant senescence and stress (Jensen, 2000) (See Figure 2). Leaf’s treatment to infrared radiation is explained in the following paragraph.
For example, the leaf’s transmittance is 50% and its reflectance is 50% of incident radiant flux (Φ1). Leaf 1 reflects 50% of Φi back (R1) and transmits it onto Leaf 2 (T1). Leaf 2 then transmits 50% of T1 (T2) and reflects it back to Leaf 1 (R2). Leaf 1 once again transmits 50% of R2 (T3) and reflects 50% of R2 (R3) back to Leaf 2. Fifty percents are of R3 reflected back to Leaf 1 (R4) and another 50% is transmitted through Leaf 2 (T4). Fifty percents of R4 are then transmitted by Leaf 1 (T5) and another 50% is then reflected back (R5).
R1 = ½ Φi T1 = ½ Φi T2 = ½ R1 = ¼ Φi R2 = ½ R1 = ¼ Φi T3 = ½ R2 = 18Φi
R3 = ½ R2 = 18Φi
T4 = ½ R3 = 116 Φi
R4 = ½ R3 = 116 Φi
T4 = ½ R4 = 132Φi
R5 = ½ R4 = 132Φi
Additive reflectance from Leaf 1 and Leaf 2 is R1 and T3 is ½ Φi + 18Φi =
8
5 Φi = 62.5 % Φi (based
on Jensen, 2000).
2.5. LAI
LAI, the Leaf Area Index, is the total one-sided green leaf area per unit ground-surface area (Jensen, 2000). It is an important structural variable influences the energy and mass exchange of plant canopies (Amin, 1997).
LAI can be determined on site directly by stripping off all leaves, statistical sampling or by remote sensing (Short, 2002).
model. C3 plant was chosen since 95% of our planet’s vegetation is C3.
Figure 3 The NetPro v. 1.0 model user’s interface
Climate data needed are hourly climate data of maximum and minimum air temperature and global radiation. When hourly data are not available, it can be generated from daily data.
2.6. The NetPro Model
NetPro is a potential NPP estimation model. In this model, water effect is not included yet. The model integrates the use of remote sensing and geographic information system (GIS), and written in Visual Basic 6.0 programming and Map Objects 2.1. It uses C3 plant photosynthesis
NDVI input is from Landsat image processing then used as an input of LAI and fAPAR calculation. fAPAR is used for NPP estimation using equation (1). PAR is derived from global radiation data. The model uses radiation use efficiency e based on Ochi and Shibasaki (1999) or June (2004) i.e. 1.5 gC MJ-1 and 1.8 gC MJ-1 respectively.
III METHODS
3.1. NDVI
The model requires NDVI input as Arc View shp file. NDVI is obtained from Landsat satellite image processing using the ER Mapper software.
Cidanau watershed boundary was drawn based on Bakosurtanal maps. Land use map was taken from Rekonvasi Bhumi, an NGO concern about Cidanau watershed. Digitations of watershed boundary were done using Arc View software. Output from this process is used to crop satellite images as the boundary of study area.
Before NDVI of Cidanau watershed was calculated, the satellite images were prepared for further process. Output file from ER Mapper was then processed using Arc View software. Result from this step was NDVI classification saved as shp file. NetPro needs average NDVI value per one polygon. The NetPro requires the column of the average NDVI in Arc View given name as “Avgndvi”.
Data used in this research included 22nd May 2002 and 11th May 2004 Landsat images. A one-year NDVI is represented by the image of the year (i.e. 22nd May 2002 data represents 2002’s NDVI). Landsat satellite image NDVI calculation involves channel 3 (red) and channel 4 (infrared). The equation becomes:
3 4
3 4
Channel Channel
Channel Channel
NDVI
+ −
3.2. PAR
PAR is derived from radiation data. The relationship between PAR and radiation is explained by June (2002) as:
PAR = 0.5 x global radiation (5)
Units of PAR and global radiation are Mega Joule per m2 (MJ m-2).
Since radiation data from Geophysics and Meteorology Agency (BMG) are sunshine duration and not in MJ m-2, the data were converted first. Equation (5) is used to do the conversion. N n b a Q Q A
s = + (6)
where Qs = radiation reaching the surface (MJ) QA= radiation reach on the top of the
atmosphere (MJ)
n = actual sunshine duration (%) N = maximum sunshine duration (%) a = 0.29 cos θ
b = 0.52
a and b are constants depend on position of the area.
3.3. fAPAR
fAPAR calculation in NetPro uses some equations based on previous researches and uses NDVI value as the input. fAPAR equations used are shown in the next table.
Table 2. fAPAR equations used by Net Pro v. 1.0
fAPAR equation Source (in June, 2004)
1.075 NDVI - 0.08 (7) Ochi and Shibasaki (1999)
1.25 NDVI - 0.025 (8) Ruimy et al. (1994)
1.62 NDVI - 0.04 (9) Lind and Fensholt (1999)
1.67 NDVI - 0.08 (10) Prince and Goward (1995)
3.4. LAI
LAI calculation in NetPro also uses NDVI as the input. The equation is based on Ibrahim (2001).
LAI = 12.74 NDVI + 1.34 (11)
3.5. NPP
PAR and fAPAR result from NetPro are used as input for NPP calculations (see Equation (1)).
NPP estimation using dynamic e requires minimum and maximum daily temperature. This data is included in Serang daily meteorological data file from Geophysics and Meteorology Agency (BMG) (see Appendix 3).
There are CO2 concentration, temperature increase and nitrogen condition choices in this process. This simulation used present CO2 concentration, 350 ppm; no temperature increase; and lowest choice of leaf nitrogen concentration, 115 mmol m-2. Before the model gives the result, daily and hourly respiration simulation is needed. The model writes the simulation in two csv files which were prepared before the simulation.
IV RESULT AND DISCUSSION 4.1 NDVI
NDVI classification was the first step used for further analysis.
In satellite image processing for this research, missing data, zero or negative NDVI were classified as “Class 1” where zero NDVI was not analyzed further. They represents non-vegetated area. Bare soil and rocks generally have positive but lower NDVI values close to 0 meanwhile water and clouds have negative NDVIs.
Cloudiness in both 2002 and 2004 could affect the estimation of NDVI. Cloud was classified to Class 1 NDVI or zero NDVI. The real NDVI under the cloud could not be estimated. Area not covered by cloud seemed had NDVI change, so it was not possible and improper to guess one image’s NDVI under the cloud based on the other image’s NDVI (i.e. guess the 2002 image’s NDVI under the cloud based on 2004 image’s NDVI for the same place). The solution for this problem was to make union of both image’s cloud. Therefore, 2002 image had both the cloud of 2002 and 2004, and also 2004 image had both the cloud of 2002 and 2004. Before this step was taken, cloudiness in 2004 was higher than in 2002.
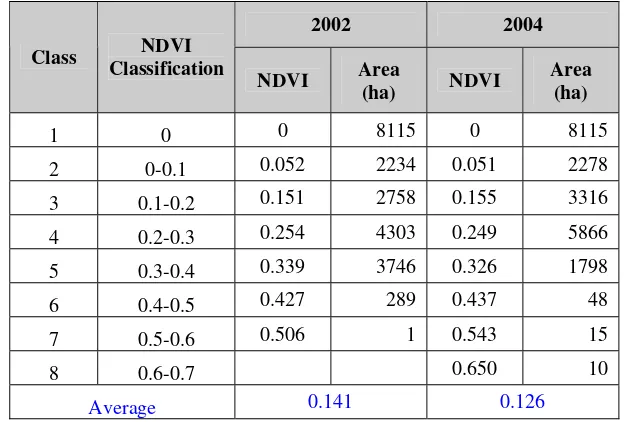
Table 3. Class of NDVI of the Cidanau watershed, 2002 and 2004
2002 2004
Class NDVI Classification
NDVI Area
(ha) NDVI
Area (ha)
1 0 0 8115 0 8115
2 0-0.1 0.052 2234 0.051 2278
3 0.1-0.2 0.151 2758 0.155 3316
4 0.2-0.3 0.254 4303 0.249 5866
5 0.3-0.4 0.339 3746 0.326 1798
6 0.4-0.5 0.427 289 0.437 48
7 0.5-0.6 0.506 1 0.543 15
8 0.6-0.7 0.650 10
Average 0.141 0.126
The highest NDVI class in 2004 was 0.650, which resulted in the highest NPP class.
The NDVI classification can be seen at the Table 3. NDVI was classified according to the range values. Average of an NDVI class was obtained to give an input for NetPro model. The average of NDVI for overall watershed were only 0.141 (2002) and 0.126 (2004) or only in Class 3 range.
In 2002, the site was dominated by Class 4 and Class 5. Meanwhile, in 2004 it was dominated by Class 3 and Class 4. The obvious difference was the area of Class 5 was high in 2002 but then dropped in 2004. This fact would affect the result of NPP estimation explained later.
The position of lower and higher NDVI can be analyzed visually by comparing its distribution with the land use of Cidanau. Because the main interest in Cidanau is about the maintenance of private garden, the NDVI of private garden is important. This NDVI value is used to estimate NPP of the research site.
The position of lower NDVI, the Class 1 and Class 2, in 2002 and in 2004 was mainly in paddy field and forest in higher land (figure 8-12). The lower NDVI classes occurred in forested area were caused by cloudiness in the satellite image (see figure 4 and 5). Higher NDVI in both research years occurred in forest and Rawa Danau preserve as well as in private garden land. Higher NDVI classes are Class 4 and higher. The
LAI of higher NDVI classes were in forest LAI range.
4.2. LAI
LAI is correlated to NDVI based on Equation 11. Class 2, Class 4 and Class 5 NDVI were higher in 2002 than in 2004 caused the LAI of Class 2, Class 4 and Class 5 were higher in 2002 than in 2004.
Figure 4. Satellite image of Cidanau watershed 2002
Figure 6. NDVI of Cidanau 2002
12
Fi
gu
re
8.
Lan
d
Use
o
f C
ida
na
u
wat
ers
Figure 9. Class 1 and 2 NDVI of Cidanau watershed 2002
Figure 11.
Class 1 and 2 NDVI of Cidanau watershed 2004Figure 13.
NDVI of Rawa Danau Preserve 2002Figure 15.
NDVI of Cibojong garden 2002Figure 17.
NDVI of Citaman garden 2002Table 4 LAI of Cidanau watershed NDVI Class 2002 LAI 2004 LAI
2 2.0 2.0
3 3.3 3.3
4 4.6 4.5
5 5.7 5.5
6 6.8 6.9
7 7.8 8.3
8 - 9.6
Average 4.3 5.0
Table 5. LAI of some vegetation types
Vegetation Type LAI Low-vegetated burnt
forest 2.5-6.3
Low-vegetated forest 2.5-3.2 Primary forest 4.4-8.4 Conifer forest 1.4-3.9
Garden 1.0-3.3 Young conifer forest 5.3-9.6
Mature conifer forest 7.9-13.0
Source: Turner, et al. (1999) in Djumhaer (2003)
4.3. NPP
fAPAR used in this research was Prince and Goward’s fAPAR (1995) because it represented all biomes in the world. It was also newer than Ruimy’s all biomes fAPAR equation (1994).
There was a problem when using the NetPro v 1.0 to estimate 2004 NPP. The model cannot run. Then, it was known that 2004 was a leap year and consisted of 366 days; therefore, it was different from the other two years. The problem had to be solved so that the 2004 NPP could still be estimated. The step taken was the 29th February data of 2004 was erased to make its day number to 365.
4.3.1 NPP of Cidanau Watershed
NPP does not only depend on the NDVI class’ average but also on how wide the class is. High Class 5, 6, 7, and 8 NDVI occurred in 2004 but in narrower area. The fall was obvious for Class 5 in 2004 compared with 2002. NPP become higher in 2002 than in 2004. Light use efficiency parameters (e) from June (2002) and Ochi and Shibasaki (1999 in June 2004) produced the same results where the 2002 NPP was the highest NPP (Fig. 4).
The run of the model resulted same NPP class as the NDVI class of shp file input. There were seven NPP classes in 2002 and eight in 2004. The comparison of per class NPP showed
the higher Class 2 occurred in 2002 (50 gC m-2 year-1), Class 3 occurred in 2004
(1318 gC m-2 year-1), Class 4 in 2004 (2473 gC m-2 year-1) with slightly difference with 2002 (2463 gC m-2 year-1), Class 5 in 2002 (3479 gC m-2 year-1), Class 6 and Class 7 in 2004 (4785 gC m-2 year-1 and 6087 gC m-2 year-1), and only 2004 had Class 8 (7361 gC m-2 year-1). This rank result was same for e June and e Ochi and Shibasaki. The NPP in brackets are when e June was used (see Table 6), when e Ochi and Shibasaki and dynamic e were used can be read in Appendix 1, respectively. For better understanding, the illustrations are in Figure 19.
The Class 8 of the year 2004 had fAPAR 1.000. The Prince and Goward’s fAPAR equation (1995) gave more than 1.000 fAPAR but the model displayed and considered the fAPAR as 1.000. fAPAR is fraction of absorbed PAR that can not be more than 1.000. This number has already described that the plants absorbed all part of PAR.
When the total NPP compared, total NPP in 2002 was 28451488 gC and in 2004 was 25496753 gC. Divided by the total area of Cidanau , the annual NPP became 1327 gC m -2
N P P of C i da n a u Wa t e rs h e d, pe r Cl a s s (e J u n e )
0 1000 2000 3000 4000 5000 6000 7000 8000
1 2 3 4 5 6 7 8
NPP Classes
NP
P
(
g
C
/m
2/y
r)
2002 2004
Figure 19. Comparison of per Class NPP of Cidanau Watershed (e June)
NPP of Cidanau Watershed
0 200 400 600 800 1,000 1,200 1,400 1,600 1,800
e June e Ochi &Shibasaki Dynamic e
e
NP
P
(
g
C/
m
2 /y
r)
2002 2004
Figure 20. Cidanau watershed NPP of the research years
The year of 2004 had the highest per class NPP and had more NPP classes than the year of 2002 but still it could not reach the highest annual NPP. The area of NDVI classes in Table 3 shows that higher NDVI classes in 2004 covered narrower area. It means that there were decrease of NDVI in 2004 and also resulted in decrease of NPP. The fall of NDVI represented decrease in the “greenness” of the land.
Table 6. NPP of Cidanau watershed – e June
2002 2004
NDVI
Class NPP Class
(gC m-2 year-1)
Area (ha)
Total per Class NPP
(gC year-1)
NPP Class (gC m-2 year-1)
Area (ha)
Total per Class NPP
(gC year-1)
1 0 8115 0 0 8115 0
2 50 2234 111946 37 2278 83842
3 1231 2758 3395821 1318 3316 4369168
4 2463 4303 10596241 2473 5866 14508167
5 3479 3746 13032450 3415 1798 6140995
6 4531 289 1309555 4785 48 229660
7 5476 1 5476 6087 15 91312
8 7361 10 73609
Total 21446 28451488 21446 25496753
Annual NPP (gC m-2 year-1) 1327 1190
4.3.2 NPP of Rawa Danau Preserve
The most interesting part of Cidanau watershed is the Rawa Danau Preserve. The preserve acts as water reservoir for the watershed. There are many illegal settlers there who open the land and convert it to agricultural land (Priyanto, pers. comm.). It is also interesting to estimate the NPP of the preserve. Class 1 NDVI (null NDVI) in this preserve in 2002 and 2004 were caused by cloud cover and cloud shadow. The occurrence of Class 1 did not mean the preserve have large open area with no vegetation. Converted area is not abandoned but cultivated with crops and paddy (personal observation).
NDVI classification of the preserve was the same as watershed NDVI classification. This made annual NPP also same as watershed’s, only in different width. Different NPP occurred when dynamic e was used. Complete result can be seen in Table 7 (e June) and Appendix 1 (e Ochi and Shibasaki and dynamic e). Unlike the total Cidanau watershed NPP, Rawa Danau NPP was higher in 2004 than in 2002. The watershed consists of non-vegetation or low NDVI land covers whereas Rawa Danau covered mostly by vegetation. Annual NPP of Rawa Danau was higher than annual NPP of overall Cidanau.
Total NPP of Rawa Danau in 2002 was 3386801 gC and in 2004 was 4079126 gC. Divided by the total area of Rawa Danau, the
NPP became 1481 gC m-2 year-1 in 2002 and 1784 gC m-2 year-1 in 2004.
4.3.3 NPP of water compensation payment scheme site
Water compensation scheme in Cidanau for land conservation to keep water supply for the low land people are done in Kelurahan (village) Cibojong, Kecamatan Padarincang and Kelurahan Citaman, Kecamatan Ciomas.
As mentioned before, private garden, including those in Cibojong and Citaman, had the potency to absorb carbon dioxide. This section gives the result of the NPP estimation of two villages.
NDVI classification used for this estimation was same as NDVI classification used in whole watershed NPP classification. The estimation of the area was only done for land cover classified as garden.
Total NPP of Cibojong in 2002 was 11292510997 gC and in 2004 was 9529383586 gC. Meanwhile, the total NPP of Citaman in 2002 was 8678303186 gC and in 2004 was 8776974540 gC.
After divided by the total area, Citaman NPP
changed slightly in 2002 and 2004 (2060 gC m-2 year-1 to 2102 gC m-2 year-1). On
N P P of Ra w a D a n a u P re s e rve
0 200 400 600 800 1000 1200 1400 1600 1800 2000
e June e Ochi &Shibasaki Dynamic e
e
N
PP (
g
C
/m
2 /y
r)
2002 2004
[image:31.612.149.489.100.306.2]Figure 21. Rawa Danau Preserve NPP of the research years
Table 7. NPP of Rawa Danau Preserve - e June
2002 2004
NDVI
Class NPP Class
(gC m-2 year-1)
Area (ha)
Total per Class NPP
(gC year-1)
NPP Class
(gC m-2 year-1)
Area (ha)
Total per Class NPP
(gC year-1)
1 0 491 0 0 491 0
2 50 267 13379 37 93 3423
3 1231 538 662419 1318 428 563934
4 2463 732 1802568 2473 915 2263037
5 3479 252 876716 3415 346 1181749
6 4531 7 31719 4785 14 66984
Total 2287 3386801 2287 4079126
N P P of C i bojon g Ga rde n
0 500 1000 1500 2000 2500 3000 3500
e June e Ochi & Shibasaki Dynamic e
e
NP
P
(
g
C/
m
2
/y
r)
[image:32.612.165.476.85.283.2]2002 2004
Figure 22. Cibojong garden NPP of the research years
N P P of C i t a m a n Ga rde n
0 500 1000 1500 2000 2500
e June e Ochi & Shibasaki Dynamic e
e
N
PP (
g
C
/m2
/y
r)
[image:32.612.167.476.308.515.2]2002 2004
Table 8. NPP of Cibojong, e June
2002 2004
NDVI
Class NPP Class
(gC m-2 year-1) Area (ha)
Total per Class NPP
(gC year-1)
NPP Class
(gC m-2 year-1) Area (ha)
Total per Class NPP
(gC year-1)
1 0 0 0 0 1 0
2 50 3 1641978 37 8 2845001
3 1231 11 132441608 1318 30 395280600
4 2463 80 1978041660 2473 178 4404233284
5 3479 248 8637024652 3415 137 4679178830
6 4531 12 543361099 4785 1 47845870
Total 355 11292510997 355 9529383586
[image:33.612.103.528.99.491.2]Annual NPP (gC m-2 year-1) 3184 2685
Table 9. NPP of Citaman, e June
2002 2004
NDVI
Class NPP Class
(gC m-2 year) Area (ha)
Total per Class NPP
(gC year-1)
NPP
(gC m-2 year-1) Area (ha)
Total per Class NPP
(gC year-1)
1 0 4 0 0 0 0
2 50 24 12190645 37 24 8953835
3 1231 101 1239289607 1318 101 1326192528
4 2463 270 6658698534 2473 270 6687739641
5 3479 22 768124400 3415 22 754088536
Total 417 8678303186 417 8776974540
Annual NPP (gC m-2 year-1) 2060 2083
4.4 Carbon appraisal
From the climate change scope, environmental service payment scheme in Cidanau promotes afforestastion or revegetation activities and prevent deforestation. If they were qualified under the Clean Development Mechanism (CDM) rules, the establishment of CDM project is possible in the future (van den Sand, 2004).
According to the Ministry of Environment of Republic of Indonesia report, carbon prices traded under the CDM will range from 1.75 USD/ton CO2 to 10 USD/ton CO2 (Michaelowa, 2001) over the first full commitment period (2008-2012). In this section a comparison was made between the money received from environmental service payment in Cidanau and
hypothetical money they could receive from the CDM.
Table 10. Cibojong and Citaman carbon appraisal under a hypothetical CDM
Cibojong Citaman
2002 2004 2002 2004
Total C (ton) 11292.511 9529.384 8678.303 8776.975
[image:34.612.85.506.472.668.2]Total CO2 (ton) 41405.874 34941.073 31820.445 32182.240 $1.75/ton 659,388,538 556,436,590 506,740,587 512,502,172 CO2 value
(IDR)* $10.00/ton 3,767,934,503 3,179,637,657 2,895,660,496 2,928,583,838 $1.75/ton 1,859,423 1,573,182 1,203,011 1,216,689 CO2 value/ha
(IDR)* $10.00/ton 10,625,272 8,989,610 6,874,349 6,952,509 * US $ 1=around Rp. 9100 at the time of writing
4.5 The worlds’ NPP
World and tropical NPP can be seen on Table 11 as a comparison for Cidanau watershed, Rawa Danau reserve, and water compensation payment scheme area NPP of two research years, 2002 and 2004.
Cidanau watershed NPP (1327 gC m-2 year1 in 2002 and 1190 gC m-2 year-1 in 2004) can be compared with Lore Lindu (Indonesia) and Luquillo Mt (Puerto Rico). These research sites have not only forest but mixed land cover, same as Cidanau. Compared with other tropical biomes’ NPP in Table 11, Cidanau NPP was still lower (More worlds’ NPP can be read in Appendix 2).
NPP of parts of Cidanau, Rawa Danau reserve and water compensation payment scheme area (Cibojong and Citaman) also compared with worlds’ NPP. Rawa Danau area NPP (1481 gC m-2 year-1 and 1784 gC m-2 year-1) can be compared with La Selva (Costa Rica). Citaman NPP (2060 gC m-2 year-1 and 2102 gC m-2 year-1) also can be compared with La Selva (Costa Rica). Cibojong NPP (3184 gC m-2 year-1 and 2684 gC m-2 year-1) is the highest NPP in Cidanau area in this research. Its NPP, even it fell in 2004, can be compared with primary forest of San Carlos de Rio Negro (Venezuela), and well-preserved primary forest of Khao Chong. Khao Chong site is the highest NPP in Table 11. Costa Rica, in this case La Selva, is a good comparison because since 1985 Costa Rica has done much effort to maintain their forest (Rahadian, 2003).
Table 11. World’s tropical NPP
Area NPP (gCm-2year-1) Ecoregion
Luquillo mountains, Puerto Rico# 384 Pine forest, secondary forest, savanna
Pasoh, Malaysia# 2780 Lowland dipterocarp forest
La Selva, Costa Rica# 1400-2100 Primary forest, secondary forest, abandoned land Khao Chong, Thailand# 2860 Well-preserved rain forest
Kade, Ghana# 2200-2500 Secondary forest, semi-deciduous forest San Carlos de Rio Negro, Venezuela# 1800 – 2700 Primary forest
Lore Lindu, Indonesia(June, 2006) 1330 Primary forest
Global (Ruimy, 1994) 60 Gt Cyr-1
(biomass)
#Source: Oak Ridge National Laboratory Distributed Active Archive Center Net Primary Productivity (NPP)
V CONCLUSION AND SUGGESTION Estimations of Cidanau watershed NPP in 2002 and 2004 showed that the highest NPP class was reached in 2004, but the highest annual NPP was reached in 2002. The 2004 NPP was lower and the fall caused by the decrease in NDVI, where the higher NDVI classes were narrower than in 2002. The highest per class NPP was
Class 8 of 2004 where NPP was estimated 7361 gC m-2 year-1 (e June). The highest annual
NPP was 1327 gC m-2 year-1 (e June) in 2002. NPP of parts of Cidanau, Rawa Danau preserve, water compensation payment scheme area (Citaman and Cibojong) can be compared with other tropical biomes and they were mainly compared with tropical forest. NPP of Rawa Danau preserve were 1481 gC m-2 year-1 (2002) and 1784 gC m-2 year-1 (2004), NPP of Cibojong were 3184 gC m-2 year-1 (2002) and 2684 gC m-2 year-1 (2004), and NPP of Citaman were 2060 gC m-2 year-1 (2002) and 2102 gC m-2 year-1 (2004). It means that Cidanau watershed, like tropical forests do, has the potency to absorb carbon dioxide.
Two research years, 2002 and 2004, were before the compensation scheme began. It is useful to estimate following years’ NPP during the water compensation scheme especially in the paid villages. The estimation can show enhanced, constant, or declined NPP during the scheme.
The NetPro model can make estimation of NPP easier in estimating NPP when using difference fAPAR and e, especially the dynamic e. From the experience using the model, a hint for using the model, it is important to put the right order of steps.
REFERENCES
Amin, M.S.M, Amjad Nabi and Shattri Mansor. 1997. Use of satellite data to estimate areal evapotranspiration from a tropical watershed. Asian Association on Remote Sensing.
Amiro, Brian D., J. Ian MacPherson, Ray L. Desjardins, Jing M. Chen, Jane Liu. 2003. Post-fire carbon dioxide fluxes in the western Canadian boreal forest: evidence from towers, aircraft and remote sensing. Agricultural and Forest Meteorology 115 (2003) 91-107. TEEAL 405.
Asdak, Chay. 1995. Hidrologi dan pengelolaan DAS. Gadjah Mada Univ. Press., Yogyakarta.
Bapeda Kabupaten Serang. 1999. Potensi Desa. In Rencana teknik lapangan rehabilitasi lahan dan konservasi tanah DAS Cidanau
Bowen, Robert. 1991. Isotopes and climates. Elsevier applied science, London-New York.
Clark, James C. and Chantal D. Reid. 1993. What are non-linear responses at the biome level? In Joel Darmstadter and Michael A. Toman. Assessing surprises and nonlinearities in greenhouse warming. Proceedings of an interdisciplinary workshop. Resources for the Future, Washington DC.
Conway, Eric D. and the Maryland Space Grant Consortium. 1997. An introduction to satellite image interpretation. John Hopkins Univ. Press, Baltimore.
Coops, N.C., R.H. Waring, J.J. Landsberg. 1998. Assessing forest productivity in Australia and New Zealand using a physiologically-based model driven with averaged monthly weather data and satellite-derived estimates of canopy photosynthetic capacity. Forest Ecology and Management 104 (1998) 113-127. Elsevier. TEEAL 226
Creemers, Astrid and Celestine Postema. 1992. Conservation of the Rawa Danau Nature Reserve and the Local Community. Draft. Asian Wetland Bureau, Bogor.
Djumhaer, Marwan. 2003. Pendugaan Leaf Area Index dan Luas Bidang Dasar Tegakan Munggunakan Landsat 7 ETM+ (studi kasus di Kabupaten Bungo Propinsi Jambi). Department of Forestry Management Faculty of Forestry Bogor Agricultural University. Undergraduate research.
Forests, Trees, and Livelihoods. Vol. 15 2005. p167-187. AB Academic Publishers.
Fisher, Anthony C. and W. Michael Hanemann. 1993. Assessing climate change risks: valuation of effects. In Joel Darmstadter and Michael A. Toman. Assessing surprises and nonlinearities in greenhouse warming. Proceedings of an interdisciplinary workshop. Resources for the Future, Washington DC.
Hairiah, Kurniatun, Mustofa Agung Sardjono, Sambas Sabarnurdin. 2003. Pengantar Agroforestri. World Agroforestry Centre (ICRAF) Southeast Asia.
Forum Komunikasi DAS Cidanau. www.cidanau.org.
Haites, Erik and Malik Amin Aslam. 2000. The Kyoto Mechanisms and global climate change-coordination issues and domestic policies. Pew Center on Global Climate Change.
Heber, U., W. Kaiser, M.Luwe, G. Kindermann, S. Veljovic-Javanovic, Z. Yin, H. Pfanz, and S. Slovik. 1995. Air pollution, photosynthesis and forest decline: Interactions and consequences. In Ernst-Detlef Schulze Martyn and M. Caldwell. Ecophysiology of photosynthesis. Springer-Verlag, Berlin.
Hirano, Yujiro, Shiro Ochi and Ryosuke Shibasaki. 1998. Estimation of agricultural productivity distribution in India. Asian Association on Remote Sensing.
Hooda, R.S., and D.G.Dye. 1996. Estimating carbon-fixation in India based on remote sensing data. Asian Association on Remote Sensing.
Ibrahim. 2001. Assessing mangrove leaf area index and canopy closure. Environment and development in coastal region and in small island. Asian Association on Remote Sensing.
International Institute for Environment and Development. 2000. Interactions of Forest, Land Use and Rural Livelihoods. Natural Resource Issues Paper.
Jensen, John R. 2000. Remote Sensing of the Environment, an earth resource perspective. Prentice Hall, New Jersey.
June, Tania. 2004. Development of mechanistic model for CO2 absorption of forest and plantation: study case Lore Lindu National Park. Biotrop-ICSEA, Bogor.
June, Tania. 2006. Pengembangan Model Penyerapan Karbon Hutan Dengan Mengintegrasikan Penggunaan Remote sensing Dan GIS: Scaling up dari daun ke ekosistem. Makalah Dosen Berprestasi IPB.
Koesmaryono, Yonny dan Handoko. 1995. Klasifikasi Iklim. In Handoko. Klimatologi Dasar. Jakarta, Pustaka Jaya.
Lodhiyal, Neelu, L.S. Lodhiyal. 2003. Biomass and net primary productivity of Bhabar Shisham forest in central Himalaya, India. Forest Ecology and Management 176 (2003) 217- 235. TEEAL 406
Melisch, Roland, Yus Rusila Noor, Wim Giesen, Enis Widjanarti, Rudyanto. 1993. An assessment of the importance of Rawa Danau for nature conservation and an evaluation of resource use. Direktorat Jenderal PHPA and Asian Wetland Bureau- Indonesia, Bogor.
Michaelowa, Axel. 2001. Summary for Policy Makers. In National Strategy Study on Clean Development Mechanism in Indonesia (ed. Audrey Gaughran). Ministry of Environment Republic of Indonesia.
Mickler, R.A., T.S. Earnhardt, J.A. Moore. 2002. Regional estimation of current future forest biomass. Environmental pollution 116 (2002) S7-S16. Elsevier Science Ltd.
NASA. Studying Earth's Environment From Space. June 2000.
www.ccpo.odu.edu/SEES/index.html. [Accessed at: April, 2006]
Ochi, Shiro and Ryosuke Shibasaki. 1999. Estimation of NPP based agricultural production for Asian countries using remote sensing data and GIS. Asian Association on Remote Sensing.
Ochi, Shiro, and Shunji Murai. 2000. Assessment of crop productivity for major river basins in Asia using GIS and RS data. Asian Association on Remote Sensing.
Rahadian & Andri A. Siregar. 2003. Serius yuk, ngelestariin Cidanau Kita. Forum Komunikasi DAS Cidanau Propinsi Banten.
Rahadian. 2003. Semangat baru membangun hutan dari Costa Rica. Lembaga Swadaya Masyarakat Rekonvasi Bhumi.
Ruimy, A., B. Saugier, and G. Dedieu (1994). Methodology for the estimation of terrestrial net primary production from remotely sensed data. [abstract] J. Geophys. Res., 99(D3), 5263–5284.
Sampson, D.A. , R.H. Waring, C.A. Maier, C.M. Gough, M.J. Ducey, and K.H. Johnsen. 2005. Fertilization effects on forest carbon storage and exchange, and net primary production: A new hybrid process model for stand management. Forest Ecology and Management. In press.
Short, Nicholas M. 2002. Vegetation applications: agriculture, forestry, and ecology. General principles for recognizing vegetation in remote sensing tutorial. rst.gsfc.nasa.gov [Accessed at: May, 2005]
Stehr, Nico. 1999. “Mastering” the global commons. In Hans von Storch, Götz Flöser. Anthropogenic climate change. Springer-Verlag, Berlin.
Sunderlin, William D., Ida Ayu P. Resosudarmo. 1999. Rates and causes of deforestation in Indonesia: towards a resolution of the ambiguities. CIFOR occasional paper no. 9. CIFOR, Bogor.
Utomo, Sugeng Tri. 1996. Lake management in Indonesia. Case study: Lake Rawa Danau. BPPT-UNEP. Workshop on technology needs for lake management in Indonesia. 16-17 January 1996.
Van den Sand, Isabel. 2004. Assessing the use of environmental service payment as a potential adaptation strategy to climate change in the Cidanau waterhed, Banten, Indonesia. Thesis. Imperial College, London.
APPENDIX 1. NetPro v. 1.0 Output – e Ochi & Shibasaki and Dynamic e Table 1. Cidanau watershed NPP - e Ochi & Shibasaki
2002 2004
Class
Per Class NPP Area Total
per Class NPP Per Class NPP Area
Total per Class NPP
1 - 4745 - - 5522 -
2 42 3424 142,979 31 3243 99,463
3 1,026 3664 3,759,455 1,098 4148 4,554,512
4 2,052 4971 10,201,009 2,061 6537 13,473,103
5 2,899 4222 12,240,393 2,846 1902 5,413,503
6 3,776 406 1,533,100 3,987 56 223,281
7 4,564 2 9,127 5,073 18 91,312
8 6,134 8 49072.696
Total (gC/ year) 27,886,063 23,904,247
Annual NPP (gC/m2/year) 1301
1115
Table 2. Cidanau watershed NPP – Dynamic e
2002 2004
Class
Per Class NPP Area Total
per Class NPP Per Class NPP Area
Total per Class NPP
1 - 4745 - - 5522 -
2 25 3424 85,292 18 3243 57,904
3 760 3664 2,784,596 803 4148 3,330,102
4 1,760 4971 8,750,894 1,729 6537 11,301,591
5 2,670 4222 11,274,251 2,569 1902 4,886,655
6 3,602 406 1,462,816 3,803 56 212,976
7 4,372 2 8,745 4,858 18 87,441
8 5,642 8 46,203
Total (gC/ year) 24,366,594 19,922,870
Annual NPP (gC/m2/year) 1137
[image:38.792.61.593.326.501.2]
Table 3. Rawa Danau NPP - e Ochi & Shibasaki
2002 2004
Class
Per Class NPP Area Total
per Class NPP Per Class NPP Area
Total per Class NPP
1 - 413 - - 127 -
2 42 290 12,110 31 136 4,171
3 1,026 562 576,641 1,098 555 609,391
4 2,052 755 1,549,339 2,061 1074 2,213,571
5 2,899 254 736,395 2,846 374 1,064,485
6 3,776 7 26,433 3,987 15 59,807
Total (gC/ year) 2,900,917 3,951,425
Annual NPP (gC/m2/year) 1272 1732
Table 4. Rawa Danau NPP – Dynamic e
2002 2004
Class
Per Class NPP Area Total
per Class NPP Per Class NPP Area
Total per Class NPP
1 - 413 - - 127 -
2 25 290 7,224 18 136 2,428
3 760 562 427,104 803 555 445,566
4 1,760 755 1,329,056 1,729 1074 1,856,801
5 2,670 254 678,261 2,569 374 960,888
6 3,602 7 25,221 3,803 15 57,047
Total (gC/ year) 2,466,866 3,322,730
Annual NPP (gC/m2/year) 1081
Table 5. Cibojong NPP – e Ochi & Shibasaki
2002 2004
Class
Per Class NPP Area Total
per Class NPP Per Class NPP Area
Total per Class NPP
1 - 103 - - 11,598 -
2 42 32,767 1,368,304 31 77,299 2,370,770
3 1,026 107,566 110,368,043 1,098 294,360 323,208,297
4 2,052 803,258 1,648,368,585 2,061 1,780,737 3,670,193,810
5 2,899 2,482,5945 7,197,521,785 2,846 1,368,519 3,895,100,333
6 3,776 119,912 452,800,896 3,987 4,500.000 17,942,202
Total (gC/ year) 9,410,427,613 7,908,815,411
Annual NPP (gC/m2/year) 2654
2236
Table 6. Cibojong NPP – Dynamic e
2002 2004
Class
Per Class NPP Area Total
per Class NPP Per Class NPP Area
Total per Class NPP
1 - 103 - - 11,598 -
2 25 32,767 816,172 18 77,299 1,380,102
3 760 107,566 81,742,755 803 294,360 236,305,456
4 1,760 803,258 1,413,958,675 1,729 1,780,737 3,078,494,005
5 2,670 2,482,5945 6,629,203,676 2,569 1,368,519 3,515,954,914
6 3,603 119,912 432,037,168 3,803 4,500.000 17,113,820
Total (gC/ year) 8,557,758,447 6,849,248,296
Annual NPP (gC/m2/year) 2413
Table 7. Citaman NPP – e Ochi & Shibasaki
2002 2004
Class
Per Class NPP Area Total
per Class NPP Per Class NPP Area
Total per Class NPP
1 - 37,671 - - 37,671 -
2 42 243,278 10,158,790 31 243,278 7,461,327
3 1,026 1,006,520 1,032,741,674 1,098 1,006,520 1,105,160,775
4 2,052 2,704,014 5,548,917,248 2,061 2,704,014 5,573,115,466
5 2,899 220,787 640,103,777 2,846 220,787 628,407,150
Total (gC/ year) 7,231,921,489 7,314,144,719
Annual NPP (gC/m2/year) 1717
1736
Table 8. Citaman NPP – Dynamic e
2002 2004
Class
Per Class NPP Area Total
per Class NPP Per Class NPP Area
Total per Class NPP
1 - 37,671 - - 37,671 -
2 25 243,278 6,060,291 18 243,278 4,343,966
3 760 1,006,520 764,957,076 803 1,006,520 808,068,333
4 1,760 2,704,014 4,760,080,751 1,729 2,704,014 4,675,012,481
5 2,670 220,787 589,580,232 2,569 220,787 567,253,380
Total (gC/ year) 6,120,678,350 6,054,678,160
APPENDIX 2. NPP of several world biomes
Table 1. NPP of several world biomes
Area NPP Note Ecoregion
Temperate forests
in North America*
2.250-2.602 x 10¹⁵ g C/yr
The Osnabrück Model (OBM), the Terrestrial Ecosystem Model (TEM) (a process-based model)
Oregon and
Washington states*
<100 to 1500 g C/m2/yr #
300 to 150,000 g C/m2
1 to 47
OTTER project
net primary production (NPP, estimated as the sum of annual stem, branch, and foliage production)
aboveground biomass
leaf area index (all sides)
#the minima and maxima for these parameters were in the shrub-steppe and the coastal forest zones
Oregon*
53-1310 g/m2/yr
ε=0.5 g/MJ (shrub sites) and 0.9 g/MJ (forested sites)
aboveground net primary production (ANPP)
Oregon Transect Ecosystem Research Project (OTTER)- The Thematic Mapper Simulator (TMS)
Global*
62.1 Gt C/yr
800.6 Gt C
NPP
biomass
A process-based model of the terrestrial biosphere, DEMETER Western Oregon,
USA
( dominated by coniferous evergreen forests) * 0.8 g/MJ 1.3 g/MJ 300-2600 g/m2/yr
LUE (aboveground NPP)
LUE (total NPP)
NPP
OTTER project
North America* 7.032 x 10 15
g C/yr
The terrestrial ecosystem model (TEM)
Cinnamon Bay Watershed, U.S. Virgin Islands*
1064 gC/m2/yr Average above-ground NPP
Luquillo
mountains, Puerto Rico*
384 gC/m2/year Pine, secondary
Table 1 (Continued)
Area NPP Note Ecoregion
Pasoh, Malaysia*
2780 gC/m2/year
Lowland dipterocarp forest
La Selva, Costa Rica*
1400-2100 gC/m2/year
Primary forest, secondary forest, abandoned land Khao Chong,
Thailand*
2860 gC/m2/year
Well-preserved rain forest
Lore Linde 1330
gC/m2/year June, 2006 Kade, Ghana* 2200-2500
gC/m2/year
Secondary forest, semi-deciduous forest San Carlos de Rio
Negro, Venezuela*
1800 - 2700
gC/m2/year Primary forest
Southern USA*
1181 gC/m2/yr (Oklahoma, minimum)- 2047 gC/m2/yr (Lousiana, maximum)
1116 gC/m2/yr (Oklahoma, minimum)- 2108 gC/m2/yr (Florida, maximum)
1992 predicted average NPP
2050 predicted average NPP
PnET model (Mickler, 2002) (Asian)
Mixed forest Grasslands
1078 g C/m2/yr
629 g C/m2/yr Ochi and Shibasaki (1999)
Global 60 Gt C/yr Ruimy et al., 1994
[image:43.612.89.530.106.526.2]APPENDIX 3. NetPro Climate Data Input (BMG Serang Climatology Station)
2002Julian Date
Sunshine Duration
(%)
Global Radiation
(MJ/m2)
Tmax
(oC)
Tmin
(oC)
Julian Date
Sunshine Duration
(%)
Global Radiation
(MJ/m2)
Tmax
(oC)
Tmin
(oC)
1 40 18,55 30,8 23,6 41 38 16,61 29,6 23,4
2 95 29,25 31,8 23,4 42 0 9,73 28,8 24,0
3 59 22,18 30,6 23,4 43 8 11,15 29,4 24,0
4 94 28,95 30,6 23,4 44 5 10,59 29,6 23,8
5 95 29,09 31,0 23,2 45 13 12,00 30,2 23,2
6 100 30,00 31,6 24,7 46 50 18,58 32,0 22,8
7 73 24,72 31,8 24,7 47 63 20,87 31,0 23,6
8 45 19,26 31,4 23,2 48 25 14,06 30,8 23,4
9 54 20,96 32,0 23,6 49 53 19,01 29,6 24,0
10 0 10,52 29,6 24,6 50 77 23,24 29,8 24,2
11 49 19,91 32,0 23,8 51 0 9,56 29,6 24,2
12 63 22,55 32,4 23,6 52 44 17,33 30,4 23,6
13 58 21,55 31,0 22,2 53 0 9,53 28,8 22,4
14 33 16,72 31,0 23,8 54 33 15,33 31,0 23,0
15 100 29,45 31,0 23,8 55 0 9,50 29,6 24,3
16 75 24,64 31,8 23,4 56 33 15,29 31,6 23,0
17 56 20,98 32,3 24,8 57 95 26,16 33,2 21,5
18 0 10,32 29,6 24,0 58 99 26,83 32,4 2