FINANCIAL PERFORMANCE OF AUTOMOTIVE COMPANY
STOCK RETURNS
Rudi Santoso1)
1) Departement of Accounting Computers, STMIK STIKOM Surabaya. email: [email protected]
Abstract: This study aimed to measure the effect of financial performance as represented by the financial ratios of EPS, DER, ROA and ROE for stock returns automotive companies listed on the Stock Exchange in the study period from 2006 to 2010. This study uses a quantitative approach by using regression analysis to determine the effect of simultaneous and caused partial financial performance variables are represented by the financial ratios of stock return. This study used purposive sampling to get the data from 19 issuers listed on the Stock Exchange of automotive and automotive 15 issuers listed on the SET Index Thailand are presented in the form of description. Simultaneously, this study shows the financial ratios have a significant influence on stock returns. The results of regression analysis also shows that the financial ratio contributed as much as 15% impact on stock returns. Partially all the ratios have a significant effect, unless the variable ROE for the T-Statistic 0.613> α 5%. Direction of the relationship of each ratio of stock returns is positive except EPS.
Keywords: Financial Ratio, Financial Performance, Stock
Indonesia is one of the biggest market for the sale of automotive products. Indonesia's automotive sales growth from year to year have a tendency to increase. During 2011 to September or 9 month, total car sales reached 658,009 units (Kompas, October 11, 2011). This means an increase of 21.7% when compared to the same period in 2010.
Compared to other countries such as Thailand Indonesia is still superior to the total retail sales in Indonesia of 506,743. This data is based off of the data AAF (Asean Automotive Federation). Indonesia and Thailand are two countries that keeps pace with the most car sales in Asean. Malaysia was third with sales reaching 347,455 units in 2011, down 2 percent compared with the same period in the prior year. For production, Indonesia has not been able to beat Thailand. In Semester 1 car production in Thailand has reached 954,843 units, 326,852 units, while Indonesia. Exports of cars made Thailand from January to August reached 565,903 units, down 4.5 percent compared to the same period last year.This year, Thailand aims to sell 860,000 units and 1.8 million units of production. It is estimated by the earthquake and tsunami in March 2011 and then in Japan, production is not expected to match the target set at the beginning of the year.
The financial performance of the company is one of the factors for consideration seen investors buy the stock. For the company it is very important. This is because keeping financial performance improvement from year to year is a must if the company still wants to stay within the ranks or groups of companies listed on the Stock Exchange. Wintoro in (Raharjo, 2005) pointed out that the financial statements should have kadungan valuable information that can be used as a decision making reliable and useful. Complete financial report consists of five components, namely: 1) the balance sheet, 2) an income statement, 3) changes in equity report, 4) statement of cash flows, and 5) the notes to the financial statements. (Tandelilin, 2010)
The information provided by the financial statements on at least lets be used by investors to make
an assessment or valuation of shares. This is done to see the extent of the financial reports could reflect the relationship between risk and returns that correspond to their individual preferences. The financial statements could cause a market reaction when it contains accurate information. Market reaction was referring to the behavior of investors and other market participants in the transaction either buy or sell stocks. This is a normative phenomenon in response key decisions are communicated to the market issuers. Husnan in (Raharjo, 2005) pointed out that the market reaction will be indicated by the change of the securities in question.
This study tries to present the performance analysis of the effect of the financial statements as measured by financial ratios of the company's stock return in the Indonesia Stock Exchange and Thailand SET Index particular company in the automotive sector in the period 2006 to 2010.
The hypothesis of this study are as follows:
H1: Financial performance consisting of EPS ratio, DER, ROI, ROA has simultaneously affect the stock returns automotive company in Indonesia Stock Exchange the period 2006 to 2010.
H2: Financial performance as measured by EPS has positive effect on stock returns in Indonesia Stock Exchange automotive period from 2006 to 2010. H3: Financial performance measured by DER has
positive influence on stock returns automotive company in Indonesia Stock bura period from 2006 to 2010.
H4: Financial performance measured by ROA has positive influence on stock returns automotive company in Indonesia Stock native period from 2006 to 2010.
H5: Financial performance measured by ROE positive influence on stock returns automotive company in Indonesia Stock Exchange the period 2006 to 2010.
STIKOM
RESEARCH HISTORY
(Almilia & Kristijadi, 2003) examines the financial ratio analysis to predict the level of financial distress in the manufacturing companies listed on the JSE. The results showed that the profit margin ratio, fianancial leverage ratio, liquidity ratio, and growth are variables that significantly affect the financial distress.
(Trisnaeni, 2007) examines the impact of financial performance consisting of the ratio of EPS, PER, DER, ROI, and ROE partially or simultaneously to stock return of manufacturing companies in the Jakarta Stock Exchange and to determine the ratio of the dominant influence on stock returns of manufacturing companies in the Stock Exchange Jakarta. The results showed that the financial ratios that consists of EPS, PER, DER, ROI, and ROE no effect on stock return simultaneously manufacturing companies listed on the Jakarta Stock Exchange. While the financial ratios that affect stock returns partially on manufacturing companies listed on the Jakarta Stock Exchange is the ratio of PER, so that this ratio changes predominantly affect stock returns of listed companies in Jakarta Stock Exchange.
(Uni, 2006) examined the effect of the company's financial performance measure ROA and ROE to stock return manufacturing companies listed on the Jakarta Stock Exchange. The results showed that there was a positive effect simultaneously between Return on Assets (ROA) and Return on Equity (ROE) to stock return. Partially variable Return on Assets significantly affect stock returns in manufacturing companies.
(Munte, 2009) examined the influence of fundamental factors such as financial ratios measured from the Current Ratio (CR), Return on Equity (ROE), Cash Flow from Operations to Debt (CFOD), Price Book Value (PBV), and firm size SIZE on stock return in the capital market in Indonesia. The analysis showed that a number of factors such as company fundamentals Current Ratio (CR), Return on Equity (ROE), Cash Flow from Operations to Debt (CFOD), Price Book Value (PBV), and firm size SIZE simultaneously are simultaneous influence to stock return. The results showed that the current return on equity has the most dominant influence on stock returns.
(Alwathainani, 2009) in his study revealed that the consistency of the company's financial performance in the past, give effect to the stock price in the next period. In his study of consistency of growth and financial performance are very useful for predicting future stock returns. In his research, he compared the company that consistently rangkin growth rate below 30 per cent gave a higher stock returns than the firms that rate of growth above 30 per cent but is not consistent in its growth.
Capital Market
The capital market is a meeting between the parties who have surplus funds to the needy by way of trade in securities. Thus, the stock market can also be interpreted as the market for traded securities that generally have a lifespan of more than one year, such as stocks and bonds. (Tandelilin, 2010). The capital market is also an activity that is related to the public offering and trading of securities, public companies
relating to the issuance of securities, as well as institutions and professions related to the effect. (Rusdin, 2006).
Capital markets could also serve as intermediaries (intermediaries). This function is critical in supporting economic growth from capital markets to connect the parties with those excess funds need capital.
Shares
Shares is the unit value of books in various financial instruments which refers to the ownership of a company. (Fakhruddin, Hendy, & Darmadji, 2001). Equity shares is also the basis of a limited liability company, as evidence of collective investments in the letter issued to the owner of the shareholders. (Sumantoro, 1990).
According to the website idx (Indonesian Stock Exchange), Stock is one of the instruments of the most popular financial markets. Issuing stock is one of the options when the company decides to finance the company. On the other hand, the stock is an investment instrument that has been chosen for stock investors can provide an attractive rate of return.
Stock Return
Every investor would expect a high return or refund. Return is the return or yield profit on a securities or capital investment, the amount stated in the annual rate of prosestase. Thus the return is the result obtained from the investment. Return to the form of the return realization (Realized return) the return that has occurred or expected return the return that is expected to occur in the future. (Jogiyanto & Hartono, 2000). The purpose of corporate finance is to maximize corporate value. This goal could save a potential conflict between business owners with lenders. If the company enjoys huge profits, the stock market value (fund owner) will increase rapidly, while the value of corporate debt (money lenders) are not affected. Conversely, if the company suffered losses or even bankruptcy, then the creditor rights take precedence while the value of shares will decrease drastically. So thus the value of the shares is the appropriate index to measure the effectiveness of the company, which is often said to maximize the company's value also means maximizing shareholder wealth. Shares of a company can be judged from the return (return) is received by the shareholders of the company. Return to shareholders may be acceptance of a cash dividend or a stock price changes in the period (Beza & Na'im, 1998)
Financial Statement Analysis
One of the stages in the accounting process is important for the purposes of management decision-making is a stage interpretation of accounting reports, which contains covers financial ratios. Financial ratios are an important form of accounting information for the company during a given period. Based on this ratio, we can see who can reveal the financial position, financial condition, and future economic performance in other words accounting information.
Analysis of financial ratio is also an instrument of corporate achievement that describe the relationships and financial indicators are intended to reflect changes in the financial condition or operating performance in
STIKOM
the past. The meaning and usefulness of financial ratios in business practices in reality is subjective, depending on what an analysis to be done in the context of what the analysis is applied.
METHODS
This study used quantitative research methods to examine the effect of independent variables Financial Ratios (X) on the dependent variable, Stock Return (Y). The population in this study were shares of auto sector companies listed on the Stock Exchange and the Thailand SET Index in the study period from 2006 to 2010. The sampling technique using purposive sampling method.
This method was chosen because this research requires a unique object of study in accordance with the objectives of the study. In this sampling was chosen by calculation and careful consideration so as to be relevant as an object of research. Matters to be considered in sampling are as follows:
1. The selected company is a company engaged in the automotive sector.
2. The company is listed on the Indonesia Stock Exchange since 2006 and was active until 2011.
3. Having a complete financial data during the study period.
4. Financial reporting periods used are the annual financial statements as of December 31.
RESULTS
The following will be presented statistical description of automotive companies listed on the Stock Exchange and the Thailand SET Index in the study period from 2006 to 2010.
Table 1 Statistic Description
Period Indonesia 2006 – 2010 Thailand 2010
Veriabel Mean SD Mean SD
RETURN 0,013061 0,011422 0,051689 0,102841
EPS 459,7594 596,2653 27,68533 49,06673
DER 32,14263 126,3667 2,180667 1,136979
ROA 5,554375 4,208626 8,592667 6,723119
ROE 45,24875 122,3721 12,42933 6,295805
In the study period 2006 - 2010 the average value known to return in 19 automotive companies is 0.013061 and the standard deviation is 0.011422. The magnitude of the standard deviation indicates the amount of variation in the return value ever reaches a maximum at the point of 0.040157. This suggests that the value of return on each issuer listed on the Stock Exchange during the study period 2006 - 2010 was very volatile. While the average return in Thailand is 0.051689 with a standard deviation of 0.102841. Range of fluctuating return value is in the range of maximum and minimum 0.368750 0.002440
Classical Test Assumptions Normality
In this study the test for normality using Jarque-Berra test techniques. Recapitulation of test results for
normality using the Jarque-Berra test can be seen in the table below. The results of these tests indicate that the variables were normally distributed. This is indicated by the Jarque-Berra probability values> 0.05 or 5% and JB> 2
Table 2 Normality Test
Var
Dep Var Ind
Indonesia
JB Prob Conclusion
Return EPS, DER, ROA, ROE
0,319488 0,852362 Normal
Distribution
Multicollinearity
In this study, the data used to determine free from multicollinearity, performed auxiliary regression. In the table below will be presented the test results multicollinearity using correlation matrices.
Table 3 Multicollinearity Test
Variable
Indonesia
RETURN DER ROE ROA EPS
RETURN 1.0000 0.0564 -0.1056 0.0134 -0.0112
DER 0.0564 1.0000 -0.0488 -0.0437 -0.1426
ROE -0.1056 -0.0488 1.0000 0.3000 0.7268
ROA 0.0134 -0.0437 0.3000 1.0000 0.3902
EPS -0.0112 -0.1426 0.7268 0.3902 1.0000
Autocorrelation
In this study testing autocorrelation using Durbin-Watson test techniques. Winarno (2007) states that the value of d which describes the DW coefficient in the range of 0 to 4. If the value of d in the range between 1.54 and 2.46 then there is no autocorrelation. Meanwhile, if the value of d is at 0 to 1.10 can be concluded that the data contained positive autocorrelation. The table below summarizes the test results autocorrelation using Durbin-Watson test.
Tabel 4 Autocorrelation Test
Variabel
dependent
Indonesia
Var Ind D-W Kesimpulan
Return
EPS 2.545299 No Autocorrelation
DER 2.343841 No Autocorrelation
ROA 2.646548 No Autocorrelation
ROE 2.509074 No Autocorrelation
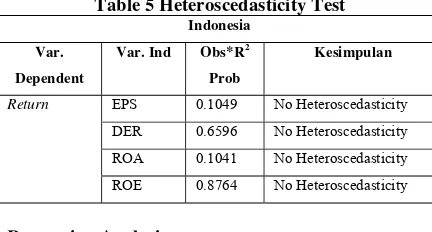
Heteroscedasticity
Heteroscedasticity occurs when a residual variance of observation to other observations indicate inequality. Regression model is a good model that does not happen heteroscedasticity. With regard to the value of Obs * R-squared using White-Heteroscedasticity test in Eviews we can determine whether there is or contains heteroskedastis. If the probability value is less than α = 5%, then we can conclude the data contained heterokedastis. The table below memamparkan value heterokedastis test results in the study period from 2006 to 2010.
STIKOM
Table 5 Heteroscedasticity Test
Indonesia
Var.
Dependent
Var. Ind Obs*R2
Prob
Kesimpulan
Return EPS 0.1049 No Heteroscedasticity
DER 0.6596 No Heteroscedasticity
ROA 0.1041 No Heteroscedasticity
ROE 0.8764 No Heteroscedasticity
Regression Analysis
The results of the regression analysis of the influence of free variable X (Financial Ratios) to Y (Stock Return) simultaneously by using the F test as follows:
Table 6 Regression Analysis
Model R Square
Adjusted R Square
Std. Error of the Estimate
1 0.152480 0.114812 640.0269
a. Predictors: (Constant), EPS, DER, ROA, ROE b. Dependent Variable: Stock Return
Based on the table above, we know that the coefficient of determination R2 of 0.152480 means that
financial ratios are represented by EPS, DER, ROA and ROE are able to contribute stock returns increase by 15%, the remaining 85% are other elements that are not addressed in this study .
Table 7 F Test Statistic
R-squared 0.152480 Mean dept var 383.4294
Adjusted R-squared
0.114812 S.D. dept var 680.2687
S.E. of regression 640.0269 Sum squared resid
36867098
F-statistic 4.048034 D-W stat 0.557860
Prob(F-statistic) 0.004595
Based on the table above the F test can be known that the value is 4.048034 Fhitung with a significance
value 0.0004 <α (0.05) so that H0 is rejected H1
accepted. That is, financial ratios represented by EPS, DER, ROA, and ROE have a significant influence on stock returns automotive companies listed on the Stock Exchange the period 2006 to 2010. This confirms receiving financial ratios influence and significant contribution to the improvement simultaneously stock return.
The results of the regression analysis of the influence of the independent variable X (Financial Ratios) to Y (Stock Return) partially by using T test as follows:
Tabel 8 T Test Statistic
Model Unstandardized Coefficients T Sig.
B Std. Error
(Constant) 286.3681 77.84799 3.678555 0.0004
EPS -0.138088 0.045424 -3.039995 0.0031
DER 16.67492 7.569465 2.202919 0.0302
ROA 0.495627 0.044816 11.05913 0.0000
ROE 1754.081 3429.495 0.511469 0.6103
a. Dependent Variable: Stock Return
Based on the explanation above, the only variable that ROE has a negative impact on stock returns because tcount> α (0.05%). It can be concluded only partially ROE ratios are not against to have a significant effect on stock return.
The above model meets the following regression equation:
YReturn = 286.3681β0 - 0.138088EPS +
16.67492DER + 0.495627ROA + 1754.081 ROE
DISCUSSION
Based on the results of data processing in the period 2006 - 2010 both located in Indonesia teretori financial ratios have a significant influence either simultaneously or partially. Only the ROE ratio shows a little different, which is partially ROE no effect on the increase in stock price during the period of study from 2006 to 2010. This suggests that the nature and the market reaction of financial ratios on the return of the stock is relatively normative. As is known in the foregoing discussion that the financial ratio remains one of the benchmarks for the stock assessment is fundamentally a micro though the contribution is only 15%.
Partially or simultaneously, almost all of the variables in this study showed a positive relationship. This can be known from the value of Prob of 0.004 or <α of 5%, the t-test statistics.
Companies data return in both countries showed almost the same thing. It can be seen from the highest return for the company in Thailand GYT (Good Year Thailand). Meanwhile, Good Year Indonesia ranks second after Astra International. It seemed to confirm that this company (Good Year Thailand) has the consistency of performance in both countries. The company was ranked in the Top 5 ranking return or rate of return on investment. The mean value in the two countries shows a fairly different. Where the average return on the State of Thailand reached 0.051689 while in Indonesia the average return 0.013061. Differences Thailand 25% greater when compared to the State of Indonesia showing the investment climate and a better rate of return in the country.
Hypothesis Test Results
Based on variable data processing research using panel data regression showed that financial ratios simultaneous influence on stock returns automotive companies in the period 2006 to 2010. It is shown from the value and the significance level α Fhitung <5%. It
means that the influence of the micro financial ratios remain strong.
However, the contribution is only 15% indicated that a fundamental aspect of macro influence still dominates the volatility of stock returns. Ristanti (2011) revealed that the macroeconomic variables simultaneously influence on stock prices and stock index 9 sectoral indices in the period from 2002 to
STIKOM
2009, 2002 to 2006 and from 2007 to 2009. The financial performance of the company based on the empirical and basic assumptions will directly influence the returns or stock returns.
This study is also in line with Astuti (2008) where ROA, ROE and DER significant effect on stock returns. While it does not affect the systematic risk of stock returns.
Trisnaeni (2007) which examines the impact of the financial performance of the stock return of manufacturing companies, in which the research suggests that the EPS, PER, DER, ROI, and ROE no effect on stock returns simultaneously. PER is only partially dominant influence stock returns. Triayuningsih (2003) that examined the effect of Performance Analysis Corporate Finance and Macroeconomic Factors Return Against Industrial Manufacturing Companies on the JSE period from 1999 to 2001 gave expression matching that only EPS ratio that delivers the most powerful influence on stock returns. Meanwhile, of all the ratios (EPS, PBV, DER and total assets) as well as inflation, interest rates and exchange rates, and inflation DER only variable that did not significantly influence stock returns.
Direction of the relationship of each variable in the study period 2006 - 2010 on auto stocks Indonesia shows that financial performance is represented by financial ratios provide a positive influence on stock returns. Except for the variable EPS (Earning Per Share), in the period 2006 -2010 study negative influence on stock returns.
A negative direction means any increase in the value of the three ratio (EPS) will lower stock returns. Conversely, when a decline in the value of EPS, there will be an increase in stock return anyway. The explanation is any increase in the value of EPS which shows the amount of net income, so the stock return decreases. Conduct market will react negatively to the increased value of EPS, because it can be assumed that the company was too wasted their money to be distributed to investors. Another assumption is valid, the market behavior rather profit is retained to develop the company to even greater. Behavior of investors in Indonesia over the long-term direction to get greater profits. Even the value of the DER as the ratio of corporate debt to be addressed positively by the market (investors). The assumption is that any increase in the value of the company's debt is considered as a capital development company. Juuga company could be considered to have a high level of credibility with a high debt ratio.
As in the previous paragraph that the DER in the study period 2006 - 2010 in Indonesia a positive impact on stock return means that any increase in the value of DER will provide appreciation in stock returns. This would suggest that the market reacts positively to companies that have a large debt ratio. Investors in Indonesia is quite radical in addressing the debt ratio in which the amount of the debt can be assumed as a capital turning the wheel company to generate higher profits. Investors Indonesia can also be interpreted as an
investor on the kind of risk-takers who take the slightest chance to expect a high return rate.
Profitability ratios to measure the ability of the capital invested or commonly known as ROA (Return on Assets) have a positive influence on stock returns. In other words, each of the increased value of ROA will increase the value of the stock return. Market players are still acting normative in which companies can benefit on capital invested positively addressed.
Meanwhile, the ratio of ROE (Return on Equity) showed different influences. Value ROE in Indonesia despite a positive effect on stock returns, but based on statistical analysis t test showed a significance level of 0.0613> α of 5%. This means that although any increase in ROE will increase stock returns, but the effect is not real. It may be noted that the behavior of investors in Indonesia have not looked at the value of the company to each company's ability to generate earnings (profitability), the efficiency of the company in managing the asset (asset management), and the amount of debt used in the conduct of business (financial leverage).
Conduct market still has a short-term investment trends resulting micro fundamentals, is not so much affect the stock price volatility. The share price is still more influenced by macro fundamental aspects. Akseptori (2011) revealed that the interest rate, exchange rate, index of prices or the need for often known as inflation gives a large role in the fluctuations or volatility in stock prices. it reaffirms that the macro aspects of stock valuation is still a very important aspect in addition to the micro itself. Financial performance is important to note as consideration in investing, but that lebibh to note again is a macro-economic fundamentals.
CONCLUSION
Financial ratios are still regarded as one of the fundamental stock valuation micro though the contribution is very small. Each of the increase in these values will direaksi positively by the market thus making the stock returns have a tendency to move directly proportional. But the trend was slightly above does not apply where the ROE variable regression analysis results indicate that the ROE has not been able to contribute either simultaneously or partially. This is in line with what had been studied by Munte (2009) Simultaneously where there is significant influence between financial ratios and stock returns. But only partially affect ROE to stock return. ROE in Indonesia are still not able to provide a strong influence on stock returns increase. but instead DER addressed positively by investors. A positive attitude shows Indonesia investment behavior radically. The increase in corporate debt is considered as a potential capital development to increase profits. The value of DER also kept investors in Indonesia became paranoid of the risks of default.
STIKOM
REFERENCES
Almilia, L. S., & Kristijadi, E. (2003). Analisis Rasio Keuangan Untuk Memprediksi Kondisi Financial Distress Perusahaan Manufaktur yang Terdaftar di Bursa Efek Jakarta. Jurnal
Akuntansi dan Auditing Indonesia (JAAI) , 7 (2), 1-27.
Alwathainani, Abdulaziz M. (2009). Consistency Of Firms’ Past Financial Performance Measures And Future Returns. The British Accounting Review. 41, 84-196
Anogara, P. (2006). Pengantar Pasar Modal. Jakarta: Rineka Cipta.
Ardiani, A. (2007). Analisis Pengaruh Kinerja Keuangan Terhadap Perubahan Harga Saham Pada Perusahaan Perbankan di Bursa Efek Jakarta (BEJ). Semarang: FE-UNS. Fakhruddin, M., Hendy, & Darmadji. (2001). Pasar
Modal di Indonesia : Pendekatan Tanya Jawab. Jakarta: Salemba Empat.
Harahap, S. S. (2002). Analisa Kritis Atas Laporan Keuangan. Jakarta: Grafindo Persada. IAI. (2002). SAK : Standar Akuntansi Keuangan.
Jakarta: Salemba Empat
Jane A. OU and Penman, Stephen H. (1989).
Accounting Measurement, Price-Earning Ratio, and The Information Content of Security Prices. Journal of Accounting Research, 27, 1-35. Jogiyanto, & Hartono. (2000). Teori Portfolio dan
Analisis Investasi . Yogyakarta: BPFE-UGM. Munte, M. H. (2009). Pengaruh Faktor Fundamental
Terhadap Return Saham Pada Perusahaan Manufaktur yang Terdapat di bursa Efek Indonesia. Medan: USU.
Mustofa, H. (2003). Metode Penelitian. Bandung: FISIP-Unpar.
Nainggolan, P. (2004). Cara Mudah Memahami Akuntasi. Jakarta: PPM.
Raharjo, S. (2005). Analisa Pengaruh Kinerja Keuangan Terhadap Return Saham Pada Perusahaan LQ-45 di Bursa Efek Jakarta. Yogyakarta: Fakultas Ekonomi Universitas Islam Yogyakarta.
Rusdin. (2006). Pasar Modal. Bandung: Alfabeta. Sarjono, Haryadi. (2010). Analisis Rasio Keuangan
Sebagai Alat Prediksi Kemungkinan Kebangkrutan Dengan Model Diskriminan Altman Pada Sepuluh Perusahaan Property Di Bursa Efek Jakarta. Jakarta: UBM.
Sekaran, U. (2003). Research Method For Business: A Skill Building Approach. New York : John Willey & Sons.
Sumantoro. (1990). Pengantar Tentang Pasar Modal di Indonesia. Jakarta: Ghalia.
Sumarti. (2007). Analisis Kinerja Keuangan Pada Bank Syariah Mandiri Jakarta. Surakarta: FE-Unmuh Surakarta.
Tandelilin, E. (2010). Portfolio dan Investasi : Teori dan Aplikasi. Yogyakarta: Kanisius.
Trisnaeni, D. K. (2007). Pengaruh Kinerja Keuangan Terhadap Return Saham Perusahaan
Manufaktur yang Terdaftar di BEJ. Yogyakarta: FE-UII.
Uni, A. P. (2006). Pengaruh Kinerja Keuangan Perusahaan dengan Alat Ukur Return On Asset (ROA) dan Return on Equity (ROE) Terhadap Return Saham Perusahaan Manufaktur di Bursa Efek Jakarta. Semarang: FIS-UNS.
Wibowo, M. T. (2005). Dampak Pengumuman Bond Rating Terhadap Return Saham Pada Perusahaan yang Terdaftar di Bursa Efek Jakarta Tahun 2001 - 2005. Yogyakarta: FE-UGM.