The Relationship between English Education Department Students’ Procrastination and Their Achievement at Universitas Muhammadiyah
Yogyakarta
A Skripsi
Submitted to the Faculty of Language Education In a Partial Fulfillment of the Requirements
For the degree Sarjana Pendidikan
Hafidz Wahyu Nur Cholis 20120540110
English Education Department Faculty of Language Education Universitas Muhammadiyah Yogyakarta
Chapter One Introduction
This chapter provides introduction of this research. It serves background of this research, identification of the problem, and limitation of the problem. In addition, this chapter also presents formulation of the problems, objectives of the research, and significance of the research. Last but not least, this chapter offers outline of the research.
Research Background
At least once in life, people postpone some, or even most of tasks. The tasks are compulsory to be done in a certain timeframe. Some people just dallied with laziness and some others ended it as their way of life (Steel, 2007). Research found that 80 to 95% of college students confessed that they were occupied by
procrastination (Knaus, 1973; Thakkar, 2009). This phenomenon becomes extreme prevalence, since not only students who engaged in procrastination but adult also might be involved in procrastination. It was reflected in some researches that 15 to 20% of adults suffered from chronic procrastination (Harriott & Ferrari, 1996; Thakkar, 2009). Hence, the idea of procrastination is thought-provoking to be discovered by the researcher in the current site since the community that is observed is adults and college students.
Hedroid, Greek poet, marked procrastination as something that always sticks on ruin. Hamlet, the famous poet from Italy, often delayed action for most of his self-title play and ever started with his soliloquy that “to be or not to be, that is the question”. Moreover, the famous artist from Italia, Leonardo da Vinci grieved over his life that many of his drawing could not be finished. Indeed, after the Industrial Revolution, the perception of procrastination became as an evil phenomenon that made the tight schedule in order to decrease delayed industrial production, (Ferrari, Johnson, & McCown, 1995; Thakkar, 2009). Thus, procrastination becomes perpetual phenomenon in every epoch and even becomes worse time by time than before.
The awareness of the researcher towards procrastination epidemic triggers him to explore more about it especially in his surroundings. It is started from the researcher himself that he sometimes procrastinates some of tasks. Although the task could be done, the researcher is not really sure with the quality. In addition, based on the researcher’s observation, numerous students in English Education Department at Universitas Muhammadiyah Yogyakarta (EED UMY) are found to be a
procrastinator. Some of those students got the low score for the assignment that they postpone it. This might be related to the prior research that procrastination might impact to students’ achievement such as obtaining low score in examination, or even
facing failure in examination which result in depression and anxiety. The further impact the students face is losing their motivation and learning and finally they stop their study (Hussain & Sultan, 2010). Thus, raising the issue of students’
Education Department students at Universitas Muhammadiyah Yogyakarta can be procrastinators.
Problem Identification
The researcher exposed some problems related with either procrastination or students’ achievement. Based on depth informal interview with some colleagues, the
researcher found that many students put off the duty until close to the deadline. In the daily lives, they are always late to the place they supposed to be punctual like train station. Moreover, there are students who often pay the rent house payment out of the deadline. Those are because they delay the obligation they have which is supposed to be accomplished on time. This kind of procrastination is included in general
procrastination.
There are particular students who delay the task from the lecturer when they feel unsure to be able to accomplish it. The reason is because of the quantity of the task and/or the difficulty of the task. In addition, some students postpone reading assignment and read it the night before class, or even couple minutes before class. Another reason is that students are lack of motivation to finish the assignment on time. This type of procrastination is commonly known as academic procrastination. In students’ academic life, both general and academic procrastination may affect their
academic performance including learning achievement. This issue needs detail study. Problem Limitation
only focuses on students’ procrastination that takes place at EED UMY in relations to their achievement. The researcher also tries to find out whether or not procrastination intertwines to students’ academic performance.
Research Questions
Based on the theoretical background and issues above, the researcher formulates three research questions below:
1. What is English Education Department Universitas Muhammadiyah Yogyakarta students’ procrastination like?
2. What is English Education Department Universitas Muhammadiyah Yogyakarta students’ achievement like?
3. What is the correlation between English Education Department Universitas Muhammadiyah Yogyakarta students’ procrastination and their achievement
like?
Research Objectives
The aims of this study are in line with the research question formulated by the researcher above:
1. To investigate EED UMY students’ procrastination. 2. To find out EED UMY students’ achievement.
Research Significance
For teachers and lecturers. The result that is attained from this research helps teacher and lecturer to be aware that procrastination is danger. Teacher and lecturer also can help their students to encounter this problem and encourage them to finish their task on time.
For students. The outcome of this research makes the students aware about the hazard of procrastination and then whittles away their bad habit that is putting off their work. In addition, they are more motivated in their study after knowing the bad effect of procrastination and good impact of avoiding procrastination than before knowing it.
For the next researchers. This research enriches the next researchers’ knowledge in order to develop another case or phenomenon related with
procrastination and students’ achievement. It also gives them insight regarding to the recent situation that is happened around them.
Research Outline
This research comprises five chapters and the first chapter presents the introduction. It consists of background, formulation of the problem, and limitation of the problem. Then, it serves research question and purpose of the study as well as significance of study.
is described along with level of Cumulated Grade Point Average (CGPA). Review of related study and conceptual framework which includes hypothesis are following.
The third chapter portrays research methodology. It defines type of the research design and population and sample. Data collection method and data analysis are explicated afterwards.
Chapter Two Literature Review
This chapter provides experts’ opinions that support the research. The relevant
ideas from experts are elaborated into two parts, procrastination and students’
achievement. The first part consists of elaboration on the definition of procrastination,
causes of procrastination, effects of procrastination, and types of procrastination.
Meanwhile, the second part comprises of amplification on the definition of students’
achievement and level of students’ achievement.
Procrastination
Definition of procrastination. Many researchers attempted to define what procrastination is. These attempts produce various different types of definition. The
difference might be caused by the root and origin the researchers used as the basis to
define the procrastination. Neville (2007) stated that the word of procrastination
derived from its origins in Latin: pro- (forward) and crastinus (of tomorrow). It
means that procrastination is putting something forward tomorrow. Besides,
according to Klingsieck (2013) and Rozental and Carlbring (2014), the definition of
procrastination is willingly delaying a planned task which is intended to be done
without concerning bad consequences coming from that delay. In addition,
Klingsieck (2013) and Rozental and Carlbring (2014) stated that the definition may
be differentiated into three different manners, distress, postponement, and
irrationality. Distress refers to the procrastination in the form of delay that is in
conjunction with subjective discomfort (Solomon & Rothblum, 1984; Rozental &
postpone to start or to complete an intended course of action (Beswick & Mann,
1994; Rozental & Carlbring, 2014). Irrationality represents a kind of procrastination
to delay activities irrationally as behavior of the doers (Sabini & Silver, 1982;
Rozental & Carlbring, 2014).
From various definitions of procrastination, some experts asserted that theirs
is the most proper definition. Eerde (2003) and Thakkar (2009) claimed that the best
definition for procrastination is the postponing of a duty that was initially planned in
spite of expecting to be poorer for the delay. Collaterally, according to Steel (2007),
Rozental and Carlbring (2014), and Steel (2010), procrastination is “to voluntarily
delay an intended course of action despite expecting to be worse off for the delay.” In
line with Oxford Advanced Learner’s Dictionary (2005), procrastinate is “to delay
doing something that you should do, usually because you do not want to do it”. In
education field, academic procrastination term refers to the delay in academic
activities intentionally, incidentally, and/or habitually but has significant effect
toward students’ learning and achievement (Hussain & Sultan, 2010).
To sum up, procrastination is the tendency to delay and postpone task or duty.
Commonly, people do procrastination on tasks impulsively, intentionally, and
voluntarily. Moreover, people who procrastinate do not consider the bad impact from
the action.
Types of procrastination. Procrastination is divided into types. The variance of procrastination types existed because the experts see it based on many different
perspectives like character and trait. Babadogan (2010) pointed out that there are two
mostly based on putting off in decision-making and daily life routine and the second
is conditional procrastination which is included also academic procrastination. In line
with that, Solomon and Rothblum (1984), Milgram, Mey-Tal, and Levinson (1998),
Lay (1988), Ferrari and Dovidio (2000), Ferrari (1991), and Babadogan, (2010)
distinguished procrastination as life routine procrastination, compulsive
procrastination, decisional procrastination, and academic procrastination. Life routine
procrastination manifests as difficulty in arranging daily routine tasks and in getting
these done in time. Then, compulsive procrastination emerges as a deferring both the
tasks to be accomplished and likewise the decision to be occupied. Subsequently,
decisional procrastination arises as “procrastination in decision-making in case of
conflict situations and various options.” Last but not least, academic procrastination
is addressed as like leaving academic tasks until last minute such as preparation for
examinations and doing assignment.
Instantly, those categories are generalized into two extractors which are based
on reason and area that people procrastinate. The types of procrastination may be
different and it depends on the characteristic which is used as a separator. Moreover,
the experts provided two different groupings of procrastination types. They are two
types and four types and those categorizations are based on the reason and the area
that people procrastinate.
However, the researcher tends to choose the first type of procrastination which
divides procrastination into two: personal trait and conditional. The reason is because
Babadogan provided two different discrimination of procrastination; they are two
procrastination and academic procrastination are included in conditional
procrastination, meanwhile decisional procrastination and life routine procrastination
are part of personal traits. Thus, the researcher prefers to two types of procrastination.
Causes of procrastination. There are many factors that cause procrastination. Thakkar (2009) analyzed that there are two main reasons of procrastination especially
in America. They are modern technology and procrastination’s evolution to become
postmodern values. However, the other experts discovered various reasons that cause
people to procrastinate as elaborated in the following paragraph.
Firstly, technology becomes one of the causes of procrastination. Along with
the development of technology, people are fascinated with the features offered by
technology especially gadget. For example, a smart phone contains many social
media like Facebook, Twitter, Path, Instagram, WhatsApp, and Blackberry
Messenger. People are happier keeping in touch with their affiliations and relations
through virtual world than direct interaction. They are distracted by checking e-mail,
texting with friends instantly, browsing the news, listening to music, streaming videos
on YouTube, and playing games. Those all can unnecessarily postpone the work at
hand. Unintentionally, people become stupid just because giving priority to their
virtual world rather than their reality world where they live. This disorder makes
exaggerated quote, “We live in the era of smart phones and stupid people”. Sadly, a
smart phone is not the only distraction, but computer, television, video games, and a
whole host of progressively sophisticated modern invention might also cause acute
Secondly, procrastination that has already improved as postmodern values has
permeated most of Western society in the last thirty years. According to Dr. Ronald
Ingleheart (as cited in Thakkar, 2009), a protuberant political science at the
University of Michigan and director of the World Values Survey, Western societies
are underway to cultivate postmodern values such as tolerance, gratitude of social
contacts, and self-actualization. These values coexist with modern values such as hard
work, security, and wealth. When used to academic, modern values point to a
preference for school, future aims, and hard work whereas postmodern values refer to
a preference for social deeds and pleasure at the moment. In many occasions, there is
restricted time to pursue distinct academic and leisure activities, resulting in
motivational conflict between the two events. Determining by their value
construction, daily activities that students have will be different coherently (Dietz,
Hofer, & Fries, 2007; Thakkar, 2009). Students with modern values need to plan for
their future and will organize their daily routines to meet their objectives. Meanwhile,
students with postmodern values prefer to choose spontaneously the activities during
the day they want to engage, resulting in the greater chance of putting of academic
tasks with slight instant pleasure. Those three persons are all professors of
Psychology at the University of Manheim in Germany and conducted an empirical
study on 700 German students that verified Inglehart’s theory by revealing,
“Postmodern value orientation was positively linked to academic procrastination”.
Interestingly, when the students are failed in academic, it may raise the
possibility of having academic procrastination. Kandemir (2014) found that academic
which attracts students from their study and distracts their focus. While internet is
part of technology, it means that Kandemir’s research is coherent with Thakkar’s
research before which proposes the idea of excessiveness usage of modern
technology.
On the other hand, some experts stated that internal factor has significant
correlation with procrastination. Yazici and Bulut (2015) explained that perfectionist
personality traits have significant relationship with academic procrastination of the
prospective teacher. It is supported by Kagan, Çakir, Ilhan, and Kandemir (2010) who
discovered that perfectionism, obsessive-compulsive, and personality traits are the
variables that elucidate academic procrastination. Steel (2007) and Steel (2010) tried
to generalize that the strongest factor is impulsive. When people have intended to
finish their task but put it off even the moment comes, it seems that their preferences
impulsively change to take pleasure in more readily temptation. This may support the
premise about impulsive as the core reason in procrastination.
Generally, there are two big factors that make people postpone their duty.
They are internal factors which are like impulsive, modern, and postmodern values,
and external factors which include internet and modern technology. As a result, it can
be concluded that internet – supported technology and impulsive are the strongest
factor which drives people to procrastinate.
Effects of procrastination. Since procrastination is obscured dangerous epidemic, the effects that are caused by procrastination are so many. Many people get
the troubles because of procrastination. Critchfield and Kollins (2001), Ainslie
numerous public problematic. In line with it, Schouwenburg, Lay, Pychyl, and Ferrari
(2004) and Ozer and Sackes (2011) highlighted that, predominantly, students of university regularly search for help from guidance counselor to complain about procrastination that makes them feel so hard and might bring their life satisfactory to the lowest level. Appositely, Clayton (2000), Tice and Baumeister (1997), and Ozer and Sackes (2011) discovered that procrastination seems to reduce the stress by giving pleasure in the beginning, but the pleasure will be paid with long term stress, disorganization, and even failure. In addition, procrastination in academic setting often brings many negative outcomes (Semb, Glick, & Spencer, 1979; Ozer & Sackes, 2011). This might be relevant with what Sirois (2007), Stead, Shanahan, and Neufeld (2010), Muraven, Tice and Baumeister (1997), O’Donoghue and Rabin
(1999), and Rozental and Carlbring (2014) discovered that procrastination might
affect to decrease well-being, unhealthy mentally, a reduced amount of performance,
and economic difficulties.
In summary, procrastination effects are always bad. The effects could be in
psychological forms such as demotivation, stress, and mental disorder. Besides, they
might also be in material types like financial loss and failure. Nothing is good at all.
Student’s Achievement
Definition of student’s achievement. Based on literal meaning, students’ achievement is what students achieve during certain period. Arikunto (2010) and
Awaliyah (2015) stated that academic achievement is a result of learning during
learning processes. Correspondingly, regarding to Syah (2008) and Awaliyah (2015),
by scores. Regardless its poorness, Grade Point Average (GPA) is a measure of
academic integration (Tinto, 1975; Pietras, 2010) that can be assumed GPA is student
achievement itself. Similarly, despite the flaw in measuring student achievement
(Milton, 1988; Elliott & Strenta 1988; Chance 1988; Ramist, Lewis, & McCamley,
1990; Young 1990; Larkey & Caulkins, 1992; Caulkins, Larkey, & Wei, 1996), GPA
is still the foremost measure of student quality in educational system (Caulkin et al.
1996). At the end, student’s achievement can be described as GPA because it is still
the primary measurement in educational field regardless its imperfection.
Factors affecting academic achievement. Two big parts of factors that affect academic achievement are internal factors and external factors. Internal factors come
from inside of every person including psychological, emotional, and motivation
whilst external factors derive from outside of the person like environment, family,
and society (Hakim, 2005). It needs integration among environment, family, and
society. Here, the role of parents, brothers, sisters, teachers, friends and even
neighbors is important in determining students’ academic achievement. Then, the rest
depends on students’ mood and emotional like motivation, anger, sadness, hatred, etc.
In addition, emotional variable factor has a strong influence toward students’
achievement and can predict academic success (Heyningen, 1997 as cited in Pritchard
& Wilson, 2003). Moreover, Hasheminasab, Zarandi, Azizi, and Zadeh (2014) stated
that there are some important factors that affect student’s achievement such as
gender, self-efficacy, achievement motivation, and academic procrastination. In this
respect, procrastination is highlighted in this research as a basis that affects students’
Level of GPA. As the media to measure GPA, it needs level to distinguish and separate the classifications. Every level of classification describes different
description. Various classifications exist because every institution can have its own
arrangement. Academic Guideline Book of Universitas Muhammadiyah Yogyakarta
determines the level of Cumulative GPA (CGPA) with its character. The arrangement
is based on “Keputusan Mendiknas Nomor 232/U/2000. The order is as seen below:
1. 2.00 – 2.75 : Satisfactory
2. 2.76 – 3.50 : Good
3. 3.51 – 4.00 : Very Good/ Cumlaude.
Related Study Review
The correlation between procrastination and students’ achievement. Several experts had done the researches about correlation between procrastination
and students’ achievement. The study of relationship between procrastination and
academic performance among a group of undergraduate dental students in India was
conducted (Nagesh Lakshminarayan, Shrudha Potdar, & Siddana Goud Reddy,
2013). In addition, correlations of academic procrastination and mathematics
achievement of university undergraduate students were investigated in Nigeria
(Akinsola, Tella, & Tella, 2007). Those researches founded significant correlation
between procrastination and students’ achievement. Additionally, students with low
level of procrastination are good in their academic achievement as well as students
with high level of procrastination are bad in academic performance.
The relationships among procrastination, flow, and academic achievement
GPA
the result of this study indicated that there was no relationship between
procrastination and students’ achievement (Eun, 2011). This proved that the
likelihood of the same result of the similar researches does not necessarily occur.
Thus, the difference of result depends on the site where the research is conducted and
becomes the motive of the researcher to conduct this research at EED UMY.
Conceptual Framework
Based on the literatures above, the researcher conceptualizes the theory in
order to support this research. According to Arikunto (2010), learning outcome is
student achievement. Meanwhile, Caulkin et al. (1996) claimed that GPA is still the
primary technique to measure students’ achievement. Moreover, there are two big
parts of factors that affect academic achievement; they are internal factors like
psychological and external factors like environment (Hakim, 2005). While
Babadogan (2010) stated that procrastination is a kind of behavior and psychological,
Heyningen argued that students’ achievement can be predicted from emotional
factors because they relate strongly one to another (as cited in Pritchard & Wilson,
2003). Thus, the theories above lead to the idea of the connection between
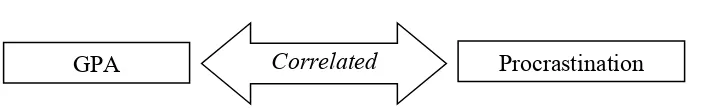
procrastination and students’ achievement which is depicted as below:
Table 1. The Research Correlational Table
Research hypothesis. Grounded by the prior research, the researcher made two hypotheses. The first is the alternative hypothesis (Ha) which there is correlation
between procrastination and students’ achievement. The second is the null hypothesis
Chapter Three Methodology
This section conveys the methodology of research that is employed by the
researcher. It consists of four parts: research design, population and sample, data
collection method, and the data analysis method. In the research design, the
researcher explains the design and the reason of deciding the design. Next, in the
population and sample, the researcher elaborates the populations and the number of
the sample and the sampling techniques utilized in this study. In the data collection
method, the researcher explores the way the data is collected. In the end, in the data
analysis, the researcher amplifies the procedures in investigating the data.
Research Design
The nature of this research is quantitative approach. The quantitative approach
for a research is commonly depicted by the foremost uses of numerical data than
words or pictures data instead (Creswell, 2003, p. 19) which mandated the researcher
to “identify a research problem based on trends in the field or on the need to explain
why something occurs” (Creswell, 2012, p. 13). Furthermore, this research took
correlational design. It demanded the researcher to “measure the degree of association
(or relation) between two or more variables using the statistical procedure of
correlational analysis” (Creswell, 2012, p. 21). Explicitly, referring to Creswell
(2012), this research applied a prediction research design which it is “to identify
variables that will predict an outcome or criterion.” The researcher identified one or
more predictor (or outcome forecast) variable and a criterion (or outcome) variable.
procrastination and their achievement in which one variable can correlate to another
variable. In spite of the existing similar researches that had been conducted before,
this research was distinct since such a study had never been administered in the
period and site where this study took place.
Research Population and Sampling
In order to collect the data, the researcher needed to decide the population that
is being observed and the sampling technique that is used to select the respondent.
Referring to Creswell (2012), “population is group of individuals who have the same
characteristic” (p. 142). The population in this research was students of English
Education Department Universitas Muhammadiyah Yogyakarta at year 2015/2016
with the total number 531 students (batch 2015 is excluded). The researcher tended to
use convenience sampling. It is when the researcher chooses participants because
they are ready and accessible to be studied (Creswell, 2012). Convenience sampling
is included in non-probability sampling which the participants are selected because
they are available, convenient, and represent some characteristic that the researcher
wants to study (Creswell, 2012). For that reason, the researcher opted to only batch
2012, 2013, and 2014 because they fulfilled all the characteristics that were needed
by the researcher. Those characteristics were having Cumulated Grade Point Average
(CGPA), engaged in university environment more than one year, and accessible to
gain the data. Batch 2015 was not suitable because the students had no CGPA which
its role was important here as the dependent variable. Also, they were lack of
that the researcher looked for, that was university students. In addition, students of
2011 and 2010 were hard to access because most of them had graduated.
Data Collection Method
The data collection methods in this research used questionnaire and
Cumulated Grade Point Average (CGPA) as the instrument. The questionnaire was
employed to gather the data of procrastination whereas CGPA was utilized to obtain
the data of students’ achievement. The researcher distributed the questionnaire to
EED UMY students batch 2012, 2013, and 2014 who were available, accessible and
willing to be taken their data. The questionnaire distribution was held at the
classroom after permission from the lecturer who taught was given. Before the
respondents started to answer the questionnaire, the researcher asked permission from
them by giving inform consent that they had to put their sign on it. The inform
consent consisted student’s approval for giving their data including their CGPA to be
submitted and then analyzed by the researcher for research purpose. In addition, the
researcher also asked permission from Dean of Language Education Faculty and
Head of English Education Department regarding to obtain institution’s archive that
is students’ CGPA.
Research Setting. The place where this research was conducted was in English Education Department at Universitas Muhammadiyah Yogyakarta. The first
reason why the researcher opted to that place is because the students who studied
there were prospective teachers and lecturers who should, later, concern about their
procrastinators. The second reason is because the researcher studied there too. It
made the researcher feasible to conduct research there because the researcher knew
the condition of the site where the research would be conducted.
Besides, the data collection was conducted between March – April 2016. It
took around 6 weeks for the researcher to attain the data entirely. The researcher
distributed questionnaire to the 336 students of EED batch 2012, 2013, and 2014. The
distribution of questionnaire was 82 for batch 2012, 122 for batch 2013, and 131 for
batch 2014. That was based on the students who were available, willing, and
accessible. The researcher claimed that the proportion for each batch was exact and
feasible to be collected and might represent the total population.
Research Instrument. The questionnaire as the instrument of this research was adopted from Tuckman Procrastination Scale (TPS) (Tuckman, 1990) and
Procrastination Assessment Scale for Students (PASS) (Solomon & Rothblum, 1994).
TPS was used for measuring daily life routine procrastination and PASS was used to
measure academic procrastination. In order to make the questionnaire more
contextualized within the current research site and condition, the researcher adjusted
some items. The adjustments were only on the terms like “meeting with professor”
became “meeting with lecturer” and “registering classes” became “key – in.”
Consequently, the researcher chose PASS items only on the prevalence of academic
procrastination in six academic areas and did not include the reason for academic
procrastination items and the interest in changing procrastination. The questionnaire
was made in both Indonesian and English to facilitate the respondents to understand
Indonesia was the first language of the respondents. The other reason of preparing the
questionnaire in Indonesian was because there were some difficult statements to
understand. That was a way to avoid misunderstood and misinterpret which led to
invalid or bias data and result. The researcher used contextual translation technique in
translating the items on the questionnaire. Afterwards, the researcher handed in the
questionnaire to two lecturers who were experts in this matter for checking the
suitability and correspondence each translated item with the original one. The
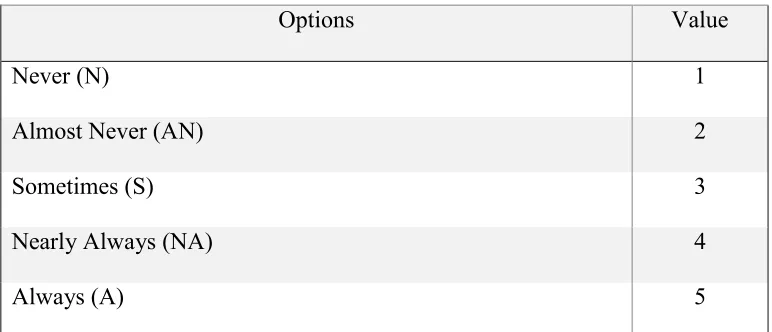
questionnaire consists of 8 items of TPS and 7 items of PASS. The researcher
decided to use 5 points of Likert scale for each item. Every item possessed some
options: N (Never), AN (Almost Never), S (Sometimes), NA (Nearly Always), A
(Always). The score criteria of questionnaire items are as follow:
Table 2. Favorable Items Scoring
Options Value
Never (N) 1
Almost Never (AN) 2
Sometimes (S) 3
Nearly Always (NA) 4
Always (A) 5
So as to obtain the students’ achievement data, the researcher used CGPA document
that was taken from academic information system in EED office with the permission
the informed consent in the questionnaire. For the need of data analysis, the
researcher categorizes the students’ CGPA into three levels to distinguish the
category of achievement. Then, both questionnaire and CGPA were being analyzed.
Instrument Validity. In order to avoid bias and/or wrong data, the instrument that was used to measure should be valid. Creswell defined that, “validity is the
degree to which all of the evidence points to the intended interpretation of test scores
for the proposed purpose” (p. 159). Therefore, the instrument should be able to
measure what the researcher intended to measure in order to meet the validity. In this
research, the instrument was demanded to be able to measure procrastination. The
validity of the item was good concurrent validity, because it had already been used by
Tuckman, Solomon and Rothblum which was definitely checked by them using
several tests. Tuckman (1990) explained that TPS passed two times of test. The first
test from 72 items yielded two factors from 35 items. Then, a subsequent test resulted
to only a single-factor structure and a condensed scale of 16 items. Meanwhile,
Solomon and Rothblum (1994) claimed that PASS had very good concurrent validity.
It was proven by significant correlation with the Beck Depression Inventory, Ellis
Scale of Irrational Cognitions, Rosenberg Self-Esteem Scale, and the Delay
Avoidance Scale. Moreover, the construct validity of the questionnaire was checked
by expert judgment from two lecturers who mastered this substance. The items,
which were taken from both TPS and PASS, were modified in order to make it
applicable in the current site.
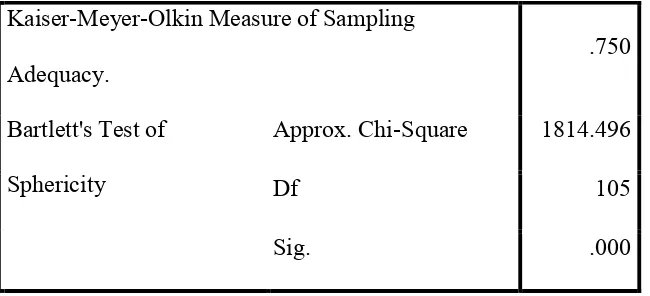
However, after being tested in the current site, it showed that KMO score was
whether the items measured the factors that were supposed to be measured. Table 3
depicts the results of the analyses.
Table 3. The Validity of The Questionnaire Using KMO and Bartlett's Testa
Kaiser-Meyer-Olkin Measure of Sampling
Adequacy.
.750
Bartlett's Test of
Sphericity
Approx. Chi-Square 1814.496
Df 105
Sig. .000
a. Based on correlations
After having factor analysis, the researcher eliminated the invalid items. It turned out
that from 28 items, 15 items were valid and 13 were not.
Instrument Reliability. The instrument that was used in this research should be reliable and trusted in every site and condition where the research was conducted.
Creswell (2012) stated that, “reliability means that scores from an instrument are
stable and consistent” (p. 159). Sekaran (2000) specified reliability indicator into
three levels:
1. 0.8 - 1.0 = Good
2. 0.6 - 0.799 = Moderate
3. < 0.6 = Not Good
Tuckman (2010) emphasized that the computed reliability (Cronbach’s alpha) for his
reliability was 0.74. The instrument’s reliability in this research was good and
appraised as reliable and trusted worthy instrument.
However, the modified instrument had slight different reliability value. The
researcher applied Cronbach’s alpha in SPSS to measure the reliability of the
instrument. The result confirmed that the reliability value of the instrument was 0.843
based on standardized items. It means that the instrument had good reliability to
measure. The table of Cronbach’s alpha is illustrated below.
Table 4. Reliability Statistics
Cronbach's
Alpha
Cronbach's
Alpha Based
on
Standardized
Items
N of
Items
.842 .843 15
Data Analysis Method
This research utilized descriptive statistics and inferential statistics as the
method to analyze the data. Descriptive statistics displayed the score of
procrastination and GPA whilst inferential statistics portrayed the relation between
procrastination as the independent variable and GPA as the dependent variable. The
researcher operated Statistical Package for the Social Science (SPSS) version 22 for
To measure procrastination, the researcher developed questionnaire which
was adopted from Tuckman (1990) and Solomon and Rothblum (1994). The
researcher adjusted some items in order to make it relevant with the current research
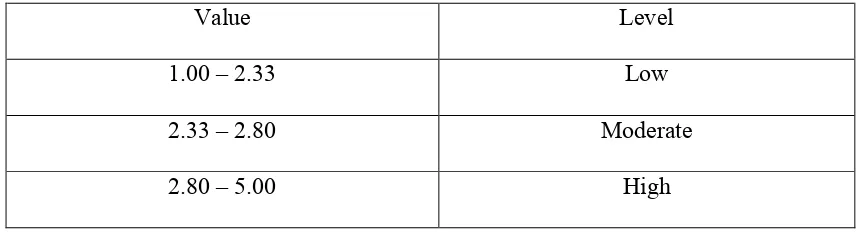
period and site. In addition, there are three level of procrastination (Akinsola, Tella,
& Tella, 2007; Lakshminarayan, Potdar, & Reddy, 2013) and the table is exposed
below:
Table 5. Procrastination Level
Value Level
1.00 – 2.33 Low
2.33 – 2.80 Moderate
2.80 – 5.00 High
The values were obtained by dividing the average score of procrastination into three.
The scores were based on 5 Likert scales that were used by the researcher. Each scale
had different score and it can be seen in Table 2.
Besides, this research activated Pearson Product Moment correlation via SPSS
version 22 to correlate between two variables which were procrastination as the
independent variable and student’s achievement as the dependent variable. This
research applied Pearson Product Moment because the data was normal based on
normality test in SPSS. There is standard guideline to measure the strength of
association between two variables as showed below (Cohen & Manion, 1994;
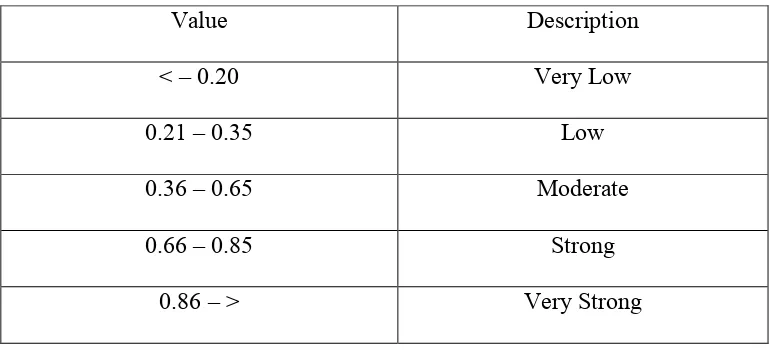
Table 6. Correlational Score Table
Value Description
< – 0.20 Very Low
0.21 – 0.35 Low
0.36 – 0.65 Moderate
0.66 – 0.85 Strong
Chapter Four
Finding and Discussion
This chapter provides findings of the data analysis and discussion about it.
The findings in this chapter are the result from the data collected by the researcher
and analyzed using SPSS. Moreover, the findings that relate to the research questions
are discussed afterwards. Thus, it reveals whether the findings correspond or not with
the hypothesis.
Finding
Entire questionnaire items descriptive statistic. After inputting the raw data
into SPSS program version 22, the data computation and analysis to discover the
descriptive statistic of the questionnaire items were done. Principally, the
questionnaire items were encoded as follows:
Item
Number Coding Statement
1 A1 I needlessly delay finishing jobs, even when they are
important (Saya menunda untuk menyelesaikan pekerjaan
meskipun itu penting).
2 A2 I postpone starting in on things I do not like to do (Saya
menunda untuk memulai suatu hal yang tidak saya sukai). 3 A3 I delay main tough decision (Saya menunda untuk
memutuskan sesuatu meskipun itu penting).
menunda untuk meningkatkan kinerja saya dalam bekerja). 6 A6 I manage to find an excuse for not doing something (Saya
berusaha mencari alasan untuk tidak melakukan sesuatu). 9 A9 I am and incurable time waster (Saya selalu
menyia-nyiakan waktu).
10 A10 I am a time waster now, but I cannot seem to do anything
about it (Saya selalu menyia-nyiakan waktu dan saya tidak
bisa mengendalikannya).
15 A15 I still get stuck in neutral, even though I know how
important it is to get started (Saya tidak segera memulai
pekerjaan meskipun pekerjaan tersebut penting).
20 B4 To what degree is procrastination on studying for exam a
problem for you? (Seberapa sering menunda belajar untuk
persiapan ujian menjadi masalah untuk anda?)
23 B7 To what degree do you procrastinate on registering for
classes? (Seberapa sering anda menunda-nunda “key-in”?) 24 B8 To what degree is procrastination on registering for classes
a problem for you? (Seberapa sering menunda “key-in” menjadi masalah untuk anda?)
25 B9 To what degree do you procrastinate on meeting with your
lecturer? (Seberapa sering anda menunda-nunda untuk
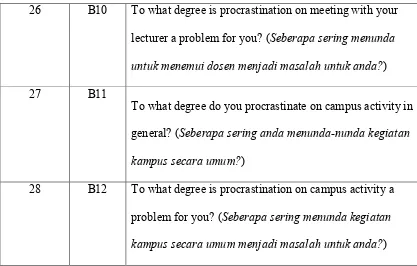
26 B10 To what degree is procrastination on meeting with your
lecturer a problem for you? (Seberapa sering menunda
untuk menemui dosen menjadi masalah untuk anda?)
27 B11
To what degree do you procrastinate on campus activity in
general? (Seberapa sering anda menunda-nunda kegiatan
kampus secara umum?)
28 B12 To what degree is procrastination on campus activity a
problem for you? (Seberapa sering menunda kegiatan
kampus secara umum menjadi masalah untuk anda?)
Here, the descriptive statistic from the data after being analyzed by the
researcher using SPSS is depicted. The table below is the result of questionnaire
items that was spread to EED UMY students. The result was gained from 336
[image:31.612.108.525.82.348.2]students from batch 2012, 2013, and 2014 on the academic year 2015/2016.
Table 7. The Descriptive Statistics of Questionnaire Items
N Sum Mean
Std.
Deviation Skewness
Statistic Statistic Statistic Statistic Statistic
Std.
Error
A1 336 899 2.68 .817 -.429 .133
A3 336 775 2.31 .856 .285 .133
A4 336 772 2.30 .901 .189 .133
A6 336 854 2.54 .893 -.252 .133
A9 336 844 2.51 .937 -.090 .133
A10 336 820 2.44 .944 .066 .133
A15 336 880 2.62 .866 -.122 .133
B4 336 944 2.81 .989 .018 .133
B7 336 717 2.13 1.129 .786 .133
B8 336 724 2.15 1.084 .607 .133
B9 336 820 2.44 .957 .109 .133
B10 336 851 2.53 1.022 .156 .133
B11 336 879 2.62 .926 -.071 .133
B12 336 866 2.58 .911 -.303 .133
Valid N
(listwise)
336
The table above indicates that all questionnaire items are valid based on the
skewness. The normality of items can be seen from the skewness value which the
range is in between – 1 and + 1. It is proven that there is no skewness value which is
less than – 1 and more than + 1.
Questionnaire items frequency analysis. The next following paragraph
explanations follow each table. Thus, 15 valid items is portrayed in tables and
[image:33.612.112.476.225.544.2]numbers.
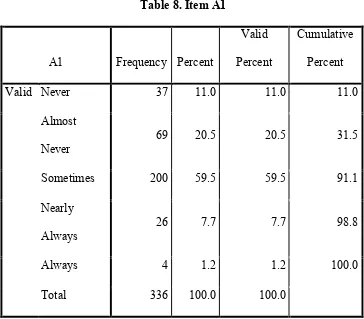
Table 8 shows the frequency of questionnaire item number 1: I needlessly
delay finishing jobs, even when they are important (Saya menunda untuk
menyelesaikan pekerjaan meskipun itu penting). Table 8. Item A1
A1 Frequency Percent
Valid
Percent
Cumulative
Percent
Valid Never 37 11.0 11.0 11.0
Almost
Never
69 20.5 20.5 31.5
Sometimes 200 59.5 59.5 91.1
Nearly
Always
26 7.7 7.7 98.8
Always 4 1.2 1.2 100.0
Total 336 100.0 100.0
The table above depicts that there are 200 respondents (59.5%) from the total 336
respondents who procrastinate important task occasionally. Besides, 69 respondents
(20.5%) are seldom to procrastinate on important task. In addition, 37 respondents
often to procrastinate on important task and 4 respondents (1.2%) always
procrastinate on important task.
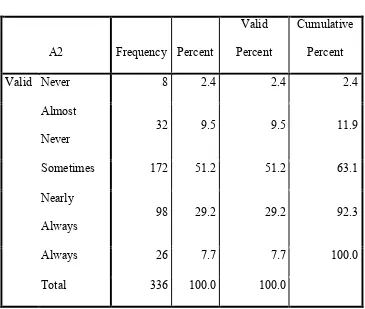
Table 9 illustrates the result of frequency of the questionnaire item number 2:
I postpone starting in on things I do not like to do (Saya menunda untuk memulai
[image:34.612.112.477.235.544.2]suatu hal yang tidak saya sukai).
Table 9. Item A2
A2 Frequency Percent
Valid
Percent
Cumulative
Percent
Valid Never 8 2.4 2.4 2.4
Almost
Never
32 9.5 9.5 11.9
Sometimes 172 51.2 51.2 63.1
Nearly
Always
98 29.2 29.2 92.3
Always 26 7.7 7.7 100.0
Total 336 100.0 100.0
The table above shows that 8 out of 336 (2.4%) respondents never postpone starting
unlovable task. Then, 9.5% of respondents are seldom to postpone starting unlovable
task. Besides, 51.2% of respondents sometimes postpone starting unlovable task.
Moreover, 29.2% and 7.7% of respondents consecutively often and always
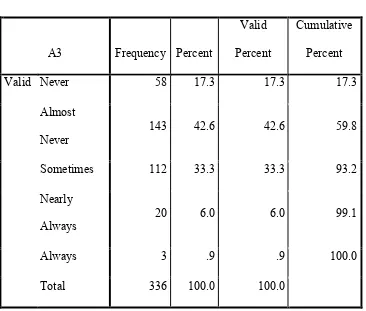
Table 10 demonstrates the result of frequency of the questionnaire item
number 3: I delay main tough decision (Saya menunda untuk memutuskan sesuatu
[image:35.612.113.479.179.490.2]meskipun itu penting).
Table 10. Item A3
A3 Frequency Percent
Valid
Percent
Cumulative
Percent
Valid Never 58 17.3 17.3 17.3
Almost
Never
143 42.6 42.6 59.8
Sometimes 112 33.3 33.3 93.2
Nearly
Always
20 6.0 6.0 99.1
Always 3 .9 .9 100.0
Total 336 100.0 100.0
The table above depicts that 17.3% of respondents never delay to decide important
thing and 42% of respondents are seldom to delay deciding important thing.
Meanwhile, 33.3% of respondents sometimes delay to decide important thing.
Moreover, 6% and 0.9% of respondents sequentially often and always delay to decide
Table 11 portrays the result of frequency of questionnaire item number 4: I
keep putting off improving my work habits (Saya terus menunda untuk meningkatkan
[image:36.612.112.477.186.491.2]kinerja saya dalam bekerja).
Table 11. Item A4
Frequency Percent
Valid
Percent
Cumulative
Percent
Valid Never 69 20.5 20.5 20.5
Almost
Never
129 38.4 38.4 58.9
Sometimes 108 32.1 32.1 91.1
Nearly
Always
29 8.6 8.6 99.7
Always 1 .3 .3 100.0
Total 336 100.0 100.0
The table above indicates that 20.5% of respondents never postpone improving work
performance. Besides, 38.4% of respondents are seldom to postpone improving work
performance. Moreover, 32.1% of respondents sometimes postpone improving work
performance. While 8.6% of respondents often postpone improving work
Table 12 depicts the result of frequency of questionnaire item number 6: I
manage to find an excuse for not doing something (Saya berusaha mencari alasan
[image:37.612.110.476.186.492.2]untuk tidak melakukan sesuatu).
Table 12. Item A6
Frequency Percent
Valid
Percent
Cumulative
Percent
Valid Never 53 15.8 15.8 15.8
Almost
Never
85 25.3 25.3 41.1
Sometimes 163 48.5 48.5 89.6
Nearly
Always
33 9.8 9.8 99.4
Always 2 .6 .6 100.0
Total 336 100.0 100.0
The table above points out that 15.8% of respondents never find an excuse to left the
task whereas 25.3% of respondents seldom find an excuse to left the task.
Furthermore, 48.5% of respondents often find an excuse to left the task. As well,
9.8% and 0.6% of respondents, in order, often and always find an excuse to left the
task.
Table 13 shows the result of frequency of questionnaire item number 9: I am
Table 13. Item A9
Frequency Percent
Valid
Percent
Cumulative
Percent
Valid Never 58 17.3 17.3 17.3
Almost
Never
92 27.4 27.4 44.6
Sometimes 145 43.2 43.2 87.8
Nearly
Always
38 11.3 11.3 99.1
Always 3 .9 .9 100.0
Total 336 100.0 100.0
The table above portrays that 17.3% of respondents never waste time. Then, 27.4% of
respondents seldom waste time. Besides, 43.2% of respondents sometimes waste
time. Meanwhile, 11.3% of respondents often waste time and 0.9% of respondents
always waste time.
Table 14 displays the result of frequency of questionnaire item number 10: I
am a time waster now, but I cannot seem to do anything about it (Saya selalu
Table 14. Item A10
Frequency Percent
Valid
Percent
Cumulative
Percent
Valid Never 63 18.8 18.8 18.8
Almost
Never
103 30.7 30.7 49.4
Sometimes 133 39.6 39.6 89.0
Nearly
Always
33 9.8 9.8 98.8
Always 4 1.2 1.2 100.0
Total 336 100.0 100.0
The table above indicates that 18.8% of respondents are never able to control time
wasting habit and 30.7% of respondents seldom are able to control time wasting
habit. Then, 39.6% of respondents sometimes are able to control time wasting habit.
As well, 9.8% of respondents are often able to control time wasting habit and 1.2% of
respondents always are able to control time wasting habit.
Table 15 shows the result of frequency of questionnaire item number 15: I
still get stuck in neutral, even though I know how important it is to get started (Saya
Table 15. Item A15
Frequency Percent Valid Percent Cumulative Percent
Valid Never 38 11.3 11.3 11.3
Almost Never 96 28.6 28.6 39.9
Sometimes 162 48.2 48.2 88.1
Nearly Always 36 10.7 10.7 98.8
Always 4 1.2 1.2 100.0
Total 336 100.0 100.0
The table above points out that 11.3% of respondents never put off to start important
task. Besides, 28.6% of respondents seldom put off to start important task.
Meanwhile, 48.2% of respondents sometimes put off to start important task. In
addition, 10.7% of respondents often put off to start important task. Then, there are
1.2% of respondents who always put off to start important task.
Table 16 portrays the result of frequency of questionnaire item number 20: To
what degree is procrastination on studying for exam a problem for you? (Seberapa
Table 16. Item B4
Frequency Percent
Valid
Percent
Cumulative
Percent
Valid Never 34 10.1 10.1 10.1
Almost
Never
86 25.6 25.6 35.7
Sometimes 140 41.7 41.7 77.4
Nearly
Always
62 18.5 18.5 95.8
Always 14 4.2 4.2 100.0
Total 336 100.0 100.0
The table above illustrates that 10.1% of respondents never have problem from
procrastination on studying for exam. Then, 25.6% of respondents seldom have
problem from procrastination on studying for exam. As well, 41.7% of respondents
sometimes have problem from procrastination on studying for exam. Besides, 18.5%
of respondents often have problem from procrastination on studying for exam.
Furthermore, 4.2% of respondents always have problem from procrastination on
studying for exam.
Table 17 depicts the result of frequency of questionnaire item number 23: To
what degree do you procrastinate on registering for classes? (Seberapa sering anda
Table 17. Item B7
Frequency Percent
Valid
Percent
Cumulative
Percent
Valid Never 121 36.0 36.0 36.0
Almost
Never
111 33.0 33.0 69.0
Sometimes 53 15.8 15.8 84.8
Nearly
Always
40 11.9 11.9 96.7
Always 11 3.3 3.3 100.0
Total 336 100.0 100.0
The table above shows that 36% of respondents never procrastinate on registering
classes. Meanwhile, 33% of respondents seldom procrastinate on registering classes.
Besides, 15.8% of respondents sometimes procrastinate on registering classes. Also,
11.9% of respondents often procrastinate on registering classes. Then, 3.3% of
respondents always procrastinate on registering classes.
Table 18 illustrates the result of frequency of questionnaire item number 24:
To what degree is procrastination on registering for classes a problem for you?
Table 18. Item B8
Frequency Percent
Valid
Percent
Cumulative
Percent
Valid Never 117 34.8 34.8 34.8
Almost
Never
101 30.1 30.1 64.9
Sometimes 74 22.0 22.0 86.9
Nearly
Always
37 11.0 11.0 97.9
Always 7 2.1 2.1 100.0
Total 336 100.0 100.0
The table above displays that 34.8% of respondents never have problem from
procrastination on registering classes whereas 30.1% of respondents seldom have
problem from procrastination on registering classes. In addition, 22% of respondents
sometimes have problem from procrastination on registering classes. While 11% of
respondents often have problem from procrastination on registering classes, 2.1% of
students always have problem from procrastination on registering classes.
Table 19 shows the result of frequency of questionnaire item number 25: To
what degree do you procrastinate on meeting with your lecturer? (Seberapa sering
Table 19. Item B9
Frequency Percent
Valid
Percent
Cumulative
Percent
Valid Never 64 19.0 19.0 19.0
Almost
Never
103 30.7 30.7 49.7
Sometimes 131 39.0 39.0 88.7
Nearly
Always
33 9.8 9.8 98.5
Always 5 1.5 1.5 100.0
Total 336 100.0 100.0
The table above points out that 19% of respondents never procrastinate on meeting
with lecturer. Furthermore, 30.7% of respondents seldom procrastinate on meeting
with lecturer. In addition, 39% of respondents sometimes procrastinate on meeting
with lecturer. Besides, 9.8% of respondents often procrastinate on meeting with
lecturer. As well, 1.5% of respondents always procrastinate on meeting with lecturer.
Table 20 portrays the result of frequency of questionnaire item number 26: To
what degree is procrastination on meeting with your lecturer a problem for you?
Table 20. Item B10
Frequency Percent
Valid
Percent
Cumulative
Percent
Valid Never 62 18.5 18.5 18.5
Almost
Never
94 28.0 28.0 46.4
Sometimes 129 38.4 38.4 84.8
Nearly
Always
41 12.2 12.2 97.0
Always 10 3.0 3.0 100.0
Total 336 100.0 100.0
The table above indicates that 18.5% of respondents never have problem from
procrastination on meeting with lecturer and 28% of respondents seldom have
problem from procrastination on meeting with lecturer. Then, 38.4% of respondents
sometimes have problem from procrastination on meeting with lecturer. Furthermore,
12.2% of respondents often have problem from procrastination on meeting with
lecturer and 3% of respondents always have problem from procrastination on meeting
with lecturer.
Table 21 depicts the result of frequency of questionnaire item number 27: To
what degree do you procrastinate on campus activity in general? (Seberapa sering
Table 21. Item B11
Frequency Percent
Valid
Percent
Cumulative
Percent
Valid Never 47 14.0 14.0 14.0
Almost
Never
85 25.3 25.3 39.3
Sometimes 161 47.9 47.9 87.2
Nearly
Always
36 10.7 10.7 97.9
Always 7 2.1 2.1 100.0
Total 336 100.0 100.0
The table above displays that 14% of respondents never procrastinate on campus
activity in general. Besides, 25.3% of respondents seldom procrastinate on campus
activity in general. In addition, 47% of respondents sometimes procrastinate on
campus activity in general. Moreover, 10.7% and 2.1% of respondents consecutively
often and always procrastinate on campus activity in general.
Table 22 illustrates the result of frequency of questionnaire item number 28:
To what degree is procrastination on campus activity a problem for you? (Seberapa
Table 22. Item B12
Frequency Percent
Valid
Percent
Cumulative
Percent
Valid Never 54 16.1 16.1 16.1
Almost
Never
76 22.6 22.6 38.7
Sometimes 166 49.4 49.4 88.1
Nearly
Always
38 11.3 11.3 99.4
Always 2 .6 .6 100.0
Total 336 100.0 100.0
The table above portrays that, in sequence, 16% and 22.6% of respondents never and
seldom have problem from procrastination on campus activity in general. Meanwhile,
49.4% of respondents sometimes have problem from procrastination on campus
activity in general. While 11.3% of respondents often have problem from
procrastination on campus activity in general, 0.6% of respondents always have
problem from procrastination on campus activity in general.
The EED UMY students’ procrastination. After calculating all data, the
researcher determined the mean of total procrastination score and divided into three
levels based on the interval formula with SPSS. The result of frequency of total
Table 23. Frequency Table of
Total Score
Procrastination Total Score
N Valid 336
Missing 0
Mean 2.5310
Std. Deviation .52515
Skewness -.073
Std. Error of Skewness .133
Sum 850.40
Percentiles 33.33333333 2.3300
66.66666667 2.8000
As the result from the table above, the quartiles show that the students who got the
score below 2.33 are considered as having low level of procrastination whereas the
students who got the score between 2.33 and 2.80 are considered as having moderate
level of procrastination. On the other hand, students who got more than 2.80 are
considered as having high level of procrastination. Those classifications can be seen
clearer in the table 5. Moreover, the table also indicates that the average score of EED
UMY students’ procrastination is 2.531, or, if it is converted into percentage, the
that EED UMY students’ procrastination level is moderate based on the
categorization in the table 5 before.
Afterwards, the researcher decided which students belong to which level by
using Microsoft Excel. It is revealed that 120 out of 336 students (36%) are
considered as having low level of procrastination whereas 118 out of 336 students
(35%) are considered as having moderate level of procrastination. Besides, 98
students (29%) are considered as having high level of procrastination. The
[image:49.612.106.538.331.478.2]distribution of each level can be seen clearer below.
Table 24. EED UMY Students’ Procrastination Level Distribution
Level Number of Students Percentage
Valid
Low 120 36.0
Moderate 118 35.0
High 98 29.0
Total 336 100.0
The EED UMY students’ achievement. Based on UMY academic guideline
book, there are three level of students’ CGPA. They are very good, good, and
satisfactory. However, after the researcher analyzed, there are some students who are
not belong into those three levels, or their score is below satisfactory. Thus, the
researcher decided to have one more level of CGPA (bad) to accommodate those
The researcher categorizes EED UMY students’ CGPA into four levels. The
result shows that 135 out of 336 students (40%) have very good CGPA. Then, 178
out of 336 students (53%) have good CGPA. Besides, 16 out of 336 students (5%)
have satisfying CGPA. In addition, 7 students (2%) have bad CGPA. The distribution
[image:50.612.103.537.249.421.2]of each level is illustrated below.
Table 25. The Students’ Achievement Category (CGPA)
Students’ CGPA Category Frequency Percentage
Very Good : 3.51 – 4.00 135 40.0
Good : 2.76 – 3.50 178 53.0
Satisfactory : 2.00 – 2.76 16 5.0
Bad : 2.75 – below 7 2.0
Total 336 100.0
The researcher also calculated the average of EED UMY students’ achievement using
Microsoft Excel. It turns out that the average of EED UMY students’ achievement is
3.33 or the accomplishment of EED UMY students in their academic is 83%. This
number proves that EED UMY students’ achievement is good based on the category
above.
The relationship between EED students’ procrastination and their
achievement at UMY. After knowing the result of procrastination score and EED
UMY students’ achievement, the researcher intertwines both result to find out
whether both are correlated or not. The finding is attained by activating Pearson
(alternative hypothesis) is accepted. The result shows that the probability value is
0.000 which means that Ha is accepted, or there is correlation.
Furthermore, the strength and weakness of correlation can be known by the
significance correlation value. The finding indicates that the value of significance
correlation is – 0.199. It means that the correlation level between procrastination and
EED UMY students’ achievement is very low as depicted in table 6. The negative
value means that both variables have negative correlation. It means that the increase
of one point at one variable will be followed by the slight decrease at another
variable. Therefore, when the procrastination level is high, the students’ achievement
[image:51.612.112.528.415.624.2]is low. The correlational table is portrayed below.
Table 26. The Correlations between Procrastination and EED UMY Students’
Achievement
CGPA Procrastination
CGPA Pearson Correlation 1 -.199**
Sig. (2-tailed) .000
N 336 336
Procrastination Pearson Correlation -.199** 1
Sig. (2-tailed) .000
N 336 336
Discussion
The EED UMY students’ procrastination. This research discovers that EED
UMY students’ procrastination is moderate as the average score of procrastination is
2.531. 36% and 35% of students, in sequence, are low and moderate procrastinator.
Meanwhile, there are 29% of students who are high procrastinator. On the other
word, EED UMY students’ procrastination tendency is 51%.
The procrastination variances that occur in EED UMY students are two types.
It can be seen from the result that 59.5% of students occasionally procrastinate on
important thing which reflects on personal traits procrastination type. Meanwhile,
51.2% of students postpone doing something hated which refers to conditional
procrastination type. As Babadogan (2010) stated, procrastination has two different
types, they are personal traits and conditional procrastination. Hence, the result
discovers that EED UMY students suffer both types of procrastination.
The arousal factor of EED UMY students’ procrastination is dominantly from
impulsive. The finding points out that 48.5% of students sometimes find excuse for
not doing something and this happens because of their impulsiveness. It corresponds
to Steel’s (2007) and Steel’s (2010) statement which emphasizes the main reason of
procrastination is impulsive.
Although EED UMY students’ procrastination level, in average, is moderate,
the procrastination epidemic among EED UMY students is something to be worried
about. It is based on the outcome which 43.2% of students confessed that the habit of
putting off something is like incurable, even though they are aware that the habit is
because they can escape from the duty even if just for a while. This proves
Ingleheart’s theory about postmodern value. He stated that for the last thirty years,
Western society is infiltrated by postmodern values (as cited in Thakkar, 2009). As
Indonesian people nowadays try to imitate Western society life style, the result is
coherent with Ingleheart’s theory.
The EED UMY students’ achievement. The result shows that EED UMY
students’ achievement is good. This is based on the average score of the students’
CGPA that reveals 3.33 or 83%. It indicates that even though various factors affect
the achievement, the students still persist to pursue to get the best result. Therefore,
the students may have good motivation to accomplish the entire task and it should
weaken the possibility of procrastination. Heyningen confirmed that motivation has
significant influence toward students’ achievement and can predict academic success
(as cited in Pritchard & Wilson, 2003).
However, still there are 7 out of 336 students (2%) who got bad CGPA (below
2.00). This happens because the procrastination existence in EED UMY. Although it
is only 2% students who got bad CGPA, the procrastination in EED UMY should be
concern about as 16 out of 336 students (5%) got satisfying CGPA (between 2.00 –
2.75). This result matches with Semb, Glick, and Spencer (1979) and Ozer and
Sackes (2011) who highlighted that procrastination in academic setting often brings many negative results. Furthermore, Hasheminasab, Zarandi, Azizi, and Zadeh (2014) stated that there are some important factors impact student’s achievement such as
EED UMY students’ achievement is in the middle range because of some bad factors
like lack of motivation and academic procrastination.
The relationship between EED students’ procrastination and their
achievement at UMY. This research result reveals that there is relationship between
procrastination and EED students’ achievement at UMY. The correlation number is
0.000 Sig (2 tailed) signifying that the correlation is significant and the correlation
value is – 0.199 which represents that it is very low level. The result also shows that
the correlation is negative. It is when one variable increases one point, the other
variable slightly decreases. So, when procrastination level increases, students’
achievement decreases a little.
In order to see the relationship between procrastination and students’
achievement (GPA) obviously, the researcher generates cross tabulation. The
Table 27. The Cross Tabulation between Procrastination and EED Students’
Achievement (GPA) at UMY
GPA
Procrastination
GPA
Total Very
Good Good Satisfying Bad
Procrastination
Low
Frequency 60 54 4 2 120
Percentage 18% 16% 1% 1% 36%
Moderate
Frequency 52 59 5 2 118
Percentage 15% 18% 1% 1% 35%
High
Frequency 23 65 7 3 98
Percentage 7% 19% 2% 1% 29%
Total
Frequency 135 178 16 7 336
Percentage 40% 53% 5% 2% 100%
The table above indicates that students with low level of procrastination achieve high
achievement. It can be seen from the table that students with low level of
procrastination 18% have very good GPA and 16% get good GPA. As the result of
procrastination level is moderate with 51% and students’ achievement is good with
83%, there are students with moderate level of procrastination 15% attaining very
good GPA and 18% obtaining good GPA. Meanwhile, students with high level of
Procrastination has relationship with students’ achievement. It is because
procrastinator students often fail in examination and they are lack of motivation in
studying which results in low students’ achievement and the further impact is that
students quit from school and stop learning (Hussain & Sultan, 2010). Amusingly,
academic achievement could predict procrastination and vice versa (Kandemir, 2014).
So, when students have high academic achievement, it can envisage that the
procrastination level is low and vice versa. The result is linear with previous research
which was conducted in Nigeria (Akinsola, Tella, & Tella, 2007) and in India
(Lakshminarayan, Potdar, & Reddy, 2013). Those researches discovered that there is
Chapter Five
Conclusion and Recommendation
This chapter provides summary of the research and recommendation based on
research significance. The first part explains about this