©University of the South Pacific (2013)
Temperature trends in Fiji: a clear signal of climate change
Ravind Kumar
1,2, Mark Stephens
2and Tony Weir
31
Fiji Meteorological Service, Nadi, Fiji.
2
School of Geography, Earth Science and Environment, University of the South Pacific, Suva, Fiji.
3
Pacific Centre for Environment and Sustainable Development, University of the South Pacific, Suva, Fiji.
Abstract
This paper analyses trends in temperature in Fiji, using data from more stations (10) and longer periods (52-78 years) than previous studies. All the stations analysed show a statistically significant trend in both maximum and minimum temperature, with increases ranging from 0.08 to 0.23oC per decade. More recent temperatures show a higher rate of increase, particularly in maximum temperature (0.18 to 0.69oC per decade from 1989 to 2008). This clear signal of climate change is consistent with that found in previous studies of temperatures in Fiji and other Pacific Islands. Trends in extreme values show an even stronger signal of climate change than that for mean temperatures. Our preliminary analysis of daily maxima at 6 stations indicates that for 4 of them (Suva, Labasa, Vunisea and Rotuma) there has been a tripling in the number of days per year with temperature >32oC between 1970 and 2008. The correlations between annual mean maximum (minimum) temperature and year are mostly strong: for about half the stations the correlation coefficient exceeds 60% over 50+ years. Trends do not vary systematically with location of station. At all 7 stations for which both trends are available there is no statistically significant difference between the trends in maximum and minimum temperatures.
Keywords: Climate change, temperature, Fiji, observations 1930-2008
1. Introduction
Climate change refers to “a change in the state of
the climate that can be identified (e.g. by statistical tests) by changes in the mean and/or the variability of its properties, and that persists for an extended period” (Solomon et al., 2007). Significant changes in climate are widely expected to occur if global emissions of greenhouse gases persist at their present rate or greater, and such changes are projected to have significant social impacts on social and biophysical impacts on the Pacific Islands in coming decades (IPCC, 2007a; Weir and Orcherton, 2012). Therefore there is great interest in the extent to which climate change is already occurring in the Pacific Islands.
Unfortunately there have been very few analyses of long-term climatic trends in this region, in part because there are very few stations whose data is available for long enough periods and of high enough data quality for this purpose. The Australian Bureau of Meteorology and CSIRO (2011) have made a significant advance on this issue, in collaboration with the various national meteorological services, by analysing climate records from 14 developing island countries of the South Pacific under the Pacific Climate Change Science Program (PCCSP), funded by Australian Aid. The program also reviews climate projections for the region. Its principal scientific results to date are set out in a regional overview (hereinafter cited as PCCSP 2011a) and a volume of country reports (hereinafter cited as PCCSP 2011b). Each country report, including that for Fiji, includes a summary of observations over the past 60 years, but only from one or two stations. For Fiji, PCCSP
(2011b) gives results only for Nadi and Suva. The main purpose of the present paper is to extend the PCCSP results on temperatures in Fiji to a longer period and to a greater range of stations. The longest records we use are from three sugar mills and from the outlying island of Rotuma, all of which extend for nearly 80 years.
The PCCSP results for Fiji agree with those of Mataki et al. (2006). Both found a significant upward trend of ~0.7oC in mean annual temperature at both Nadi and Suva (Laucala Bay) over the past 50 years. Their agreement is not surprising since they both looked at almost the same data sets, namely Fiji Meteorological Service records from 1961-2003 for Mataki et al. (2006) and 1950-2009 for PCCSP (2011b). However, the data set used by PCCSP had
been ‘homogenised’ to improve its data quality,
Figure 1. Location of meteorological stations in Fiji, with their mean annual rainfall indicated in brackets. Note that Rotuma is located well to the North of the other stations, as indicated in Table 1 [Map specially drawn for this paper by C. Pene].
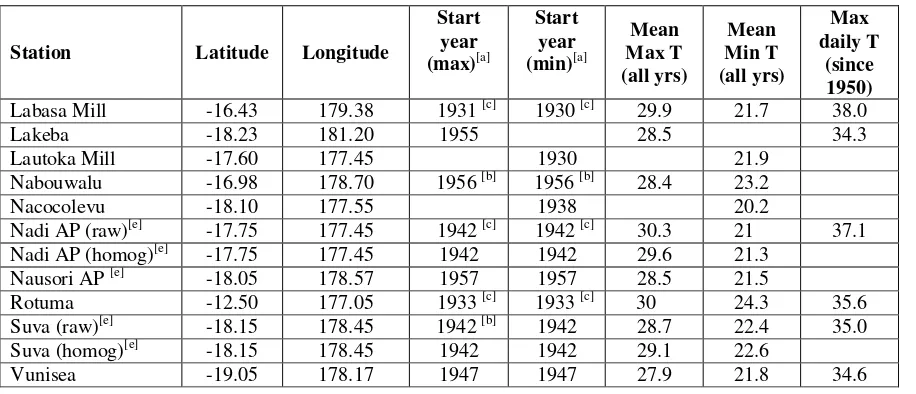
Table 1. List of stations analysed in this paper.
Station Latitude Longitude
Start year (max)[a]
Start year (min)[a]
Mean Max T (all yrs)
Mean Min T (all yrs)
Max daily T
(since 1950) Labasa Mill -16.43 179.38 1931 [c] 1930 [c] 29.9 21.7 38.0
Lakeba -18.23 181.20 1955 28.5 34.3
Lautoka Mill -17.60 177.45 1930 21.9
Nabouwalu -16.98 178.70 1956 [b] 1956 [b] 28.4 23.2
Nacocolevu -18.10 177.55 1938 20.2
Nadi AP (raw)[e] -17.75 177.45 1942 [c] 1942 [c] 30.3 21 37.1
Nadi AP (homog)[e] -17.75 177.45 1942 1942 29.6 21.3
Nausori AP [e] -18.05 178.57 1957 1957 28.5 21.5
Rotuma -12.50 177.05 1933 [c] 1933 [c] 30 24.3 35.6
Suva (raw)[e] -18.15 178.45 1942 [b] 1942 28.7 22.4 35.0
Suva (homog)[e] -18.15 178.45 1942 1942 29.1 22.6
Vunisea -19.05 178.17 1947 1947 27.9 21.8 34.6
Notes:
[a]
End year for all data sets is 2008.
[b]
Only one type 1 inhomogeneity, which was in 1987-88
[c]
Numerous Type 1 inhomogeneities (up to 4)
[d]
One Type 1 inhomogeneity (in 1933)
[e]
AP = Airport; ‘raw’ and ‘homog’ refer to records before and after the homogenisation process described in section 2 of this paper.
[f]A ‘type 1 inhomogeneity’ is a discontinuity in the autocorrelation of the monthly
located on or near the coast of one of the 300 islands that comprise the Fiji group. Note that Rotuma (about 600 km N of Nadi) lies well away from the rest of the always warm and humid, but without great extremes of heat or cold. Fiji Meteorological Service (FMS, 1995) summarise the temperature regime of the Fiji Islands, as follows:
‘Temperatures at the lower levels around Fiji are fairly uniform. In the lee of the mountains, however, the day-time temperatures often rise 1 to 2ºC above those on the windward sides or on the smaller islands. Also, the humidity on the lee side tends to be somewhat lower. Due to the influence of the surrounding ocean, the changes in the temperature from day to day and season to season are relatively small. The average temperatures change only about 2 to 4ºC between the coolest months (July and August) and the warmest months (January to February). Around the coast, the average night-time temperatures can be as low as 18ºC and the average day-time temperatures can be as high as 32ºC. In the high central parts of the main islands (which reach ~1000 m in altitude), average night-time temperatures can be as low as 15ºC. Past records, however, show extreme temperatures as low as 8ºC and as high as 39.4ºC have been recorded in Fiji. South-eastern coastal areas and the high interior of the main islands often experience persistent cloudy and humid weather.’
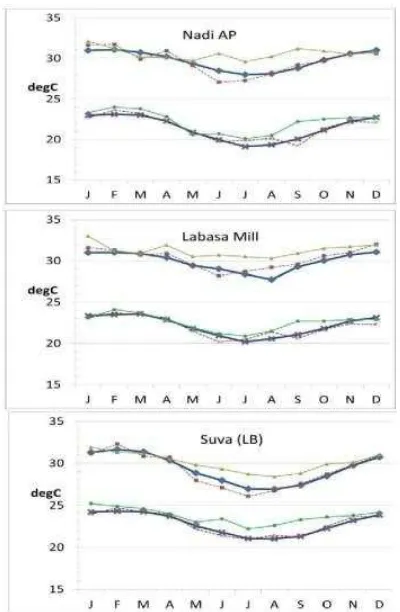
This picture is confirmed by our data in Figure 2. It is notable that temperature does not reflect the
strong difference in rainfall between the ‘dry’ (leeward) and ‘wet’ (windward) sides of the main
islands. (Compare the variation in mean rainfalls shown in Figure 1 to those in temperatures shown in Figure 2 and Table 1.)
2. Data Sources and Quality
Temperature data in the form of monthly means of daily maximum and daily minimum in that month were obtained directly from FMS. Only the 10 sites listed in Table 1 satisfied data integrity criteria based on the length of record (>50 years), percent of missing data (<20%), quality control and homogeneity tests.
Temperature in Fiji does not vary dramatically from one day to the next, unlike rainfall. Therefore an occasional missing value in the daily record can be replaced by the normal value for that month (i.e. the 30-year average) without making significant error in statistical measures such as means and trend. But to do this for more than one day in a month is regarded as dubious; we have excluded such months from our analysis.
means for a ‘warm’ year (2007), dashed lines show monthly means for a ‘neutral’ year (1985). Note the
very low variation between stations, between years, and between seasons (<3oC) . (Tmax- Tmin) typically autocorrelation, indicated that the data was useable, though there were a few small jumps in the data for
(‘homogenised’) data. Homogenisation is
(WMO, 2009). Following these revisions, the data for a few years (mostly early in the record) was not used here, as it included too many missing or dubious values. These are the main differences from the
‘raw’ monthly data for Nadi and Suva used by Mataki
et al. (2006).
By far the longest continuous climatological records available in Fiji are those for the four sugar mills and the government station at Rotuma, which have kept rainfall and basic temperature records for around 100 years. The older records from these sites were originally maintained only as hand-written logbooks, but the records since about 1930 have recently been digitised by FMS to enable easier analysis. Although some preliminary analysis of the climate records from sugar mills has been carried out by Mr. J. Gawander of Fiji Sugar Corporation, the current paper is the first substantial analysis of much of this older data.
3. Statistical Methods
All calculations in this paper were performed using the statistical functions in Microsoft Excel for linear regression analysis. The equations and concepts of single-variable linear regression are set out in innumerable textbooks on statistics. With year as the independent variable (x) and annual mean maximum (minimum) temperature as the dependent variable (y) , the least squares regression line takes presentation shows not only the statistical significance of the results but also gives numerical confidence limits on the calculated trends. As shown by Montgomery et al. (2006), with a sample size N
>15 (as in all our cases) , statistically there is only a
5% chance that the ‘true’ trend lies outside the range (m2 ,s m2 )s according to Student’s t-test. In particular only if that range does not include zero, can we have 95% confidence that the trend differs significantly from zero.
4. Long-term Trends (~50 years)
4.1 Regional results from PCCSP
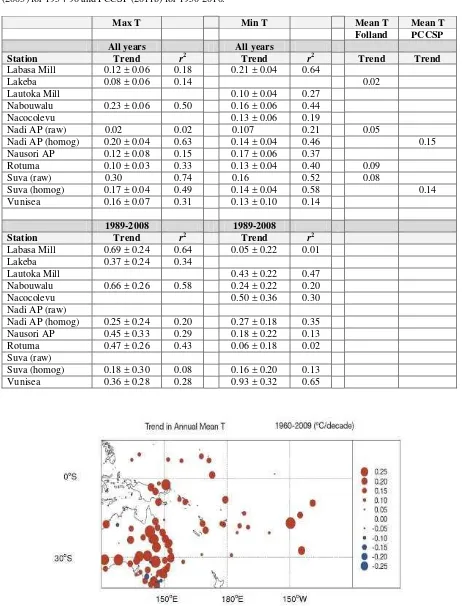
Long-term temperature trends in the Pacific have
been updated by the PCCSP through collaboration with the national meteorological services in Partner Countries. The updated PCCSP region temperature records show clear and consistent warming over the past 50 years for all the Pacific Islands shown in Figure 3 , with most stations recording trends around +0.08 to +0.20°C per decade over this time. The strongest warming is found in Papua New Guinea and French Polynesia. Note that (unlike Figure 4 below, which shows trends in Tmax and Tmin separately)
Figure 3 shows trends in mean temperature records for Nadi and Suva (PCCSP, 2011b).
PCCSP (2011a) also reports that the amount of warming in the wet and dry seasons is similar at most stations. They conclude that the magnitude of background warming over the past half-century shown in temperature records from the Pacific Islands is consistent with that expected from human-induced global warming.
4.2 Maximum temperatures
Figure 4 shows time series and trend lines for annual mean maximum temperature and annual mean minimum temperature at each of the Fiji stations for which this data is available, as listed in Table 1. To plotting the results as actual temperatures in oC. As a
measure of ‘normal’ climatic variation, each chart
also shows the standard deviation of X over the period 1971-2000 from the average of X over the same period.
Discounting the ‘raw’ [uncorrected] data sets
from Nadi and Suva, which we discuss below, several
features stand out from the ‘long-term’ trends in
Tmax, shown in Table 2, which are the slopes of the
Table 2. Trends in mean annual maximum and minimum temperatures in oC/decade over ‘all years’ and 20 years (1989-2008). ‘All years’ refers to all years for which data is available for that station. ‘Trend’ here means slope m of the least-squares regression line; values are given as m ± 2s where s is the standard error in m. Also shown for each trend is r2, where r is its correlation coefficient, and some comparable results from Folland et al.
(2003) for 1954-98 and PCCSP (2011b) for 1950-2010.
Max T Min T Mean T Mean T
Folland PCCSP
All years All years
Station Trend r2 Trend r2 Trend Trend
Labasa Mill 0.12 ± 0.06 0.18 0.21 ± 0.04 0.64
Lakeba 0.08 ± 0.06 0.14 0.02
Lautoka Mill 0.10 ± 0.04 0.27
Nabouwalu 0.23 ± 0.06 0.50 0.16 ± 0.06 0.44
Nacocolevu 0.13 ± 0.06 0.19
Nadi AP (raw) 0.02 0.02 0.107 0.21 0.05
Nadi AP (homog) 0.20 ± 0.04 0.63 0.14 ± 0.04 0.46 0.15
Nausori AP 0.12 ± 0.08 0.15 0.17 ± 0.06 0.37
Rotuma 0.10 ± 0.03 0.33 0.13 ± 0.04 0.40 0.09
Suva (raw) 0.30 0.74 0.16 0.52 0.08
Suva (homog) 0.17 ± 0.04 0.49 0.14 ± 0.04 0.58 0.14
Vunisea 0.16 ± 0.07 0.31 0.13 ± 0.10 0.14
1989-2008 1989-2008
Station Trend r2 Trend r2
Labasa Mill 0.69 ± 0.24 0.64 0.05 ± 0.22 0.01
Lakeba 0.37 ± 0.24 0.34
Lautoka Mill 0.43 ± 0.22 0.47
Nabouwalu 0.66 ± 0.26 0.58 0.24 ± 0.22 0.20
Nacocolevu 0.50 ± 0.36 0.30
Nadi AP (raw)
Nadi AP (homog) 0.25 ± 0.24 0.20 0.27 ± 0.18 0.35
Nausori AP 0.45 ± 0.33 0.29 0.18 ± 0.22 0.13
Rotuma 0.47 ± 0.26 0.43 0.06 ± 0.18 0.02
Suva (raw)
Suva (homog) 0.18 ± 0.30 0.08 0.16 ± 0.20 0.13
Vunisea 0.36 ± 0.28 0.28 0.93 ± 0.32 0.65
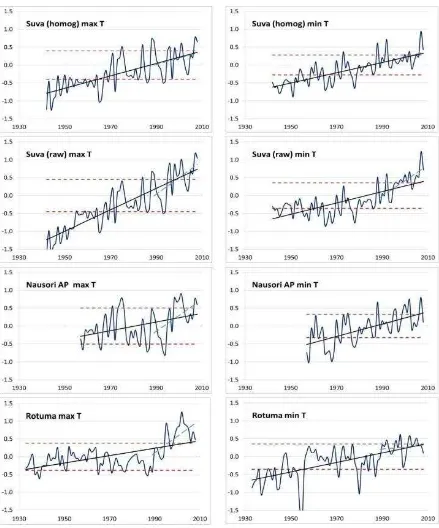
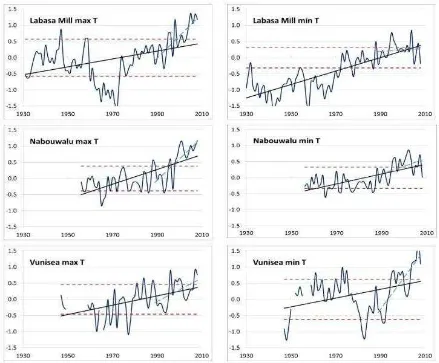
Figure 4(a). Charts of annual anomalies in temperature (i.e. deviations from mean for 1971-2000). Maxima on left, minima on right. Vertical scale (-1.5 to +1.5oC) is same for all plots, as is horizontal scale (years 1930 to 2010). Value plotted for each year is effectively the annual mean of daily maximum (minimum) temperature. Each chart also shows regression (trend) line for all data years (solid) and for most recent 20 years (1989-2008,
Figure 4(b). Annual anomalies in temperature for Labasa Mill, Nabouwalu, Vunisea. Maxima on left, minima on right. Plotting conventions as in Figure 4(a). For Labasa, anomalies just off the scale of the chart are all -1.6oC.
(1) For all stations examined, there is a strong tendency for Tmax to increase over time, with
correlation coefficients r of at least 40%, and for three stations (Nabouwalu, Nadi and Suva) r > +0.7. Numerical values for the trend are shown in Table 2. The increase in Tmax ranges from
0.08oC/decade (at Lakeba) to 0.23oC/decade (at Nabouwalu).
(2) This strongly increasing and significant trend contrasts markedly to the data for rainfall at the same stations, at very few of which did the linear trend rank as statistically significant; at no station did the calculated linear trend account for more than 4% of the variance in annual rainfall (Kumar et al., 2013) .
(3) As is to be expected with a strongly increasing trend, there is a strong tendency for the highest values of mean maximum temperatures to occur in the most recent decade. The charts for Rotuma, Labasa Mill, Nabouwalu, and Vunisea
show this clearly, with the ‘outlying’ high
temperatures (those more than 1 standard deviation above the normal) occurring in the most recent decade.
4.3 Effect of data revisions
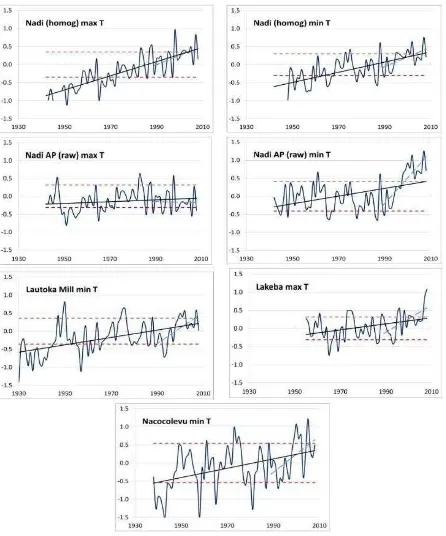
Figure 4 shows both the ‘raw’ and the revised (‘homogenised’) data sets for Suva and Nadi. The
revisions have a substantial effect on the results for both those stations.
The ‘raw’ Suva data for maximum temperatures
shows the strongest and most linear increase of all stations, with a trend slope of 0.30oC/ decade, and a very high correlation coefficient of +86%. There is a strong suspicion that this relatively high increase may
be partly due to a ‘heat island’ effect, especially as
Figure 4(c). Annual anomalies in temperature for Nadi (homogenised), Nadi (raw), Lautoka Mill, Lakeba, Nacocolevu. Maxima on left, minima on right. Plotting conventions as in Figure 4(a).
changed much since ~1990, as confirmed by local residents.
As a further check, we have analysed the data for Nausori airport, which is about 20 km from Suva and can also be taken to represent the climate of the SE coast of Viti Levu. There has been no building in the near neighbourhood of this station, so it should be less prone to heat island effects than Laucala Bay. For the period of overlap (since 1957), the chart for
Tmax at Nausori very closely tracks that for the revised
Suva record. However the calculated slope m and correlation coefficient r are both smaller at Nausori, because that record does not include what the Suva record suggests are the cooler years in the 1940s and early 1950s (Figure 4). This leads us to suggest that
the ‘raw’ Suva temperature record has indeed been
In contrast , the ‘raw’ data set for Nadi maxima
has the lowest rate of increase of all the sets analysed (maximum or minimum), with a correlation coefficient indistinguishable from zero, as was reported by Mataki et al. (2006). The 2011 quality check on Nadi rejected quite a lot more data from the 1940s than the old set (which shows as missing annual values in the chart). Although the homogenisation procedure made no use of data from other stations, the revised data for Nadi is much more in line with the other stations.
4.4 Minimum temperatures
Table 2 and Figure 4 also show time series and trend lines for annual mean minimum temperature at each of the 10 Fiji stations for which this data is available, as listed in Table 1. As for Tmax, the data is
presented as anomalies relative to the means for 1971-2000. Some outstanding features of the charts of Tmin are:
(1) At almost all stations, there is strong tendency for the minimum temperature to increase over the years. Table 2 shows that the rates of increase and the correlation coefficients are about as high as those for maximum temperature, so these increases are clearly statistically and physically significant. .
(2) The data revisions for Nadi and Suva do not make nearly as much difference to the results for
Tmin as they do for Tmax, although the revised data
for Nadi does yield a higher correlation
coefficient than the ‘raw’ data.
4.5 Comparison between trends in maxima and minima
According to Table 2, the ‘long-term’ rate of increase of Tmax exceeds that of Tmin at 3 of the 7
stations for which both are available, but is less than that for Tmin for the other 4. However most of these
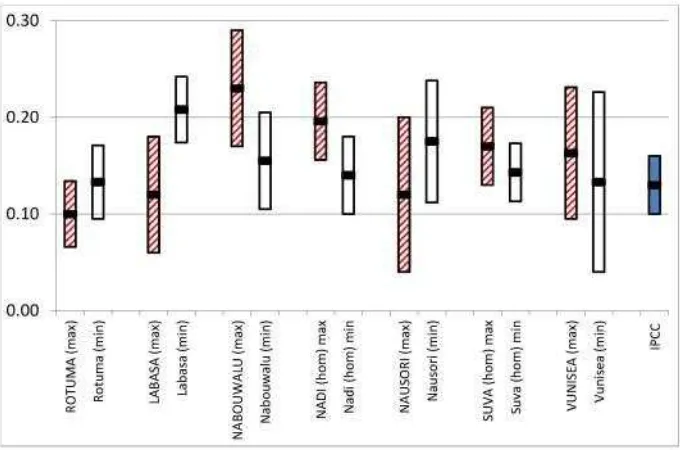
differences are statistically insignificant. Following Cumming (2011) we take the difference in slopes m
to be significant (effectively at 90% level) only if it exceeds twice the standard error in the slope s. These confidence limits (i.e. m±2s) are shown in Figure 5, which shows that the confidence limits overlap for all stations, although barely so for Labasa. Overall, these results do not give much support for the conclusion of PCCSP (2011b) who found a tendency for greater warming in the daytime (i.e. in Tmax, since Tmin almost always occurs at night).
Since the rates of increase of Tmax and Tmin are
similar, it follows that so too will be the rate of increase of their average, namely Tmean. This can be
compared directly to the rate of increase of global average surface temperature, as determined by the Intergovernmental Panel on Climate Change. IPCC (2007b) find that the linear warming trend over the last 50 years [to 2005] is 0.13 ± 0.03oC per decade [90% uncertainty range], which is also shown in Figure 5. It would be fair to say that our results are consistent with this, bearing in mind the uncertainty ranges and that the IPCC figure is a global average. Table 2 shows that our results (with the possible exception of Lakeba) are also consistent with those of Folland (2003) and PCCSP (2011b), who both cover fewer Fiji stations than we do.
5. Short-term Trends (~20 years)
A look at the charts strongly suggests that the rate of increase in Tmax has increased in recent years. This
conclusion is largely confirmed by the ‘short-term’ trends in Figure 4 and Table 2, which are linear fits to the data for the most recent 20-year period available the trends for both Nadi and Suva are not statistically different from zero.
For Labasa, Lakeba, Nabouwalu, Nausori, and Rotuma the 20-year rate of increase of Tmax over the
recent 20 years is at least triple those over 50 years, and is statistically significant (r >0.5) in itself and in its difference from the long-term trend (p >0.95). Consistent with this, for these stations most of the hottest years in their records occur in the last 20 years (indicated by anomalies more than 1 standard deviation above the normal in Figure 4).
The 20-year trends in Tmin show much less change
from the 50-year trends than is the case for Tmax.
Only three stations (Lautoka Mill, Vunisea and Nacocolevu) show a significant recent increase in slope, in both cases reflecting relatively low minimum temperatures in the early 1990s compared to both later and earlier periods. For several other stations (Labasa, Suva, Nausori and Rotuma) the 20-year trend in Tmin is both small (m <0.1oC/decade)
and statistically insignificant (r <0.2).
Such changes are not surprising, since IPCC report that global mean surface temperature has increased faster in the most recent 25-year period (to 2005) (0.177 ± 0.052oC/decade) than for the corresponding 50-year period (0.128 ± 0.026oC/decade) (FAQ3.1 of Trenberth et al., 2007), a change largely attributed to a continued increase in the tonnage of greenhouse gases in the atmosphere. More locally, a shift in the position of the South Pacific Convergence Zone since about 1990, noted by PCCSP (2011a), may also have influenced these
Suva. (Although the text of the paper by Mataki et al.
(2006) implies that Nadi showed a similarly significant increase in number of hot days per year, this appears to be a misprint, as their Table 3 implies that any such increase at Nadi has r <0.3, and therefore is barely significant.)
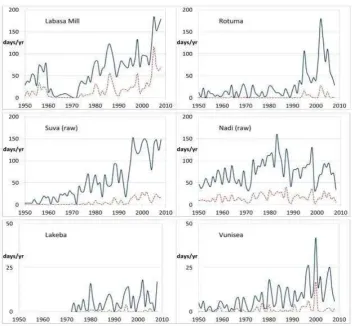
Figure 6 shows charts of number of hot days per year from our preliminary analysis of 6 stations,
showing not only the number of days with maximum temperature exceeding 32oC but also the [much smaller] number exceeding 33oC. Four of these stations (Suva, Rotuma, Labasa Mill, and Vunisea) show a strong increase in number of days >32oC, with correlation coefficients exceeding 60%. A recent analysis by Hansen et al. (2012) suggests that such increases in the number of extremely hot days are occurring across much of the world. For both Suva and Labasa, Figure 6 indicates a tripling in the number of hot days between 1970 and 2010, which is an even more striking indicator of warming than the trends in annual mean maximum temperature. The other two stations (Nadi and Lakeba) also show a tendency for such an increase but not nearly so markedly as the others.
The data analysed here for both Suva and Nadi is
the ‘raw’ set (i.e. the same as that used by Mataki et al. (2006) but back to 1950 rather than to 1961) but we would expect that a count like this is not as sensitive to occasional errors in daily measurements as are the trends of Figure 4. We also remark that any missing values in the daily records can lead only to hot days being undercounted rather than overcounted.
Another striking feature of Figure 6 is that the number of days exceeding 33oC is much smaller than the number exceeding 32oC. This is consistent with the remarks in Section 1 about the absence of great extremes of temperature, and supported by the maximum daily temperatures since 1950 shown in Table 1. Compare Melbourne, where the monthly mean maximum temperature in January is 30oC but it is quite common for the daily maximum to be ~10oC higher or lower than the monthly mean (Bureau of Meteorology, 2012); such changes there are usually caused by moving fronts (Simmonds and Richter, 2000) . However, for Suva and Labasa in particular, the two curves follow each other quite closely, with
Figure 6. Number of ‘hot’ days per year at various stations, exceeding 32oC (solid curves), and 33oC (dashed). Note that the vertical scale is different for the bottom two charts.
Trends in extreme values show an even stronger signal of climate change than those for mean temperatures. Our preliminary analysis of daily maxima at 6 stations indicates that for 4 of them (Suva, Labasa, Vunisea and Rotuma) there has been a tripling in the number of days per year with temperature >32oC between 1970 and 2008. However, extremely hot days (>35oC) remain mercifully rare in Fiji. We have not yet tested the extent to which the parallel decrease in cool nights found by Mataki et al. (2006) at Suva generalises to other stations.
The trends are strong enough to leave no doubt about their physical significance: about half the correlation coefficients between annual mean maximum (minimum) temperature and year are 60% or more over 50+ years. Comparison with data from nearby Nausori and with the ‘homogenised’ data of PCCSP (2011b) suggests that the increase in maximum temperature at Suva is about the same as for other Fiji stations; the higher rate reported for Suva by Mataki et al. (2006) seems to be at least
partly due to a ‘heat island’ effect.
At all 7 stations for which both trends are available there is no statistically significant difference between the trends in maximum and minimum temperatures. Our results, covering a wider range of
Fiji stations than analysed by PCCSP (2011b) do not support their suggestions that increases may be systematically greater for maxima than for minima and that they differ systematically from west to east within Fiji. PCCSP (2011b) also found a strong correlation at Nadi between seasonal mean temperatures and Southern Oscillation Index (SOI), similar to that for rainfall; in follow-up work we plan to test the extent to which this generalises to other stations in Fiji.
Acknowledgements
http://www.publish.csiro.au/journals/spjnas
References
Australian Bureau of Meteorology and CSIRO. 2011.
Climate Change in the Pacific: Scientific Statistics: Effect Sizes, Confidence Intervals, and Meta-Analysis. Routledge, London, UK.
FMS. 1995. The Climate of Fiji. Information Paper No. 35, Fiji Meteorological Service: Nadi, Fiji. http://www.met.gov.fj, accessed 1 December 2012. Folland, C.K., Salinger, M.J., Jiang, N. and Rayner,
N.A. 2003. Trends and variations in South Pacific island and ocean surface temperatures. Journal of Climate 16, 2859-2874.
Hansen, J., Sato, M. and Ruedy, R. 2012. Perception of Climate Change. Proceedings of the National Academy of Science (USA) 109, E2415-E2423. IPCC. 2007a. Climate Change 2007: Synthesis
Report. Intergovernmental Panel on Climate Change, Cambridge University Press, Cambridge, UK.
IPCC. 2007b. Summary for policymakers. In:
Climate Change 2007: The Physical Science Basis. Contribution of Working Group I to the Fourth Assessment Report of the Intergovernmental Panel on Climate Change, S. Solomon et al. (Eds), Cambridge University Press, Cambridge, UK. Kumar, R., Stephens, M. and Weir, T. 2013. Rainfall
trends in Fiji. International Journal of Climatology
online, DOI: 10.1002/joc3779.
Manton, M.J., Della-Marta, P.M., Haylock, M.R., Hennessy, K.J., Nicholls, N., Chambers, L.E., Collins, D.A., Daw, G., Finet, A., Gunawan, D., Inape, K., Isobe, H., Kestin, T.S., Lefale, P., Leyu, C.H., Lwin, T., Maitrepierre, L., Ouprasitwong, N., Page, C.M., Pahalad, J., Plummer, N., Salinger, M.J., Suppiah, R., Tran, V.L., Trewin, B., Tibig, I. and Yee, D. 2001. Trends in extreme daily rainfall and temperature in southeast Asia and the south Pacific: 1961-1998. International Journal of Climatology 21, 269-284
Mataki, M., Koshy, K.C. and Lal, M. 2006. Baseline climatology of Viti Levu (Fiji) and current climatic trends. Pacific Science 60, 49-68.
Montgomery, D., Peck, E. and Young, G. 2006.
Introduction to Linear Regression Analysis. Wiley, New York.
PCCSP. 2011a. Climate Change in the Pacific: Scientific Assessment and New Research. Volume 1: Regional Overview. Pacific Climate Change Science Program (Australian Bureau of Meteorology and CSIRO): Melbourne. http://www.pacificclimatechangescience.org, accessed 1 December 2012.
PCCSP. 2011b. Climate Change in the Pacific: Scientific Assessment and New Research. Volume 2: Country Reports. Pacific Climate Change Science Program (Australian Bureau of Meteorology and CSIRO): Melbourne. http://www.pacificclimatechangescience.org, accessed 1 December 2012.
Simmonds, I. and Richter, T. 2000. Synoptic comparison of cold events in winter and summer in Melbourne and Perth. Theoretical and Applied Climatology 67, 19-32.
Solomon, S., Qin, D., Manning, M., Chen, Z., Marquis, M., Averyt, K.B., Tignor, M. and Miller, H.L. (Eds). 2007. Climate Change 2007: The Physical Science Basis. Contribution of Working Group I to the Fourth Assessment Report of the Soden, B. and Zhai, P. 2007. Observations: surface and atmospheric climate change. In: Climate Change 2007: The Physical Science Basis. Contribution of Working Group I to the Fourth Assessment Report of the Intergovernmental Panel on Climate Change, S. Solomon et al. (Eds), Cambridge University Press, Cambridge, United Kingdom.
Wang, X.L.L. 2008. Accounting for autocorrelation in detecting mean shifts in climate data series using the penalized maximal t or F test. Journal of Applied Meteorology and Climatology 47, 2423-2444.
Weir, T. and Kumar, A. 2008. Wind power in Fiji: (almost) too little or too much. In: Third International Solar Energy Society Conference, Asia Pacific Region, Sydney, Australia.
Weir, T. and Orcherton, D. 2012. Climate change issues in the Pacific islands: an overview. In:
Climate 2012, W. Leal et al. (Eds), (5-9 November 2012), online at http://www.climate2012.de, accessed 1 December 2012.
WMO. 2009. Guidelines on Analysis of Extremes in a Changing Climate in Support of Informed
Decisions for Adaptation. WMO/TD-1500,
WCDMP-72, World Meteorological Organization, Geneva.
Correspondence to: T. Weir