Covariance Analysis of Voltage Waveform Signature
for Power-Quality Event Classification
Ömer Nezih Gerek, Do˘gan Gökhan Ece, and Atalay Barkana
Abstract—In this paper, covariance behavior of several features (signature identifiers) that are determined from the voltage wave-form within a time window for power-quality (PQ) event detection and classification is analyzed. A feature vector using selected signa-ture identifiers such as local wavelet transform extrema at various decomposition levels, spectral harmonic ratios, and local extrema of higher order statistical parameters, is constructed. It is observed that the feature vectors corresponding to power quality event in-stances can be efficiently classified according to the event type using a covariance based classifier known as the common vector classi-fier. Arcing fault (high impedance fault) type events are success-fully classified and distinguished from motor startup events under various load conditions. It is also observed that the proposed ap-proach is even able to discriminate the loading conditions within the same class of events at a success rate of 70%. In addition, the common vector approach provides a redundancy and usefulness information about the feature vector elements. Implication of this information is experimentally justified with the fact that some of the signature identifiers are more important than others for the discrimination of PQ event types.
Index Terms—Covariance analysis, event classification, higher order statistics, power-quality (PQ) analysis.
I. INTRODUCTION
T
HERE is an ever increasing interest in detection and classi-fication of power-quality (PQ) events due to costly invest-ments on delicate electronic devices. One of the most common PQ event types of voltage sags, due to the distribution system faults or switching on large loads, may shut down processes run by susceptible electronic devices. There has been several system proposals for the detection and classification of PQ events. The first step in these proposals is the monitoring and acquisition of large amount of waveform data from a distribution system under consideration. The next step is the detection and classification of PQ events using automated, on or offline systems from ac-quired data. The focus of this paper is related with the second step. Since the acquired waveform is usually in digital form, the available analysis tools are digital signal processing (DSP) and computer-aided statistical analysis. The DSP tools are rel-atively well established, and they mostly include spectral do-main analysis, correlative methods, and wavelets. The survey in [1] cites most of the work in this area. The DSP-based methods such as wavelet and Fourier transforms provide the quantitativeManuscript received March 7, 2005; revised February 28, 2006. This work was supported by the Anadolu University Research Fund under Contract 06000212. Paper no. TPWRD-00124–2005.
The authors are with Anadolu University, School of Engineering and Archi-tecture, Electrical and Electronics Engineering Department, Eskis¸ehir 26470, Turkey.
Digital Object Identifier 10.1109/TPWRD.2006.877102
data (or the feature vector) for the automated detection and clas-sification. These data are then fed to a classifier that is designed using statistical analysis tools, ranging from simple thresholders [14] to rather sophisticated inference methods [2]. In this mul-tidisciplinary area of PQ event analysis, even algorithms used for speech recognition such as “Dynamic Time Warping” are employed as a classification tool [4]. No matter how powerful and efficient a proposed classifier may be, a poorly selected fea-ture vector would yield inaccurate classification results. For ex-ample, consider two different voltage sag events, due to the same type of a fault in a distribution grid. Although both events are caused by the same type of a fault, the recorded voltage wave-form properties may be quite different in terms of sag magni-tude, duration, and harmonic content of transient imposed upon voltage waveform. Therefore, prior to the automated classifica-tion, a well defined feature vector, which accurately describes the signature of an event, is needed.
In this work, the system voltage is acquired as described in Section II, and a multidimensional feature vector is constructed from a time window that contains not only the event instant but also pre- and post-event voltage waveform data. This feature vector development is based on a combination of modern signal processing methods including local wavelet extrema, short-time spectral harmonics, and local higher order statistical parameter extrema. The details of the considered feature vector including its extraction from waveform data and element-wise character-istic behavior are explained in Section III.
Although the selection of signature identifiers for a well defined feature vector is crucial, another critical step is the design of a classifier which uses the feature vector. In Sec-tion IV, a novel covariance-based subspace classifier, known as the “common vector classifier” (CVC), which was recently used for speech recognition [9], is illustrated. Since it is a covariance-based classifier, the CVC structurally resembles the Karhunen Loeve Transform (KLT). However, the discrim-inative feature vector selection of the CVC is inherited from a different idea, and results in a different transform [8]. The reason of adopting the CVC as a classifier is two-fold. First, it is a successful classifier which eliminates the weak points of KLT or principle component analysis (PCA) by incorpo-rating different subspaces to each class. Second, it provides information and insight about classification strength of each feature vector element according to their distances from se-lection boundaries. Therefore, using this classifier, it is shown that some of the proposed feature elements are more effective in classification process. Other celebrated classifiers such as Bayesian classifiers, support vector machines (SVMs), and neural networks, are also more or less capable of exhibiting a
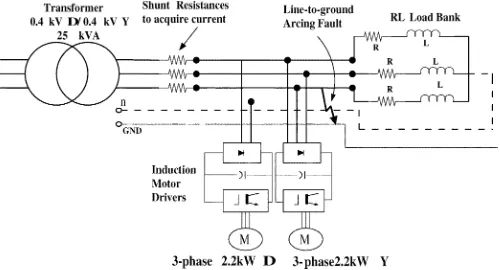
Fig. 1. Experimental low-voltage system.
similar performance to the CVC; however, they do not provide the information regarding the discriminative features of the event waveform signature.
In Section V, experimental classification results obtained by the proposed feature vector using the CVC method are presented and compared to those obtained from two other popular clas-sifiers; SVMs and Bayesian. To test the detection and classifi-cation performance of the proposed scheme, a real-life experi-mental system is constructed. Since all the acquired data are ob-tained from real life experimental system, the data naturally con-tains parametrical randomness and added noise due to system loads and environmental conditions. The use of such real life data justifies the effectiveness and generality of the proposed method as opposed to methods tested by using computer gener-ated data. Nevertheless, the proposed system parameters can be further tuned and improved by collecting more voltage wave-form data under numerous loading and environmental condi-tions. Using the experimental data, good classification results are obtained for the discrimination of arcing fault-type events from motor startup events. Interestingly, it was also observed that the proposed feature vector—classifier combination is even capable of providing an information for the load condition of the experimental system within the same class of PQ events. Since the CVC method is capable of indicating which elements of the feature vector are more discriminative (or useful) for the classi-fication of certain types of events, by eliminating the less useful signature identifiers from the feature vector, successful classifi-cation results were also obtained.
II. EXPERIMENTALSETUP
Using the experimental setup shown in Fig. 1, statistically sufficient number of PQ experiments were conducted under available variation of loading conditions. Voltage waveforms of real-life PQ events were captured at 20 kHz from the ex-perimental system. The system is composed of a three-phase wye-connected 400-V, 50-Hz, 25-kVA, five-wire supply loaded with RL load bank and three-phase induction motors coupled with varying mechanical loads. The system also includes adjustable speed drives controlling the induction motors for studying load generated harmonics. Experimental voltage sag events were obtained by starting mechanically loaded induction motors in a controlled way. During the motor starting experi-ments, mechanical loading was changed between 50%–100%
of rated load. Also, the instantaneous value of the supply voltage at the time of motor starting was naturally random. As a result, various voltage sag levels were obtained and acquired to be used in the proposed algorithm.
Arcing fault events were staged between a phase wire and the ground wire by stripping their insulation for a few millime-ters, aligning the stripped parts, and placing several strands of AWG 12 electrical wire between the stripped portions of the phase and ground wires. The arcing faults were initiated in a controlled fashion by turning on the switch connected in series to the phase wire. Once initiated, arcing fault experiments were recorded until the fault clears itself. Due to the randomness of the physical way of preparing the wire samples and random-ness of the instantaneous value of the voltage supplying the fault at the instant of fault initiation, a wide variety of fault sample records was obtained. As an example to the physical random-ness of the process, it was observed that while some of the arcing faults restriked several times before clearing itself, others striked once and cleared quickly.
The data-acquisition unit consists of an analog-to-digital con-verter (ADC) unit that was set to perform signal sampling at 20 kHz at each channel simultaneously from four different chan-nels. The data-acquisition system also includes programmable digital filters that can be adjusted to perform sharp frequency selective filtering operations in real time.
III. PQ EVENTS ANDFEATUREVECTORCONSTRUCTION
The feature vector used in this work consists of scalar num-bers obtained by three major methods; wavelets, spectrum anal-ysis, and higher order statistical parameters. The instrumenta-tion in our experimental system acquires the voltage and current waveforms and their 50-Hz notch-filtered versions at a sampling rate of 20 kHz for each waveform. The local estimation window size was selected as 800 samples which corresponds to twice the fundamental period length.
The feature vector contains 19 signature identifiers. The first eight correspond to the wavelet transform extrema for the four-level decomposition of voltage waveform using the Daubechies-4 (db4) orthogonal wavelet as follows:
for for
(1) where corresponds to the th detail decomposition level of the wavelet transform, corresponds to the time instance of the PQ event, and corresponds to a time window size that depicts the time vicinity of the PQ event.
and classification of different classes of PQ events, more wave-form signature identifiers as well as sophisticated classifiers are required. Furthermore, since wavelet subspaces require signal changes with high-frequency components, if the transition from the steady-state condition to a PQ event (specifically a voltage sag or swell) is a smooth transition, then wavelets naturally fail even to detect the event.
The ninth coefficient of the feature vector was selected ac-cording to classical spectral analysis. The signal energy was cal-culated exactly at the line frequency (50 Hz), and proportioned to the remaining spectral energy at all other frequencies, then the reciprocal of this quantity was taken. Analytically, this ex-pression can be expressed as
(2)
where is the feature vector and corresponds to its 9th el-ement, and is the power spectral density of the voltage waveform .
The remaining ten coefficients were obtained from the sta-tistical parameters of the 50-Hz notch-filtered voltage wave-forms. The low-variance Gaussian behavior of the 50 Hz-re-moved voltage waveform under normal conditions without any event is the reason for selecting higher order statistical param-eters as part of the signature identifiers in the feature vector because each PQ event can be modeled as a noise contribu-tion over the voltage waveform. In fact, in [3], it was shown that the power system voltage waveform can be modeled as a combination of a pure sinusoid and noise components im-posed upon that sinusoid. The sinusoidal component is not the informative part in terms of an event detection or classifica-tion, but its existence greatly perturbs local statistical param-eters. On the other hand, the noise component contains valuable information in case of PQ events and event-driven transients. For that purpose, during the data acquisition, the 50-Hz sinu-soid of the voltage waveform was removed using Frequency Devices’ ASC-50 programmable filter adjusted to a very sharp (20th-order Elliptic) 50-Hz notch filter. Under event-free oper-ation conditions, the output waveform of the filter can be mod-eled as Gaussian. This model is pretty accurate, because the voltage waveform may be noise-corrupted due to the ambient conditions such as electromagnetic-interference (EMI)-gener-ating loads running on or near the system and from the central limit theorem, the combination of independent random sources add up to a Gaussian process as the number of sources grows. In this specific work, in addition to the local central cumulants of order 2, 3, and 4, skewness and kurtosis were also used as statistical parameters. The Gaussian model observation justifies the use of higher order cumulants together with skewness and kurtosis which specifically provides a measure for the amount of deviation from Gaussianity. The use of such parameters also makes the classifier robust to noisy conditions since the noise is generally in the form of an additive Gaussian process.
Classical waveform noise detection methods, on the other hand, usually refer to sample means and sample variances
(cor-responding to lowest two statistical orders) of the waveform. However, higher order statistics are known to be effective tools to detect and discriminate deviations from Gaussianity [5], [6]. The mean and variance only carry information related to the “spectra,” which is only the mono-spectra. This much informa-tion may be sufficient to detect and identify Gaussian-type pro-cesses. However, complicated fluctuations cannot be visualized or differentiated in such low orders. Poly-spectra is a commonly used method to detect and identify non-Gaussian processes or phase nonlinearities [7] as is the case in this work.
Calculated local extrema of these five parameters add up to the last ten coefficients of our feature vector. Definitions of central cumulants and their relation to moments are briefly de-scribed in the Appendix. In order to better discriminate PQ event types, cumulants of order higher than 4 can also be used. How-ever, the meanings of such very high order cumulants are phys-ically and statistphys-ically unclear. Therefore, they are hard to en-counter in any application in the literature. It is reasonable to keep the parameter estimation window size a small integer mul-tiple of the fundamental period length. The selected window size of twice the fundamental period length is statistically long enough to accurately estimate statistical parameters, and short enough to accurately resolve the time localization. When using such a window size, it is not statistically meaningful to approx-imate and use cumulants of order higher than 4. Therefore, they are avoided.
Consequently, the last ten coefficients of the feature vector are formed as
The total feature vector, finally, consists of three main types of signatures. The first two types are sample values of power spec-tral density and wavelet decomposition extrema which are cal-culated using voltage waveforms. The third signature type con-sists of statistical parameters which are calculated from 50-Hz notch-filtered versions of these waveforms. The resulting fea-ture vectors are used for discriminating the event classes as follows.
1) Class 1:Arcing fault with resistive, inductive, and ASD load.
2) Class 2:Arcing fault with resistive and inductive load. 3) Class 3:Motor startup with resistive and inductive load. 4) Class 4:Motor start-up with resistive, inductive, and ASD
load.
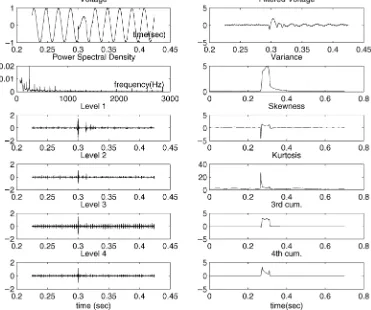
Fig. 2. Phase-to-ground arcing fault event.
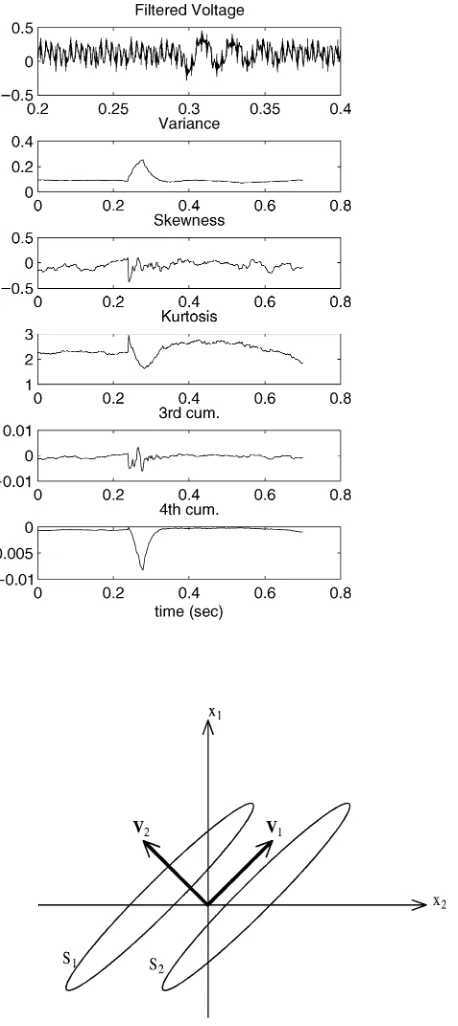
generating loads. In Fig. 2, first column depicts voltage wave-form and parameters obtained from this wavewave-form for an arcing fault event when the system is loaded with inductive and resis-tive load banks and ASDs. Similarly, the second column gives a 50-Hz notch-filtered voltage waveform for the same event and statistical parameters derived from the filtered waveform. Fig. 3 shows the waveforms and obtained feature vector parameters for a voltage sag event due to an induction motor starting.
Due to the general behavior of an energy change in the feature vector parameters, the event detection becomes mainly a thresh-olding problem. The threshthresh-olding can be carried out both along samples of wavelet decomposition, and/or samples of statistical parameters. However, thresholding should be applied to the pa-rameter(s) that shows definite change in energy at the instant of a PQ event. Notice that in Fig. 3, wavelet decomposition levels do not show any significant change in energy during the voltage sag event. The wavelet samples would normally become large if there were high-pass discontinuities incorporated to the voltage waveform during a PQ event. We purposely selected the event shown in Fig. 3 as an example for the case of a smooth transition from normal system voltage to voltage sag without any high-fre-quency transients. Therefore, wavelet decomposition levels do not show any significant change in energy. As a result, if one selects feature vector parameters composed of only wavelet de-composition level, this particular event can neither be detected nor classified. On the other hand, local statistical parameters yield variations in magnitude around regions of the voltage sag
event, indicating a strong deviation from the steady-state distri-butions and providing a tool for detection and classification.
Experimental observations show that the variance of the 50-Hz notch-filtered voltage waveform is the most robust indicator of a PQ event. Therefore, the event detection criterion was selected as thresholding the variance. The threshold is automatically determined by calculating the variance of the first ten cycles of the steady-state waveform and setting it as twice the steady-state variance.
In general, the changes in signature identifiers for the cases of arcing faults and motor startup events are visually similar. Most of the signature identifiers exhibit variations in magni-tude during a PQ event. However, in the next section, it will be shown that feature vectors combined with the common vector based classifier is capable of discriminating arcing faults from motor startup events. The possibility of such a classification arises from the fact that, the structure of the energy change in the signature identifiers are different for the two classes. Following the stage of event detection, the feature vector is generated ac-cording to the rule described above. The classifier is used only when an event is detected.
IV. PQ EVENTCLASSIFIER
covariance-Fig. 3. Motor starting event.
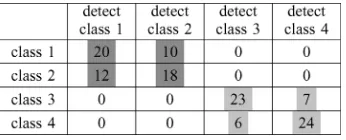
based technique which has a theoretical basis similar to the Karhunen–Loeve Transform (KLT) or the PCA. However, the derivation of the transform and its application for classification is unique. The common vector analysis suggests that, one should select eigenvectors corresponding to the zero or smallest eigen-values of covariance matrices of each class for discrimination. On the other hand, the KLT requires the selection of eigenvec-tors corresponding to the largest eigenvalues for the best (or minimum error) representation of a signal. This implies that the best representation subspace does not correspond to the best dis-criminating subspace. This situation is quite clear from a covari-ance illustration described in Fig. 4. In this figure, the principal components of the covariance scatter contours corresponding to two separate classes are along the direction of the major axis of the ellipses . However, along this direction, the separability of the two classes is very poor. Conversely, the direction of the minor axis is the correct (Fisher) choice for the separation. A single transform matrix is enough to separate classes as long as the major and minor axes of the covariance scatters are parallel for both cases. On the other hand, separate transforms are needed if the covariance scatters of classes exhibit different principle angles. In order to remedy this situation, the common vector classifier treats each class separately (within-class ap-proach). In this way, covariance matrices of each class are cal-culated, and an eigen-analysis is carried out for each class. The covariance within a class is ideally represented as , where is the expectation operator, corresponds to the class index, and corresponds to the feature vector element index. This theoretical expectation can approximated using the
Fig. 4. Covariance contours and principal components for a sample two class scatter.
for class . The common vector classifier for this class pro-ceeds as follows; First, eigenvectors and eigenvalues are evaluated from the covariance matrix. Next, the eigenvec-tors corresponding to the zero eigenvalues are taken. Practi-cally, the smallest eigenvalues among available are con-sidered. These eigenvectors are stacked into a matrix as
, and the common vector transform matrix cor-responding to class is created: . This transform matrix is applied to the mean-removed versions of the original feature vectors of class . The result of this transformation pro-duces a vector with elements close to zero if eigenvalues are
small , where
is the common vector.
Ideally, the transform vector becomes completely zero if true expectations were used. It was shown in [8] that the transform vector corresponds to the projection of the input vectors onto the zero space of the covariance scatter. The zero output situ-ation is valid as long as the input feature vector belongs to the considered event class. If the input belongs to another class, the transform operation gives a vector which is large in magnitude. Due to this property, the within-class common vector transform constitutes a distinguishing signature for the class. For the mul-tiple-class problem, common vector transforms must be con-structed for each class of training data, and the feature vector, which is considered for classification, should be applied to each of these common vector transforms corresponding to different classes. Each transform gives a separate output vector. The clas-sification rule selects the vector with the smallest magnitude, and assigns the vector to the class corresponding to this situ-ation. This is a novel approach which was recently applied to speech and face recognition [9], [10]. Due to the analysis made in [8], it is known that the common vector approach yields the optimum discrimination space from the covariance of the input data. This fact is also justified by our experimental results.
In this study, four different transforms were obtained corre-sponding to feature vectors derived from the four considered PQ events explained in Section III. The first two cases correspond to the PQ event type of arcing faults, and the last two cases cor-respond to PQ event type of motor startup events. For different load conditions, even for the same class of event, separate fea-ture vectors were obtained in order to monitor the classification performance of the selected signature identifiers and classifier combination. The experimental results for the classification of the two fundamental PQ event types, as well as results for the resolution of load conditions are presented in Section V.
A particularly useful aspect of the common vector approach is that it also provides a usefulness measure for each signature identifier used in the feature vector. As seen from the above explanations, the ideal transform output in case of a correct class should correspond to a zero vector. Conversely, if an incorrect class transform is used, the output should be a vector large in magnitude. Experimentally, it was observed that some of the signature identifiers satisfy this property better than others. In order to reduce the set of parameters used for the feature vector construction, the elements of the eigenvectors were analyzed. Consequently, the more useful signature identifiers were kept and the rest were discarded in the common vector transform matrix construction. The results for parameter space reduction is presented in Section V-A.
V. EXPERIMENTALCLASSIFICATIONRESULTS
The voltage waveform data is acquired during PQ events cor-responding to arcing faults and motor startup events with dif-ferent loading conditions, as described in Section III. For both arcing faults and motor starting events, a total of 60 experiments were carried out with inductive and resistive load conditions; 30 of them for arcing faults, 30 of them for motor startup events. Next, ASDs are also connected and 30 set of experiments were carried out for both arcing faults and induction motor startup events. The detection of the events was obtained by monitoring the change in local variance, and comparing it with a threshold which was set according to the steady state variance measured from the first ten cycles of the voltage waveform. All of the ex-perimentally generated events in this work were successfully de-tected using this method.
Once an event is detected, wavelet extrema, spectral harmonic ratio, and HOS parameter extrema are calculated within the local time window corresponding to the detected event location to form a 19-dimensional feature vector. Consequently, a total of 120 feature vectors were ensembled corresponding to four dif-ferent classes for the experimental studies. In this section, we present results for
1) fundamental PQ event-type classification that separates the first two classes from the last two, namely discriminating arcing faults from induction motor starting events; and 2) separation of the four classes which implies a method to
identify loading conditions.
Due to the structure of the common vector classifier, a projection operator (consisting of a transform matrix and a common mean vector) is constructed separately for each of the four classes using available training data. The classification performance obtained by using the training data as the test data would not be a fair indication about the success of the method. In order to efficiently use the restricted number of experimental data, the celebrated leave-one-out technique is used. In this technique, for each acquired data, one of the calculated feature vectors belonging to class is taken as the test data, and the rest of the feature vectors (29 out of a total of 30) from class constitutes the training data. Using this training data, a projection operator is constructed for class . For the other three classes, all of the data is used as the training data, and three more projection operators are constructed. Next, the test data is projected using the four projection operators, and the test data is classified to a class whose projection operation gives the minimum norm projection vector. This operation is carried out for each of the experimental data belonging to any of the four classes. In each case, one of the class projections is determined using 29 elements while the other class projections are determined using 30 elements. This is, effectively, a method to obtain 120 test data and 120 training data out of a total of 120 elements.
TABLE I
CLASSIFICATIONRESULTS FOR4-CLASSEXPERIMENTS. DARK-SHADEDBOXES
BELONG TO THECLASS OFARCINGFAULTS, LIGHT-SHADEDBOXESBELONG TO THECLASS OFMOTORSTARTUPS
conditions can be separated with an accuracy of 70%. When ASDs are connected to the experimental system as a part of the load, they draw current with high harmonic content. This cur-rent, therefore, causes high harmonic voltage distortions that ef-fects the signature identifiers associated with spectral content of the voltage waveform. In this work, real-life data are used and the magnitude, duration, and harmonic content of each event is effected by the load composition. For some of the staged events, the effect of the ASD portion of the load may be more pro-nounced, enabling us to discriminate experimental system load. Although the effects caused by different load configurations are quite small as compared to the waveform distortions due to PQ events, our classifier managed to discriminate load conditions of 70% of staged events.
Alternative classification results were also obtained using two popular classifiers; the support vector machines (SVMs) and Bayesian classifiers using the same training and test data. In the SVM method, the Gaussian kernel method was used. It was observed that 100% classification success rate could be achieved using at least seven support vectors to distinguish arcing faults and voltage sags due to motor starting events. Using the Bayesian classifiers, the classification success rate was found to be 97%. Apparently, the classification perfor-mance of SVM is the same as the method proposed here. However, as explained and illustrated in the succeeding sub-section, the the proposed CVC method has a major advantage of not only yielding successful classification results, but also providing information about the usefullness of each of the parameters in the feature vector. The information about such a usefulness measure gives insight about the descriptive features of the voltage waveform signature. In this way, non or poorly descriptive features and computations to generate them can be avoided. Furthermore, the computational complexity of the CVC is less than that of similarly performing methods including SVM.
A. Feature Accuracy Analysis
The selection of feature vector elements as described in Sec-tion III is well justified with the above experimental results. However, the CVC classifier and its construction from the eigen-vectors of the covariance matrices are also capable of giving
1) the amount of dimensionality reduction;
2) hints about which elements among the 19-dimensional fea-ture vector are more meaningful and useful in the discrim-ination process.
In this subsection, the dimensionality reduction from the co-variance data is described and selection of the eigenvectors for
Fig. 5. Eigenvalue magnitudes obtained from covariance matrices.
transform matrix construction is explained. During the construc-tion of transform matrices, the eigenvectors of the covariance matrices corresponding to the zero or small eigenvalues must be selected. On the other hand, selection of the number of small eigenvalues is not deterministic. It is usually a good idea to vi-sualize the eigenvalues corresponding to covariances matrices belonging to two PQ event types. In Fig. 5, the eigenvalues ob-tained from the covariance matrices belonging to two PQ event types are plotted. The figure implies selecting 10 of the 19 eigen-values as small. Therefore, the experiments are carried out using transform matrices obtained from eigenvectors corresponding to 10 of the smallest eigenvalues. In fact, selection of number of zero eigenvalues other than 10 gave experimentally inferior classification accuracy.
The second analysis described in this subsection is about the usefulness of the elements inside the 19-dimensional feature vector. This analysis can be carried out in two ways.
1) The smaller magnitudes of signature identifiers along a di-mension for selected eigenvectors mean that the considered dimension contributes less to the discriminant.
2) The larger magnitudes of signature identifiers along a di-mension for unselected eigenvectors mean that the consid-ered dimension is irrelevant to the discriminant.
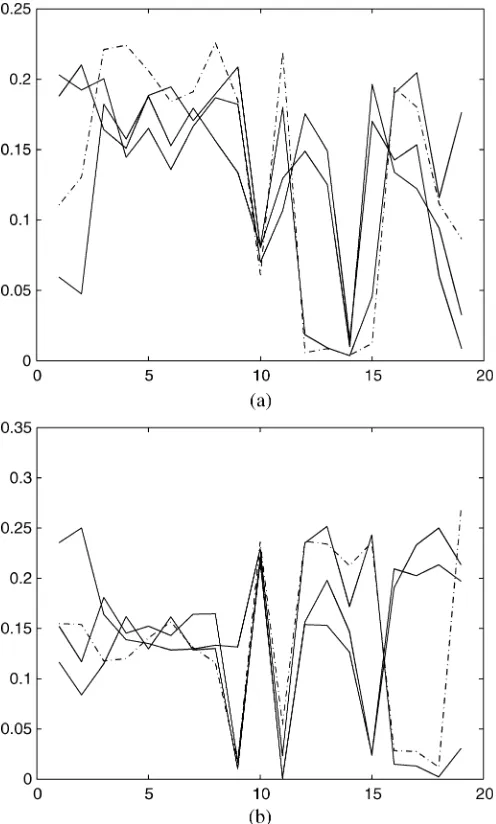
Fig. 6. Dimension element magnitudes for (a) selected, and (b) unselected eigenvectors.
implies that eigenvector elements with more significant eigen-values (as suggested by PCA) are more robust for the detection or representation of the existence of a PQ event. Conversely, such elements are not useful for discriminating the PQ event types. Nevertheless, since this is a parameter specifically used for detection, it is included in the list of “to be used elements.” According to these observations, the set of elements for the fea-ture vector is reduced to the elements 9-to-11 and 15-to-18. These elements correspond to spectral harmonic energy propor-tion and HOS parameters. It is noteworthy to observe that the wavelet coefficients are not significantly relevant in the discrim-ination.
After skimming the feature vector to seven dimensions, the CVC analysis was carried out once again. The general result is, the PQ event-type classification is still 100% accurate. However, the separation between different loading conditions had deterio-rated. Normally, separation of loading conditions is not critical in PQ event classification; therefore, the general use of spec-tral harmonics and HOS parameters seem to be perfectly
suf-TABLE II
CLASSIFICATIONRESULTS FORFOUR-CLASSEXPERIMENTSUSINGSEVEN
PARAMETERSFROM THEORIGINALFEATUREVECTORS. DARK-SHADED
BOXESBELONG TO THECLASS OFARCINGFAULTS, LIGHT-SHADEDBOXES
BELONG TO THECLASS OFMOTORSTARTUPS
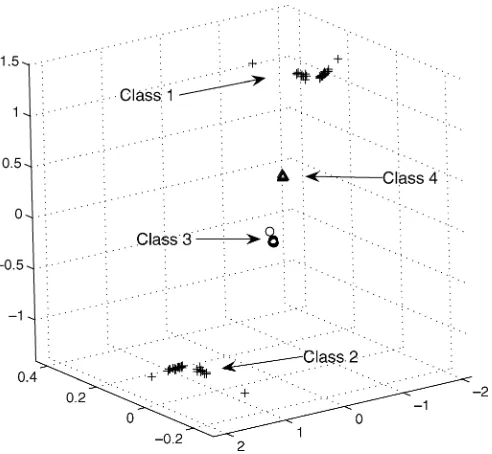
Fig. 7. Scatter plots of data projected to the operators of Class 1.
ficient. As a result, the selected and unselected feature vector elements propose that the more critical parameters are “spec-tral harmonics,” “2nd, 3rd, 4th cen“spec-tral cumulant extrema,” and “skewness maxima.” The relatively unimportant parameters are found as “all of the four wavelet transform extrema,” “skew-ness minima,” and “kurtosis extrema.” The classification results using the reduced feature vector are shown in Table II.
Fig. 8. Scatter plots of data projected to operators of Class 4.
from other classes are again farther away from the centroid of Class 4. Since the projection operator in Fig. 7 is obtained from arcing fault-type event data, the projected data exhibit a sparse behavior. Although Class 3 and 4 belong to a PQ event type that is different from Class 1 and 2, several projection points from Class 3 and 4 are closer to Class 1 than points from Class 2. On the other hand, it can be seen that along the single dimen-sion corresponding to the first projection vector element, there is a well-defined separation. In fact, the Fisher projection along the first dimension is sufficient to make Classes 1 and 2 come nearer, and Classes 3 and 4 remain far from them along both directions. The projection operator in Fig. 8 is obtained from a more uniformly behaving data of motor startup events. As a re-sult, the scatter plots of Classes 3 and 4 are more compact, and closer to each other in three dimensions. Similar to the previous case, a one-dimensional (1-D) Fisher axis is visible along which the separation is still possible.
VI. CONCLUSION
In this paper, a method of PQ event classification using a novel covariance-based method; the CVA is described. Prior to the covariance analysis, a feature set consisting of wavelet decomposition extrema across four levels, power spectral har-monic ratio, and higher order statistical parameter extrema cor-responding to orders 2, 3, and 4 is constructed. The event de-tection is based on the variance value, which is actually the second-order central cumulant. Once an event is detected, other extrema are also recorded to form a feature vector consisting of 19 elements. This feature vector can be considered as a signa-ture of the event. A training set of 60 elements from arcing fault events and 60 elements from motor starting events is acquired. Using feature vectors obtained from these events, covariance matrices corresponding to different event types are constructed. The CVA provides us with projection operators for each class type. Classification is done by applying each projection to the
data, and selecting the minimum normed output. The “leave one out” technique is used to separate the test and training sets. Ex-perimental results imply that the classification accuracy is 100% between our set of arcing faults and motor startup events. An interesting observation is that the event driven feature vectors carry discriminative information for loading conditions up to a rate of 70%. The CVA also enables us to argue about which of the feature vector elements are more relevant for discrimi-nation. According to the analysis in Section V-A, higher-order central cumulant parameter extrema and spectral harmonic in-formation are found to be more relevant for the classification than the wavelet tranform extrema. It is clear that some types of PQ events may not be detected using the proposed feature vector and the classifier. The proposed event detection hence, the clas-sification, depends on the change in the behavior of the voltage waveform by monitoring the variance. Therefore, if the event is an ongoing flicker or an inherent harmonic from the beginning of the monitoring process, no change in variance will be de-tected and the system will fail. Other transient-type events, such as voltage swell, would require different training of the classi-fier with probably different set of feature vectors. The overall re-sults indicate that the CVA is a promising tool for classification of various types of data. It can also be deduced that construc-tion of the feature vector by selecting parameters using signal processing techniques constitutes an important aspect of the PQ event detection and classification from voltage waveform.
APPENDIX
MOMENTS ANDCUMULANTS
Before proceeding with the experimental results, a minimal amount of theoretical background about general concepts of moments and cumulants is provided [7]. The definition of the
order moment of a single random variable, is given as
(4)
where corresponds to the characteristic
function, and denotes the expectation operation. For
ex-ample, the first two moments are ,
and . Using the
logarithmic form of the characteristic form, we get the second characteristic function
(5)
The cumulants (which are basically used in this work) are de-fined in terms of the second characteristic function
(6)
which correspond to the coefficients of the Taylor expansion of the second characteristic function. There is a relation between the moment and cumulant values that can be derived using the Taylor expansion of the logarithm. For the first four orders, let us define the moments as , , , and . One can obtain
, and . The relation between cumulants and moments of orders higher than four become more complicated. The Skewness and Kurtosis values are determined from the central cumulants as
(7)
In practice, these values can be evaluated using sample data as
and
REFERENCES
[1] R. Wael, A. Ibrahim, and M. M. Morcos, “Artificial intelligence and advanced mathematical tools for power quality applications: A survey,”
IEEE Trans. Power Del., vol. 17, no. 2, pp. 668–673, Apr. 2002. [2] M. Wang and A. V. Mamishev, “Classification of power quality events
using optimal time-frequency representations-part 1: Theory,”IEEE Trans. Power Del., vol. 19, no. 3, pp. 1496–1503, Jul. 2004. [3] H.-T. Yang and C.-C. Liao, “A de-noising scheme for enhancing
wavelet-based power quality monitoring system,”IEEE Trans. Power Del., vol. 19, no. 1, pp. 353–360, Jan. 2004.
[4] A. M. Youssef, T. K. Abdel-Galil, E. F. El-Saadany, and M. M. A. Salama, “Disturbance classification utilizing dynamic time warping classifier,”IEEE Trans. Power Del., vol. 16, no. 3, pp. 272–278, Jul. 2001.
[5] M. J. Hinich, “Testing for gaussianity and linearity of a stationary time series,”J. Time Series Anal., vol. 3, pp. 169–176, 1963.
[6] D. R. Iskander and A. M. Zoubir, “Testing gaussianity using higher order statistics: he small sample case,” inProc. IEEE Workshop on Higher Order Statistics, Begur, Spain, Jun. 1995, pp. 191–195. [7] C. L. Nikias and A. P. Petropulu, Higher-Order Spectra Analysis:
A Nonlinear Signal Processing Framework. Englewood Cliffs, NJ: Prentice-Hall, 1993.
[8] M. B. Gülmezoglu, V. Dzhafarov, and A. Barkana, “The common vector approach and its relation to principal component analysis,”
IEEE Trans. Speech Audio Process., vol. 7, no. 6, pp. 655–662, 2001. [9] M. B. Gülmezoglu, M. Keskin, V. Dzhafarov, and A. Barkana, “A
novel approach to isolated word recognition,” IEEE Trans. Speech Audio Process., vol. 7, no. 6, pp. 620–628, Nov. 1999.
[10] H. Çevikalp, M. Neamtu, M. Wilkes, and A. Barkana, “Discrimina-tive common vectors for face recognition,”IEEE Trans. Pattern Anal. Mach. Intell., vol. 27, no. 1, pp. 4–13, Jan. 2005.
[11] C. W. Therrien, Decisiton, Estimation, and Classification. New York: Wiley, 1989, p. 95.
[12] L. Angrisani, P. Daponte, and M. D’Apuzo, “Wavelet network-based detection and classification of transients,”IEEE Trans. Instrum. Meas., vol. 50, no. 5, pp. 1425–1435, Oct. 2001.
[13] S. Santaso, W. M. Grady, and E. J. Powers, “Characterization of dis-tribution power quality events with Fourier and wavelet transforms,”
IEEE Trans. Power Del., vol. 15, no. 1, pp. 247–254, Jan. 2000. [14] A. M. Gaouda, M. M. A. Salama, M. R. Sultan, and A. Y. Chikhani,
“Power quality detection and classification using wavelet-multiresolu-tion signal decomposiwavelet-multiresolu-tion,”IEEE Trans. Power Del., vol. 14, no. 4, pp. 1469–1476, Oct. 1999.
[15] S. J. Huang and C. T. Hsieh, “High impedance fault detection utilizing a morlet wavelet transform approach,”IEEE Trans. Power Del., vol. 14, no. 4, pp. 1427–1435, Oct. 1999.
[16] T. Zheng, E. B. Makram, and A. A. Girgis, “Power system transient and harmonic studies using wavelet transform,”IEEE Trans. Power Del., vol. 14, no. 4, pp. 1461–1468, Oct. 1999.
[17] T. B. Littler and D. J. Morrow, “Wavelets for the analysis and compres-sion of power system disturbances,”IEEE Trans. Power Del., vol. 14, no. 2, pp. 358–364, Apr. 1999.
Ömer Nezih Gerekwas born in Eskisehir, Turkey, in 1969. He received the Engineer, M.Sc., and Ph.D. de-grees in electrical engineering from the Bilkent Uni-versity, Ankara, Turkey, in 1991, 1993, and 1998, re-spectively.
He spent one year as a Research Associate at EPFL, Lausanne, Switzerland. Currently he is a Professor with the Electrical and Electronics Engi-neering Department, Anadolu University, Eskisehir. His research areas include signal analysis, signal compression, wavelets, and sub-band decomposi-tion.
Do˘gan Gökhan Ecewas born in Ankara, Turkey, in 1964. He received the Engineer degree from Istanbul Technical University, Istanbul, Turkey, in 1986 and the M.Sc. and Ph.D. degrees in electrical engineering from Vanderbilt University, Nashville, TN, in 1990 and 1993, respectively.
Currently, he is Professor with the Electrical and Electronics Engineering Department, Anadolu Uni-versity, Eskisehir, Turkey. His research areas include power quality, fault detection, and modeling.
Atalay Barkanareceived the B.S. degree in elec-trical engineering from Robert College, Istanbul, Turkey, in 1969, and the M.S. and Ph.D. degrees in electrical engineering from the University of Virginia, Charlottesville, in 1971 and 1974, respec-tively.