DOI: 10.12928/TELKOMNIKA.v13i4.3105 1179
Power Characteristics of Wireless Charging for Sensor
Networks in Tunnels
Xiaoming Liu1,2,3,4, Enjie Ding1,2,3,4*, Duan Zhao1,2,3,4, Youfang Yang1,2,3,4
1
School of Information and Electrical Engineering, China University of Mining and Technology, Xuzhou, Jiangsu, China
2
IOT Perception Mine Research Center,China University of Mining and Technology, Xuzhou, Jiangsu, China.
3
State and Local Joint Engineering Laboratory of Mining Internet Application Technology, Xuzhou, Jiangsu, China
4
Jiangsu Engineering Laboratory of Perception Mine Research Center, Xuzhou, Jiangsu, China. e-mail: [email protected]
Abstract
In order to generate wireless microwave power charging technology in coal mine tunnels, it is necessary to know the power characteristics of wireless electromagnetic wave along the tunnel walls. In this paper, the experimental results of narrowband wireless electromagnetic wave propagation measurements are presented, and a statistical model of the power characteristics at 2.4 GHz in real rectangular mine tunnels is proposed. Two standard half-wave dipole antennas were used to perform the field experiments in tunnels with different wall materials. A 10-meter wireless charging distance belongs to the free-space propagation zone. The path loss exponents rely heavily on the location of the receiver and antenna polarizations. To obtain more power, the locations of the receiver should match the corresponding polarizations.
Keywords: Wireless Charging, Power Characteristic, Tunnel, Sensor Networks
Copyright © 2015 Universitas Ahmad Dahlan. All rights reserved.
1. Introduction
The Wireless Sensor Network (WSN) plays a significant role in mine safety production. Conventional battery power for the WSN affects its stable operation time. The research progress of microwave power transfer [1-4] allows the battery to be charged using microwave wireless charging technology, thus prolonging the life cycle of the WSN. In order to determine wave transfer efficiency between the sending and receiving devices, the characteristics of wave propagation in mine tunnels must be studied.
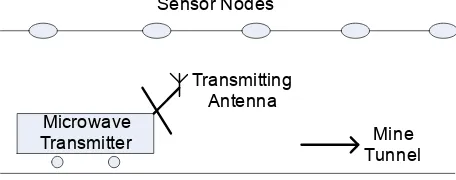
However, most of these studies focused on the propagation characteristics of electromagnetic (EM) waves along the tunnel. In actual underground mine tunnels, sensors are usually arranged on both the sides and the top of the tunnel walls (as locations A, B and C shown in Figure 1), which formed zonal distribution characteristics of sensor nodes in tunnels. The power transmitter is placed in the middle of the tunnel (location O in Figure 1); therefore, we need to determine the EM propagation characteristics along the tunnel walls in the near region. To date, the EM propagation characteristics along the rectangular tunnel walls at a short distance have been poorly mentioned and not studied in detail.
The measurement-based characterization of underground mines provides realistic results that are of immediate use to designers and developers and has therefore attracted increasing attention in the last decade. This paper describes the results of a measurement campaign that was performed at frequencies of 2.4 GHz in a real rectangular small-scale mine tunnel.
2. Wireless Charging System for Sensor Networks
In the actual coal mine tunnel, sensor nodes are arranged on tunnel walls orderly (as shown in Figure 1-a), which present zonal distribution. In order to wirelessly charge the sensor nodes, a microwave transmitter device (as shown in Figure 1-b) should be developed to supply the RF (radio frequency) energy. The whole charging scheme is shown in Figure 2.
(a) Sensor node in the tunnel (b) Microwave transmitter
Figure 1. Sensor node and microwave transmitter in the tunnel
Microwave Transmitter
Sensor Nodes
Mine Tunnel Transmitting
Antenna
Figure 2. Microwave wireless charging scheme in mine tunnel
and the sensor nodes. Thus to analyze the power transmission efficiency and further theoretical basis for the device design is provided.
3. Description of the Measurements 3.1. The Underground Mining Environment
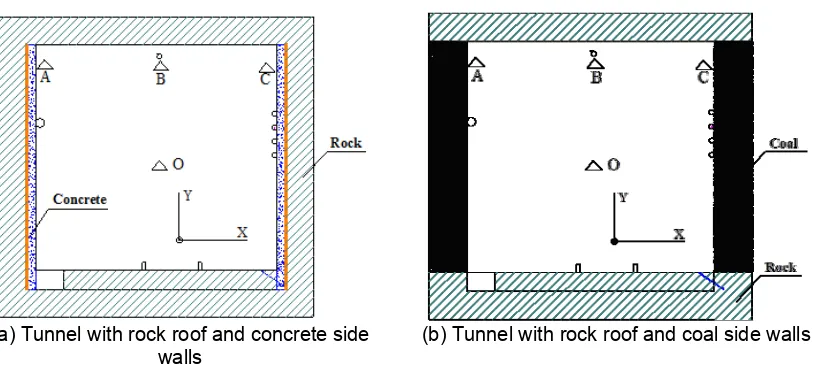
Two typical rectangular tunnels in the JinDa Mine, located in the city of Teng Zhou, Shandong Province, were chosen for the experiments. The tunnels in the experiments have different dimensions and wall materials. The width, height and wall materials of each tunnel are shown in Table 1.
(a) Tunnel with rock roof and concrete side walls
(b) Tunnel with rock roof and coal side walls
Figure 3. Cross section of the tunnel
Table 1. Information of the tunnels adopted in experiments
Width(m) Height(m) Roof Material Side-wall Material Experiment 1 2.6 2.2 rock concrete Experiment 2 3.5 2.4 rock coal
As shown in Figure 3, the tunnel section is rectangular. The thickness of the concrete at the tunnel lining is approximately 10 cm, and that on the tunnel floor is approximately 25 cm. Outside of the tunnel is rock material. The iron wire entanglements are placed between the concrete and the sand rock with the distribution of square grid (orange line shown in Figure 2), where the diameter of the iron wire is 0.2 mm and the width of the square grid is 10 cm. Some tunnels use rock for the roof and floor, while others use coal as side walls.
3.2. Experimental System
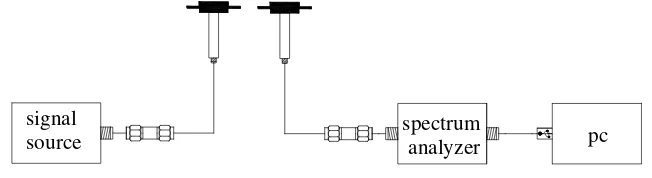
Two standard half-wave dipole antennas operating at 2.4 GHz were used in these experiments. As shown in Figure 3, the transmitting antenna was placed in the tunnel center (marked as O). When the antenna is located in the center of the tunnel, the insertion loss is least. The transmitting antenna was connected to the microwave signal source (R&S-SMB100A) by a 2-m-long low-loss RF cable (goreXN3449, 0.4 dB/m at 2.4 GHz). The output power of the signal source was set to 16 dBm. The receiving antenna was placed at three locations A, B and C, where the sensors were usually laid out. The receiving antenna was connected to a spectrum analyzer (GSP-830E) by a 5-m-long cable (goreXN3449), and a PC was also connected to the spectrum analyzer to record the data. Multi-path effects existed in the tunnel, and the signals changed dramatically during the experiments. In order to conveniently record the data, we set the spectrum analyzer to show the test data averaged over 20 times. The whole test system is shown in Figure 4.
Figure 4. The whole test system
The receiving antenna was arranged at three locations A, B and C, as shown in the Figure 3. At the beginning of the test, the receiving antenna and transmitting antenna were on the same cross section. The transmitting antenna was moved along the tunnel axis. The data were recorded every 0.2 m, and the total tested distance was 10 m. Power at locations A, Band C was measured under X, Y and Z antenna polarizations. Each location obtained three sets of data, totaling nine sets.
4. Results and Analysis
Several measurement campaigns have been conducted as discussed above. Prior to describing the experimental results, the coordinate system of a typical tunnel complex was defined for reference in the subsequent data analysis. The Z axis is defined as the longitudinal direction of the tunnel, the X axis as the width, and the Y axis as the height. The coordinate origin is defined in the tunnel floor center. The initial Z coordinates of the transmitting antenna was set to 0 in every experiment. The experimental results are discussed under three conditions as follows.
4.1. Power Characteristics in the Tunnel with Rock Roof and Concrete Side Walls
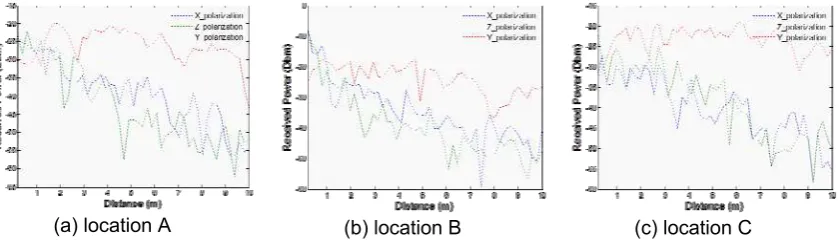
Figure 5 illustrates the received power of locations A, B and C under three polarization conditions. Studies [8] and [13] present a complete multimode-waveguide model to calculate the received power at any location in a tunnel, while the real results in the rectangular tunnel are not consistent with the simulation results based on the multimode-waveguide model. In studies [15] and [16], an adjacent region of the transmitter was named the free-space propagation zone, where the loss follows the free-space model. In comparison, the model described in [16] is more precise and can be represented as
0
path loss on distance d. d0 is the reference distance, which is set to the initial distance when
signal
sending and receiving devices are in the same cross section at the beginning of the experiment. PLdB(d0) is the received power at the reference distance d0. n is the path loss exponent, and σ is
a zero-mean Gaussian distributed random variable in dB, whose value ranges from 0.3 to 3. Figure 6 shows the fitting curves of the measured data of experiment 1. In the actual wireless charging application, the average power over a 10-meter distance is our concern. Thus, the value of Xσ is ignored. The path loss exponents n at three locations A, B and C under
three polarization modes are shown in Table 2.
(a) location A (b) location B (c) location C
Figure 5. Received power at three locations and under three antenna polarizations
(a) location A (b) location B (c) location C
Figure 6. Fitted curve of the received power at three locations and under three antenna polarizations
Table 2. Summary of path loss exponents n at three locations and under three polarizations
X Polarization Z Polarization Y Polarization A -1.31 -1.577 -0.3143 B -1.279 -1.434 -0.2618 C -0.9488 -1.323 0.3138
As shown in Figures 5 and 6, at location A, the condition of Y polarization has not only the highest received power, but also the smallest attenuation, with a path loss exponent n=-0.3143. The conditions of X and Z polarization are similar, but the path loss exponent |n| of Z polarization is slightly larger than that of X polarization. Thus, the received power under Z polarization will decrease compared to that under X polarization with increasing distance. In total, the condition of Y polarization is far better than the other polarizations.
At the location B, the conditions of X and Z polarization are similar at a short distance. Because the PLdB(d0) of X polarization is larger than that of Z polarization, and |n| of X
polarization is slightly smaller, the condition of X polarization is slightly superior to Z polarization. In addition, Y polarization is optimal after 2 m.
gradual when the value |n| is small. During the initial phase, the receiving power of Z polarization is higher, but with increasing distance, the power is much lower than that of Y polarization.
Comparing the symmetrical locations A and C, the attenuation trends of X and Z polarizations are similar. For the Y polarizations, the calculated powers are comparable. In addition, their path loss exponents |n| are close, but the different PLdB(d0) result in the different
signs of n. In summary, for locations A and C, Y polarization is optimal. However, for location B, X polarization outperforms others before approximately 2 m, and Y polarization is still optimal after approximately 2 m.
4.2. Power Characteristics in the Tunnel with Rock Roof and Coal Side Walls
The location of experiment 2 is a segment of a straight tunnel with a greater width and coal side walls. Figures 7 and 8 show the measured curves and the corresponding fitting curves, respectively. The parameters that were used in the curve-fitting are illustrated in Table 3.
(a) location A (b) location B (c) location B
Figure 7. Received power at three locations and under three antenna polarizations
(a) location A (b) location B (c) location B
Figure 8. Fitted curve of the received power at three locations and under three antenna polarizations
Table 3. Summary of path loss exponents n at three locations and under three polarizations
X Polarization Z Polarization Y Polarization
A -1.104 -1.225 1.3
B -1.392 -1.74 -0.1012
C -0.627 -2.245 0.9475
those of X and Z polarizations. The initial received power under Y polarization is far below the values of X and Z polarizations, and the path loss exponent n is plus 1.3. Under Y polarization, with increasing distance, the received power does not decay but gradually rises. The received power of Y polarization surpasses the values of X and Z polarizations at a distance of approximately 3 m and exceeds the initial values of three polarizations at a distance of approximately 6 m.
At location B, the path loss exponents n of Y polarization are close to 0, and the changes along the distance are relatively stable. The initial received power under Y polarization is smaller than that under X and Z polarizations. The conditions of X and Z polarizations are similar; they have close initial received powers, but the absolute value of n of X polarization is slightly less than that of Z polarization. Hence, the results of X polarization are better than the results of Z polarization within 10 m. The curves of X polarization and Y polarization intersect at a distance of approximately 2 meters.
The conditions at the location C are similar to those at location A. However, the initial received power under Y polarization is slightly larger; thus, the path loss exponent n is lower than that at location A. Meanwhile, the initial received power and the path loss exponent of X polarization decrease. The curves of the three polarizations intersect at a distance of approximately 3 m.
Comparing locations A and C, the measurement results are similar. The difference between these results is that the initial received powers under three types of polarizations are different. Overall, X polarization could obtain larger received powers when the distance is less than 3 m, but when the distance is far from that, the conditions of Y polarization are optimal.
Comparing Experiments 1 and 2, we find that the tunnel size and wall material have little influence on the path loss exponent. The absolute values of n obtained in curve fittings are approximately 1, which are far less than the free space path loss (n = 2). Values of PLdB(d0) vary
greatly. The reasons are estimated for the cables, testers and some other uncertain factors.
5. Conclusion
In this paper, we explore the power model of wave propagation between the sending and receiving devices in mine tunnels. The experiments were performed in two rectangular tunnels with different wall materials. The transmitting antenna was placed in the middle of the tunnel and the receiving antenna was placed on the tunnel walls. We measured the received power under three polarizations X, Y and Z in different tunnels. The results show that the path loss follows the free-space model. In all tunnels, antennas working on X or Z polarization can gain more power over short distances, but Y polarization is optimal after approximately 2 m. In addition, under Y polarization, with the increased distance, the received powers sometimes do not decay but gradually increase. The tunnel size and wall materials have little influence on the path loss exponent. Cables, testers and some other uncertain factors impact the PLdB(d0)
greatly.
References
[1] Ishjkawa R, Honjo K. Efficient supply power control by PWM technique for microwave wireless power transfer systems. Sendai, Japan. 2014; 1101-1103.
[2] Nako S, Okuda K, Miyashiro K, Komurasaki K, Koizumi H. Wireless Power Transfer to a Microaerial Vehicle with a Microwave Active Phased Array. International Journal of Antennas and Propagation. 2014; 2014: 1-5.
[3] Enjie D, Hui X, Zhifeng S, Duan Z. Modeling and analysis of wireless charging system based on magnetic coupling resonance. Journal of China University of Mining & Technology. 2014; (05): 927-932.
[4] Yoshida S, Noji T, Fukuda G, Kobayashi Y, Kawasaki S. Experimental Demonstration of Coexistence of Microwave Wireless Communication and Power Transfer Technologies for Battery-Free Sensor Network Systems. International Journal of Antennas and Propagation. 2013; 2013: 1-10.
[5] Boutin M, Benzakour A, Despins CL, Affes S. Radio Wave Characterization and Modeling in Underground Mine Tunnels. IEEE Transactions on Antennas and Propagation. 2008; 56(2): 540-549. [6] Duan Z, Enjie D, Xin W. 2.4 GHz Radio Wave Propagation Characteristics in Coal Mine Workface
Tunnels. TELKOMNIKA Indonesian Journal of Electrical Engineering. 2014; 12(10): 7299-7303. [7] Mahmoud NAL. Fuzzy Logic PSS Assisted by Neighboring Signals to Mitigate the Electromechanical
2015; 14(3): 363-375.
[8] Zhi S, Akyildiz IF. Channel modeling and analysis for wireless networks in underground mines and road tunnels. Communications, IEEE Transactions on. 2010; 58(6): 1758-1768.
[9] Ruisi H, Zhangdui Z, BO A, Ke G, Binghao C, Jose IA, Cesar B. Propagation channel measurements and analysis at 2.4 GHz in subway tunnels. Microwaves, Antennas & Propagation, IET. 2013; 7(11): 934-941.
[10] Zhang YP, Hwang Y. Characterization of UHF radio propagation channels in tunnel environments for microcellular and personal communications. Vehicular Technology, IEEE Transactions on. 1998; 47(1): 283-296.
[11] Nerguizian C, Despins CL, Affes S, Djadel M. Radio-channel characterization of an underground mine at 2.4 GHz. IEEE Transactions on Wireless Communications. 2005; 4(5): 2441-2453.
[12] Rizzo C, Lera F, Villarroel JL. Transversal fading analysis in straight tunnels at 2.4 GHz.2013 13th International Conference on ITS Telecommunications (ITST), Tampere. 2013: 313-318.
[13] Yu H, Xu Z, Fengxue L, Zhao X. Angular Power Distribution of Wireless Channel in Mine Tunnels.
TELKOMNIKA: Indonesian Journal of Electrical Engineering. 2013; 11: 1422-1435.
[14] Jiping S, Lingfei C, Changsen Z. Influence of conductivity on radio waves propagation in tunnels.
Journal of Liaoning Technical University. 2007; 26: 96-98.
[15] Rissafi Y, Talbi L, Ghaddar M. Experimental Characterization of an UWB Propagation Channel in Underground Mines. IEEE Transactions on Antennas and Propagation. 2012; 60(1): 240-246.