Optimal water intake for the elderly: prevention of hypotremia
P. Siregar1, E. Susalit1, R. Wirawan2, S. Setiati1, Sarwono W.1 1 Department of Internal Medicine, Medical Faculty, University of Indonesia 2 Department of Clinical Pathology, Medical Faculty, University of Indonesia
Abstrak
Tujuan Kekerapan hiponatremia pada usia lanjut cukup tinggi disebabkan adanya peningkatan kadar ADH, dan ANP
yang merupakan bagian dari 8 perubahan isiologi. Komplikasi yang ditimbulkan cukup spesiik yaitu meningkatnya risiko patah tulang, penurunan kesadaran hingga kejang-kejang. Penyebab tersering hiponatremia pada usia lanjut adalah asupan air yang tinggi. Mendapatkan asupan air optimal yaitu volume asupan air tertinggi yang tidak menimbulkan hiponatremia dan hipovolemia.
Metode Dilakukan penelitian pada 31 orang usia lanjut sehat setelah melalui pemilihan dari 107 usia lanjut secara
simple random sampling dan kriteria eksklusi. Kemudian dibagi secara Randomisasi Blok dalam 5 kelompok asupan air (1000-2500 mL).
Hasil Dapat dibuktikan bahwa 1000 mL merupakan asupan air optimal pada usia lanjut sehat. Diperlihatkan juga bahwa kadar ADH plasma memiliki gambaran hubungan dengan volume asupan air yang tidak menimbulkan hiponatremia
dan kadar NT-proBNP tidak berkorelasi dengan kadar natrium urin sewaktu. (Med J Indones 2009; 18: 18-25) Kesimpulan Asupan air optimal pada usia lanjut adalah 1000 mL/24 jam.
Abstract
Aim The prevalence of hyponatremia in the elderly is quite high due to the rising of ADH and ANP concentrations
which are part of eight physiologic changes. The complications are quite speciic, among others, increased risk of bone fracture, declining of conciousness, and convulsion. The frequent cause of hyponatremia is high water intake. To achieve the optimal water intake designated as the highest water intake that did not cause hyponatremia and
hypovolemia.
Methods A study was conducted on 31 healthy elderly subjects, selected from 107 persons using simple random
sampling and exclusion criteria. By block randomisation were classiied into ive water-intake groups (1000-2500
mL).
Results In this study, it could be proved that 1000 mL was the optimal. It was also unraveled that the ADH levels had
a role in determining the water intake volume that did not cause hyponatremia and NT-proBNP concentrations did
not correlate with spot urine sodium.
Conclusion The optimal water intake for the elderly is 1000 mL per day (Med J Indones 2009; 18: 18-25)
Keywords: Hyponatremia, healthy elderly, water intake
Water and electrolyte imbalances are frequently encountered in elderly people. This condition is attributed to various changes that occur at the late age such as declined total body water volume, reduced glomerular
iltration rate, reduced ability to produce hyperosmotic
urine, increased ADH (anti diuretic hormone) and ANP (atrial natriuretic peptide) concentration, declined
aldosteron concentration, reduced sensitiveness of the thirst central in central nervous system, and reduced free water clearance.1 Those changes lead to water retention and increased natrium excretion in urine
that will easily cause hyponatremia. If not properly corrected, this condition will induce cerebral edema which, if it persists, will cause permanent damage to the brain. The cerebral tissue damage will be accelerated, if hyponatremia is accompanied by hypoxia.2,3 Chronic
mild hyponatremia, in fact, could increase the risk of
bone fractures in the elderly.4 Hypo natremia problems
(Na < 135 meq/L) in the elderly have gained concern
METHODS
Selection of subjects and laboratory tests
An experimental, analytic study was conducted on
elderly population with the pre- and post-treatment
designs. The study was carried out in one institutional
elderly home that was accessible in Jakarta. The
recruitment of subjects was conducted by simple ramdom sampling using random number table. The selected patients would be reselected based on the inclusion and exclusion criteria. The patients were
then assigned to ive groups by block randomization
using random number table namely group I, water
intake based on the standard;16 group-II, water intake
of 1000 mL/24 hour; group-III, 1500 mL/24 hours; group IV, 2000 mL/24 hours and group V, 2500 mL/24 hours. Intervention was carried out for two weeks to
assess the decline in serum sodium concentrations. The
minimal mean considered signiicant18 was 5 meq/L for determining of sample size. The age of subjects in the study was above 60 years, they were normovolemic
and serum creatinine was less than 2 mg/dL. They
were excluded if they had diabetes melitus, abnormal
cortisol levels (morning cortisol value 5–25 ug/dL), Hypothyroidism (FT4 < 0.89 ng/dL and TSH > 5.50 uIU), taking manitol, taking diuretics, had chronic diarrhea, heart failure, acute coronary syndrome < 60 days, suspected of the risk of lung edema during water intake
intervention, impression of wide anterior ischemia on ECG, nephrotic syndrome, liver cirrhosis, on steroids, and debilitating conditions that would complicate feeding
and non-cooperative. The selected subjects underwent the
tests of BUN, creatinine, morning urine sodium, serum sodium, potassium, and chloride concentrations, serum osmolality, morning urine osmolality, plasma ADH,
plasma NT-proBNP, serum cortisol levels, Free-T4, TSHs, fasting glucose level, CHE, Albumin/Globulin,
urinalysis, ECG, body weight and height measurement.
Blood sample taking for the laboratory tests was
conducted at 7 am, following ten hours’ fasting.
The water intake was deined as total water intake added by the water content derived from the food consumed.
Daily recording of water intake volume per 24 hours
by each individual in each group was carried out, from day 1 to day 14. At day 7 and 14, sodium, potassium,
chloride, creatinine and BUN level in the serum were
assessed. The intervention would be discon¬tinued if symptomatic hyponatremia manifested.
monitored periodically for one year,5,6 namely between
31.3–53%. The frequency of hyponatremic elderly
patients hospitalized is even higher between 25 and
45%,8,9 whereas the frequency of hyponatremic elderly
patients taken care at home is lower, namely 8%.6
Excessive water intake is the frequent trigger for
hyponatremia namely 78%, in the institutional elderly homes.6 This condition is secondary to increased ADH in the elderly. The increase is caused by the hyperplasia of the paraventricular nucleus at the hypothalamus causing increased ADH secretion by the hypotalamus which as independent of the serum osmolality.10-12 In the elderly, the ANP concentration is increased.
N-terminal of BNP (NT-proBNP) which is a homolog
of ANP also increases in the elderly. The increase in
NT-proBNP in the elderly will inhibit the reabsoption
of sodium in the medullary colecting ducts of the
kidney and will repress the production of angiotensin II
as well as aldosteron so that natriuresis were increased.1 The increased natriuresis will certainly predispose hyponatremia to someone.
Case reports on severe hyponatremia caused by
excessive water intake in the elderly people with high
plasma ADH levels have been reported in Japan and Hungary.13,14 Other researchers, namely Chute JP at al.15 has done a metabolic study on 24 patients. Water and sodium restriction in patients with hyponatremia with increased ADH without increased ANP levels shows increased serum sodium concentration, but it does not occur in hyponatremia with increased ANP without increased ADH concentrations. Administration of water which is not excessive is one solution to prevent hyponatremia in the elderly.
Up to now there has been no study on how much water intake volume that is considered optimal for the elderly
without causing either hypovolemia or hyponatremia. The survey done by Lindeman et al.revealed that water
intake as many as 3-5 glasses of water per 24 hours could increase the BUN ratio (blood urea nitrogen)
to creatinine or hypo¬volemia. Based on this survey,
water intake up to 5 glasses of water per 24 hours was
appropriate without causing hyponatremia.16,17
Optimal water intake volume for the elderly without
causing hyponatremia would be determined in this
study. The indings generated would serve as the
it was stated that the number of subjects who completed
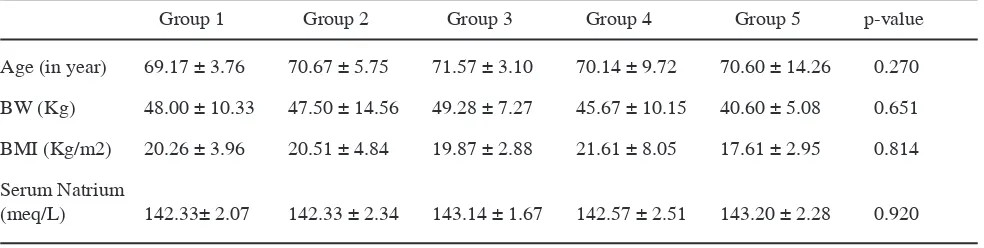
the two-weeks study was 31. No signiicant difference in clinical and laboratory characretistics was found in 5
subject groups before the interven tion commencement
(table 1). No signiicant difference in nutrient intake in 5 subjects groups during two-weeks of the study.
No signiicant difference was found between the target of water intake and the mean water intake during the
study in each group. In all the groups, volume of water
intake, either before or after the intervention-the mean BUN-creatinine ratio did not exceed 20.
Water intake and sodium status
Prior to the intervention, no signiicant difference
was found in the mean sodium concentrations in each group. The mean sodium concentrations were not
found signiicantly different either among the ive
groups after one week ‘s intervention, so were the
sodium concentrations in ive groups after two weeks (table 2). Merely in group IV, signiicant difference was found between the mean sodium concentra- tions prior
to intervention and the mean sodium concentration
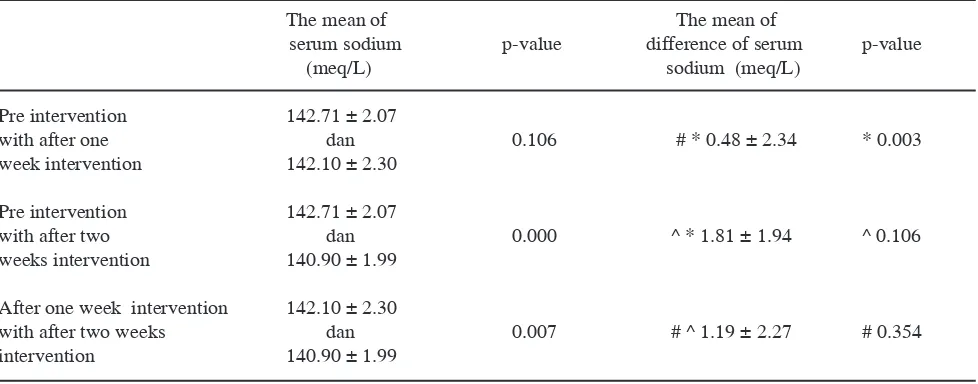
following the two weeks intervention (p = 0.026). As a group in the 31 subjects investigated, a signiicant
difference was found in the mean sodium concentrations before intervention with the sodium concentrations
after two week’s intervention; however, no signifant
difference was found between the sodium concentrations before intervention and the sodium concentration after
one week’s intervention (table 3). On the other side, a signiicant difference was found between the mean sodium discrepancy before and after the one week’s intervention (0.48 ± 2.34 meq/L) and the mean sodium discrepancy before and after the two week’s intervention (1.81 ± 1.94 meq/L, p = 0.003) (table 3).
During the intervention that lasted for 14 days, each subject was monitored for 24 hours every day from day
one to day fourteen by one caregiver. Water intake forms
were made uniform for all the caregivers. During the study, supervision of the caregivers was exercised to
ensure recording of water intake and keeping an eye on the subjects continuously. To measure the water intake,
measured glasses of the same type and shape were used by each of the subjects. Every day during the study,
the food intake and the compositions namely sodium,
carbohydrate and fat were supervised by one dietitian
and one supervisor-senior dietitian. The compositions
and the quantity of nutrients were attempted to be in the similar range during the study.
Statistical analysis was conducted on the discrepancy
between the two means paired with the t-test or
Wilcoxon test, between the unpaired means with the
unpaired t-test or ANOVA or Kruskal-Wallis to compare
the mean numeric variables between the two group categories in the more than two paired groups, repeated
ANOVA or Friedman test to compare the mean numeric
paired variables of more than two groups. Statistical data analysis was conducted by using the computer software SPSS version 13.0.
This ethics of this study has been approved by Research
Ethics Comission Faculty of Medicine University of
Indonesia. Informed consent was signed by the selected elderly subjects or by those who were responsible for the subjects. All of the subjects was treated fairly.
RESulTS
Patients and clinical characteristics/laboratory results
The number of elderly subjects included into the study was 107 people. Based on the predetermined exclusion criteria
as well as on one drop-out at the end of the irst week,
Table 1. Clinical and laboratory characteristics in ive groups prior to intervention
Group 1 Group 2 Group 3 Group 4 Group 5 p-value
Age (in year) 69.17 ± 3.76 70.67 ± 5.75 71.57 ± 3.10 70.14 ± 9.72 70.60 ± 14.26 0.270
BW (Kg) 48.00 ± 10.33 47.50 ± 14.56 49.28 ± 7.27 45.67 ± 10.15 40.60 ± 5.08 0.651
BMI (Kg/m2) 20.26 ± 3.96 20.51 ± 4.84 19.87 ± 2.88 21.61 ± 8.05 17.61 ± 2.95 0.814
Serum Natrium
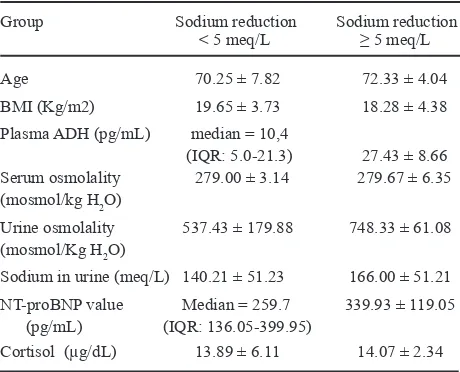
found in the mean serum ADH levels before intervention
among the groups of water intake. The median of
plasma ADH levels in the group with sodium reduction
< 5 meq/L was 10.4 pg/mL (IQR: 5.0-21.3). The mean
plasma ADH levels in the group with sodium reduction
≥ 5 meq/L was 27.43 ± 8.66 pg/mL. The plasma ADH
levels in the group with sodium reduction ≥ 5 meq/L
looked signiicantly higher (p = 0.041) compared with the ADH in the group with sodium reduction < 5 meq /L (table 4).
Three subject (10%) were found to develop declined sodium concentrations ≥ 5 meq/L after the two week’s
intervention in group III, two subjects in group IV and one subject out of 31 subjects who followed this study.
Water intake and ADH / NT-proBNP as well as urine osmolality
In 31 elderly subjects, the mean plasma ADH level was
15.78 ± 12.77 pg/mL. No signiicant difference was
Table 2. The mean of serum sodium before and after one and two weeks intervention
Group 1 Group 2 Group 3 Group 4 Group 5
Serum sodium
pre-intervension (meq/L) 142.33 ± 2.07 142.33 ± 2.34 143.14 ± 1.67 ♣142.57 ± 2.51 143.20 ±2.28
Serum sodium after
one week intervension (meq/L) 141.83 ± 1.17 14183 ± 2.48 142.71 ± 3.20 141.86 ± 2.79 142.20±1.48
Serum sodium after
one week intervension (meq/L) 141.00 ± 0.89 140.67 ± 1.63 140.43 ± 2.29 ♣140.86 ± 2.03 141.80 ±3.11
♣ p = 0.026
Tabel 3. The mean of serum sodium and the difference between the mean of serum sodium pre intervention with the mean of serum sodium after one or two weeks intervention in 31 elderly people
The mean of The mean of
serum sodium p-value difference of serum p-value
(meq/L) sodium (meq/L)
Pre intervention 142.71 ± 2.07
with after one dan 0.106 # * 0.48 ± 2.34 * 0.003
week intervention 142.10 ± 2.30
Pre intervention 142.71 ± 2.07
with after two dan 0.000 ^ * 1.81 ± 1.94 ^ 0.106
weeks intervention 140.90 ± 1.99
After one week intervention 142.10 ± 2.30
with after two weeks dan 0.007 # ^ 1.19 ± 2.27 # 0.354
Table 4. The differences in the group of sodium reduction before
intervention and after two week intervention < 5 meq/L
with the group of sodium reduction before intervention
and after two week intervention ≥ 5 meq/L
Group Sodium reduction Sodium reduction
< 5 meq/L ≥ 5 meq/L
Age 70.25 ± 7.82 72.33 ± 4.04 BMI (Kg/m2) 19.65 ± 3.73 18.28 ± 4.38 Plasma ADH (pg/mL) median = 10,4
(IQR: 5.0-21.3) 27.43 ± 8.66 Serum osmolality 279.00 ± 3.14 279.67 ± 6.35 (mosmol/kg H2O)
Urine osmolality 537.43 ± 179.88 748.33 ± 61.08 (mosmol/Kg H2O)
Sodium in urine (meq/L) 140.21 ± 51.23 166.00 ± 51.21 NT-proBNP value Median = 259.7 339.93 ± 119.05 (pg/mL) (IQR: 136.05-399.95)
Cortisol (µg/dL) 13.89 ± 6.11 14.07 ± 2.34
There was a signiicant difference (p = 0.004) between
the urine osmolality in the group with sodium reduction
≥ 5 meq/L and that of the group with sodium reduction < 5 meq/L (table 8). The median value of plasma NT-proBNP in 31 subjects in this study was 259.7 pg/ mL (IQR: 136.05-399.95), and the means for male and female were 374 ± 283 and 275 ± 171.6 pg/mL respectively. No signiicant difference was found in the mean plasma NT-proBNP levels among the groups of water intake before the intervention.
The mean of spot urine sodium of the 31 elderly subjects
was 142.71 ± 50.96 meq/L or 97% of the elderly subjects
investigated had high sodium excretion in urine or more than
30 meq/L. Signiicant correlation was not found between plasma NT-proBNP concentration before intervention and
spot urine sodium before intervention. DISCuSSION
The intervention duration that lasted two weeks was
adequate to ind out statistically signiicant differences in this study (table 3).
The mean of power of study in all of the groups was 98%, it could be stated that after water intake intervention,
sodium concentration should decline in healthy elderly population.
The potential factors that inluenced the inal outcomes
of the study in each group were as same as proved by
this study that there was no signiicant difference in ADH and NT-proBNP variables among the ive groups.
So was the case with other variables such as urinary
concentrating ability, total body luid, glomerular iltration rate, water clearance and aldosteron that were assumed to be not different in the ive groups. Based on this fact, merely the factor of water intake volume that inluenced the serum sodium concentrations which is in
line with the objective of this study.
The results of this study could only be inferred to the
elderly population that has fulilled the criteria of healthy
elderly such as aged more than 60, normovolemic,
serum creatinine less than 2 mg/dL and not excluded
from the study criteria and the setting and temperature should comply with the mean temperature of the study setting namely 28.7º C, with the temperatures ranging
from 26.7-30.8º C.
In the normal physiology plasma ADH concen¬tration just started to rise from the 0 point when the serum
osmolality was 280 mosmol/Kg.19 Whereas in this study
the mean plasma ADH concentration was 15.78 ± 12.77 pg/mL at the mean serum osmolality 279 ± 3.4 mosmol/ Kg. It could be deduced that the ADH increase was not
triggered by the serum osmolality. In this study, the increase in plasma ADH was caused by the hyperplasia of paraventricular hypothalamic neurons.10,11 So was it before the intervention, considering that all of the elderly subjects included in this study were normovolemic so
that the increase in ADH was not inluenced by
non-osmotic factors.
In the group with sodium reduction ≥ 5 meq/L, in fact the ADH concentration was signiicantly higher than that of the group with sodium reduction < 5 meq/L. This condition was relected by the urine osmolality in the group with sodium reduction ≥ 5 meq/L that was signiicantly higher (p = 0.004). Unraveling that there was a propensity for
more water retention in three elderly subjects with Na
reduction ≥ 5 meq/L, so that the adminis¬tration of 1500 mL and 2000 mL of water intake led to the clinically signiicant drop of sodium concentration
It could be assumed that there was correlation between
the high ADH and water intake to be able to induce
hyponatremia in the elderly or not. The higher the plasma ADH concen¬tration, the more susceptible the elderly
are to hyponatremia if given a high water intake. More interestingly, in group II with 1000 mL water intake, sodium reduction ≥ 5 meq /L did not occur despite the
presence of two elderly subjects with ADH levels 46.1
pg/mL and 52.8 pg/mL respectively, so that there was
strong impression that it required more massive water
intake than 1000 mL to induce hyponatremia.
1500-2500 mL? The mean ADH value in the group with sodium reduction ≥ 5 meq/L was 27.43 ± 8.66 pg/
mL or the plasma ADH concentration ranged between
19–36 pg/mL. Analysis was done by employing Receiver Operator Curve (ROC),[20] initiating with group III, group-IV and group V. Based on this analysis, the cut-off point of ADH limit score was 19 pg/mL.
The total number of elderly subjects who joined the
study in groups I,II,III,IV and V was 9 (31%) people who had ADH concentration ≥ 19 pg/mL namely 2 subjects in the group of water intake volume based on Skipper method, 2 subjects in the group of 1000 mL water intake volume, 3 subjects in the group of 1500 mL water intake volume, one subject in the group of 2000 mL intake volume, and one subject in the group of 2500 mL water intake volume. This reveals that
one third of the elderly group was potential to develop
hyponatremia if given a water intake exceeding 1500
mL in twenty four hours. This condition is in line with what has been reported by some researchers that the frequency of hyponatremia at institutional elderly homes is quite high, ranging from 4,2–18%,5-7 at which
excessive water intake is the most frequent trigger.6 In
our study, there were 3 (60%) out of 5 elderly subjects with ADH concentration ≥ 19 pg/mL in the groups of 1500-2500 mL water intake that developed sodium concentration reduction ≥ 5 meq/L. In the group of 1000 mL, two subjects were found with ADH ≥ 19 pg/ mL; however, the serum sodium concentration did not decline to ≥ 5 meq/L. It still requires further research to prove that the cut-off point of plasma ADH 19 pg/
mL is the threshold for the occurence of hyponatremia
with the water intake ≥ 1500 mL/24 hour.
Based on the assumption and the fact of ADH inluence, it is obvious that the safe water intake volume which did not cause sodium reduction ≥ 5 meq/L in this study was 1000 mL/24 hour. At the same time, it could be predicted that water intake up to 1000 mL/24 hour was an optimal water intake owing to the highest water intake volume that did not cause sodium reduction ≥ 5 meq/L and did not cause hypovolemia either.
The absence of signiicant difference in the mean body weight from group-I to group-V, and the mean body weight of group-II was 47.50 ± 14.55 Kg, so the mean water intake per Kg body weight which was safe and adequate for the elderly was 21.05 mL/Kg BB (1000 mL divided by 47.5 Kg) or rounded up to 21 mL/Kg BW with the minimal water intake of 1000 ml mL/24hours. Can reduced water intake lead to health problems? Dan
Negoianu and Stanley Goldfarb in their editorials in J
Am Soc Nephrology in the year 2008 and also Valtin H. in his writing opposed this statement due to the absence of studies that met with the requirements of good studies
to state the beneits of massive water intake.21,22
BNP has a moderate homolog with ANP. Like ANP,
BNP levels also increase in the elderly and in those
with renal function disorders whereas it is known that the elderly develop GFR decline. In the elderly, the cut-off point of NT-proBNP (amino-terminal pro-brain natri¬uretic-peptide) to determine if there is heart failure at GFR ≥ 60 mL/minute was 900 pg/mL in the elderdy aged above 50.23 In this investigation,
the median of NT-proBNP at the same method as the report above[23] (Elecsys ProBNP, Roche Diagnostics, Indianapolis, Indiana) is 271.4 pg/mL (136-442 pg/ mL). The cut off point of NT-proBNP or the reference
values for males and females of less than 60 years of
age were 100 and 164 pg/mL respectively.24 Most (72
percent) of elderly females and 75 percent of elderly males had higher plasma NT-proBNP levels than the reference value. The increase in plasma NT-proBNP
level in this study was truly attributed to the late age because clinically signs and symptoms of heart failure
were not found as well as the laboratory NT-proBNP value in this study was < 900 pg/mL. The high plasma NT-proBNP level in this study is in line with what has
been obtained by other researchers as well.25 It was well
reliazed that the correlative analysis performed in this study, especially the correlation between NT-proBNP and natrium excretion in urine not to have fulilled the adequate sample size. Nevertheless, with 31 subjects obtained, it has revealed no correlation. These indings
have been supported by the three factors present in the
elderly that inluence sodium excretion in urine, among
others, ANP, Aldosteron, ADH. Atrial Natriuretic
Peptide or NT-proBNP and Aldosteron which will
increase sodium excretion whereas ADH per se will increase sodium reabsorption at the collecting duct.26 In this study, ADH level was high, which would surely increase reabsorption at the collecting duct which at the same time caused spot urine sodium to have no
correlation with NT-proBNP level.
CONCluSION
As the conclusion of this study, water intake of 1000 mL/24 hours was an optimal water intake. In healthy
elderly people, plasma ADH level has a role in the
determination of water intake volume that does not
cause hyponatremia. The analytical results revealed that
water intake was 1500 mL/24 hours. In healthy elderly people, plasma NT-proBNP level did not correlates
with the spot urin sodium concentration.
As the recommendation, in healthy normovolemic elderly
people, the recom mended water volume intake is 1000 mL/24 hours. The water intake up to 21 mL/Kg BW with the minimum of 1000 mL/24 hours is a safe water intake
for healthy normovolemic elderly people. This study
could be continued to prove the cut-off point value of ADH concentration is 19 pg/mL by comparing the upper and lower groups at the cut-off point toward the signiicant
sodium concentration reduction after the intervention with
the water intake volume of 1500 mL/24 hours.
RefeRences
1. Luckey A, Parsa C. Fluid and electrolytes in the aged. Arch
Surgery. 2003;138:1055-60.
2. Ayus JC, Armstrong D, Arieff AI. Hyponatremia with
hypoxia: effects on brain adaptation, perfusion, and histology in rodents. Kidney Int 2006;69(8):1319-25. 3. Kokko J P. Symptomatic hyponatremia with hypoxia is a
medical emergency. Kidney Int. 2006;69(8):1291-3. 4. Gankam Kengne F, Andres C, Sattar L, Melot C, Decaux G.
Mild hyponatremia and risk of fracture in the ambulatory elderly. Qjm. 2008 Jul;101(7):583-8.
5. Chen L, Lin M, Hwang S, Chen T. Hyponatremia among the institutionalized elderly in 2 long-term care facilities in Taipei. J Chin Med Assoc. 2006;69(3):115–19.
6. Miller M, Morley J, Rubenstein L. Hyponatremia
in a nursing home population J Am Geriatr Soc
1995;43(12):1410-3.
7. Tedjo J, Joseph E J. Hubungan kadar natrium serum dengan kejadian hipotensi ortostatik pada usia lanjut. Abstrak. Buku Program dan Abstrak, Pertemuan Ilmiah Tahunan (PIT) PERNEFRI, Makassar 2006; (November 23-26). 8. Anpalahan M. Chronic idiopathic hyponatremia in older
people due to syndrome of inappropriate antidiuretic
hormone secretion (SIADH) possibly related to aging. J Am Geriatr Soc 2001;49(6):788-92.
9. Siregar P. Frekuensi kejadian hiponatremia pada pasien usia lanjut yang rawat inap di Rumah Sakit Siloam, Lippo-Karawaci, Tangerang, selama tahun 2006. Belum dipublikasi 2007.
10. Johnson A, Crawford G, Kelly D, Nguyen T, AZ`Gyory.
Arginine vasopressin and osmolality in the elderly. . J Am
Geriatr Soc. 1994;42(4):399-404.
11. Fliers E, Swaab D, Pool C, Verwer R. The vasopressin
and oxytocin neurons in the human supraoptic and
paraventricular nucleus; changes with aging and in senile dementia. . Brain Res. 1985;342(1):45-53.
12. Ying T, Serino R, Verbalis J. Downregulation of renal
vasopressin V2 receptor and aquaporin-2 expression parallels age-associated defects in urine concentration. Am J Physiol Renal Physiol. 2004;287:797-805.
13. Iwazu Y, Honma S, Fujisawa G, Uki K, Yanaka I, Sato Y, et al. Hyponatremic seizure associated with acute respiratory infection. . Clin Experimental Neph 2007;11(3):230-4. 14. Radó J, Pató E, Iliás L, Iványi T, Rácz K, Laczi F. Repeated
serious water intoxication in an aged patient. (Data on
the relationship between the inappropriate antidiuretic hormone syndrome and the atrial natriuretic factor). Orv
Hetil. 1995;136(4):189-93.
15. Chute J, Taylor E, Williams J, Kaye F, Venzon D, Johnson B. A Metabolic Study of Patients with Lung Cancer and Hyponatremia of Malignancy. Clin Cancer Res. 2006 February 1;12(3):888-96.
16. Chidester J, Spangler A. Fluid intake in the institutionalized elderly. J Am Diet Assoc. 1997;97:23-8.
17. Lindeman R, Romero L, Hwa C, Baumgartner R, Koehler K, Garry P. Do elderly persons need to be encouraged to drink moref luids? J Gerontology. 2000;55A(7):M361–M5. 18. Halperin M, Goldstein M. Fluid, electrolyte, and
acid-base physiology. a problem-acid-based approach. Third ed: W.B.Saunders Company 1999.
19. Verbalis JG. Disorders of body water homeostasis. Best practice & research. 2003 Dec;17(4):471-503.
20. Sastroasmoro S, Ismael.S, eds. Dasar-Dasar Metodologi Penelitian Klinis. 2nd ed. Jakarta: CV Sagung Seto 2006.
21. Negoianu D, Goldfarb S. Just Add Water. J Am Soc
Nephrol. 2008;19:1041-48.
22. Valtin H. “Drink at least eight glasses of water a day.” Really? Is there scientiic evidence for “8 x 8”? Am J Physiol Regul Integr Comp Physiol 2002;283:R993–R1004.
23. Anwaruddin S, Lloyd-Jones DM, Baggish A, Chen A, Krauser D, Tung R, et al. Renal function, congestive heart failure, and amino-terminal pro-brain natriuretic peptide measurement: results from the ProBNP Investigation of Dyspnea in the Emergency Department (PRIDE) Study. J Am Coll Cardiol. 2006 Jan 3;47(1):91-7.
24. Galasko G I W, Lahiri A, Barnes S C, Collinson P, Senior R. What is the normal range for N-terminal pro-brain natriuretic peptide? How well does this normal range screen for cardiovascular disease? Eur Heart J. 2005;26:2269–76. 25. Costello-Boerrigter LC, Boerrigter G, Redield MM,
Rodeheffer RJ, Urban LH, Mahoney DW, et al. Amino-terminal pro-B-type natriuretic peptide and B-type natriuretic peptide in the general community: determinants
and detection of left ventricular dysfunction. J Am Coll
Cardiol. 2006 Jan 17;47(2):345-53.