20
CHAPTER 3
METHODOLOGY
This chapter explains about the methodology of the research in order to finished the research. There are four main steps in this research such as introduction step, data collecting step, data processing step and report writting step.
3.1. Introduction Step
This introduction step consist of four steps such as define the location of the observation, observation to the company, problem formulation and literature review.
3.1.1. Define the Location of the Observation
This step determines the company that will be used to conduct this final project then ask the manager whether the company need a licensing letter to the company or not, and to help the Author obtain the data for this research. The chosen company for this research is Laresolo Tea House which is located at Babarsari Street Ruko Raflesia II Blok N, Yogyakarta. The company does not need a licensing letter so the permission to conduct a research in this company was done by interview the owner directly.
3.1.2. Observation to the Company
After got the permission to conduct the research in this company, the next step is interview the manager and the waitress in Laresolo Tea House. The manager’s name is Mrs. Tari and the worker name is Mrs. Sisud. By conducting the interview and also observation directly, Laresolo Tea House often has over buying or shortage buying for the tea then affect stock out condition and expired tea. Therefore, the company need a design of inventory system to optimize the inventory with the minimum total inventory cost.
3.1.3. Problem Formulation
21
3.1.4. Literature Review
In this steps, collect some informations and theories that relating to the research. Literature study is conducted by studying some journals, reference from books, and review from previous research that are relevant to inventory system. This literature review was very useful as the basic theory to support the objective and steps in this research.
3.2. Data Collecting Step
The next step is collecting the data. This step is to achieve the data that will be used for the calculation to decide the best inventory system. According to the interview before, it is clearly explain that the real inventory system exists in Laresolo Tea and also the data that needed . The Data that should be collected are data sales of tea, usage of tea, initial inventory of tea and so on that needed in the calculation. This data was taken from January 2015 to February 2016. In this research, the data that collected is used to 36 different tea in Laresolo Tea House.
3.3. Data Processing Step
All data which is connected in this research was processed and analyzed to decide the best solution. The steps are determining the distribution pattern and probability data, making the scenario, making the influence diagram, making the simulation model, conducting the model verification and validation, conduct the simulation and determining the number of replication, determining the best scenario, and comparing the result to the real condition.
3.3.1. Determine the Distribution Pattern and Probability Data
Based on the collected data, then determine the data distribution to generate new data used to mathematical models that will be created in microsoft excel. Data distribution will determined using software Arena 7.1 with Input Analyzer. The steps to use input analyzer are:
a. Open the Arena Program,choose menu Tools-Input Analyzer b. Choose Menu File-New or click icon new in the toolbar directly
c. Input the data to the notepad first and save it in .dst form. After that click file>Data File>Use Existing> choose the file that already save in.dst form. d. Then will shown the graphic, click Fit> and fit one by one.
22
There are 36 data menus of tea, one data of tea looks for the distribution pattern using Input Analyzer in software Arena 7.1 but for 35 others tea are not using input analyzer because the p-value is less than 0,5. So, this data just looks for the probability based on the demand that usually appeared.
3.3.2. Make the Scenarios
The scenario was conducted by adjusting the condition that may occur in the company. The selected scenario allows it to be applied to the problem in Laresolo Tea House in the future. In this research, scenarios that allow to be made are Reorder Point Scenario (ROP) with the Quantity Order (Q), Reorder Point Scenario with the Inventory Quantity Target (Qt). Therefore, the quantity order when achieve the Reorder Point is Qt minus the stock of inventory(I) in this case, the quantity target is the storage capacity for each tea, and the last scenario is determine the Period(P), Reorder Point, and Quantity Order that will have minimum order cost.
3.3.3. Make the Influence Diagram
Prior to creating a simulation model, it is better to create an influence diagram. Influence diagram is a figure that describe the relationship among the variable that will be modeled. By creating an influence diagram, it will be easier to create the simulation model, because the variables to achive the objective was clearly shown.
3.3.4. Make the Simulation Model
After making the scenario and influence diagram, the next step is making the simulation model. Simulation model that will be made was the real system that describe the actual condition of inventory system in Laresolo Tea House. Then, it is neccessary to make the simulation model according to the scenario and influence diagram that already created. The probabilistic demand of tea from customer and also the quantity of tea variation (36 kind of tea) make this problem difficult if it is conducted by using analitic methods with mathematical model. Thus, the way to solved this case is by using simulation with Microsoft Excel.
3.3.5. Conduct the Model Verification and Validation
23
logical. The verification can be performed by using Ms. Excel. While, the purpose of validation is to make sure the model that already made is accordance to the actual system. Both of these proces is important to show the model that have been created is correct and appropriate with the real system. If the model already verified and validated, then go on to the next step, but if it is not,there will be an improvement to the model.
3.3.6. Conduct the Simulation and Determine the Minimum Replication
After validated, the model can be proved to represent the actual model in the real condition. Analysis process of simulation model based on the scenario was run to know the total cost for each scenario. Simulation was not run once. Therefore, it needs the minimum replication to know how many replication that possible to make this simulation appropriate to the real system. After obtaining the results minimum number of replication, the next step is to replicate it. Replication performed a total number of replication minimal or more. The more replication is
done, the resulting output will increasingly represent the actual situation.
The calculation of minimum number of replication can be seen in table 5.18 and 5.19 The X column shows the overall total end cost. The average number and standard deviation number was obtained according to the value of replication row. For example, the standard deviation in the fourth row is the standard deviation for x value in the first row to fourth row. For the t column shows the value that obtained from the t disribution table with α=0,10 . The minimum
replication number that chosen is come from √
| ̅ | less than equal to ý =
0.09.
3.3.7. Determine the best scenario
According to the scenarios that used in these simulations, it should be chosen the most optimal result of scenarios. The results in each scenario can be seen from the results of replication that has been done. At this stage of the scenario chosen according to criteria that exist in this inventory simulation. At this simulation, the
target is at the minimum total inventory cost. Therefore, determining the best
24
3.3.8. Compare the result to the real condition
The purpose of this comparison process is to determine the total output of the cost of inventory at the result with output in real conditions. If the result of simulation gives a lower total cost than the total cost of the real conditions, it can be said that the simulation result better than the real condition. The best result is obtained by comparing the results of simulation and looking at the average output for each model. This research that will be chosen is the output that has lowest total cost of all the models. The model that generates the lowest total cost is the best result.
3.4. Conduct the final project report and Conclusion
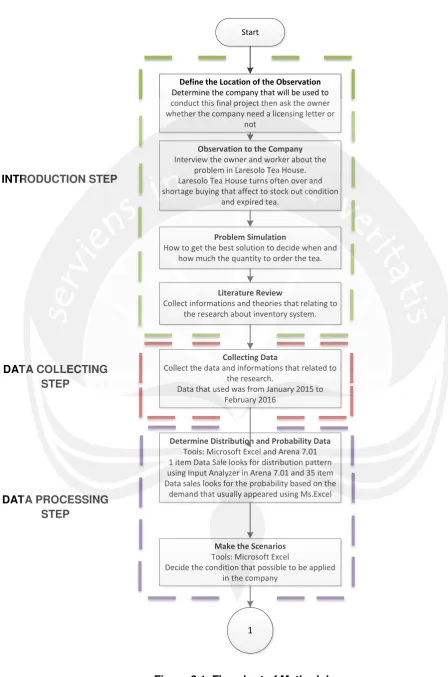
25 Start
Define the Location of the Observation Determine the company that will be used to conduct this final project then ask the owner whether the company need a licensing letter or
not
Observation to the Company Interview the owner and worker about the
problem in Laresolo Tea House. Laresolo Tea House turns often over and shortage buying that affect to stock out condition
and expired tea.
Problem Simulation
How to get the best solution to decide when and how much the quantity to order the tea.
Literature Review
Collect informations and theories that relating to the research about inventory system.
Collecting Data
Collect the data and informations that related to the research.
Data that used was from January 2015 to February 2016
Determine Distribution and Probability Data Tools: Microsoft Excel and Arena 7.01 1 item Data Sale looks for distribution pattern using Input Analyzer in Arena 7.01 and 35 item Data sales looks for the probability based on the
demand that usually appeared using Ms.Excel
Make the Scenarios Tools: Microsoft Excel
Decide the condition that possible to be applied in the company
[image:6.595.60.509.68.746.2]1
Figure 3.1. Flowchart of Methodology INTRODUCTION STEP
DATA COLLECTING STEP
26 1
Make the Influence Diagram
Tools: Microsoft Visio
Draw the relationship among variable that will be used in simulation model.
Make the Simulation Model
Tools: Microsoft Excel
Make the model according to the scenarios and influence diagrams
Conduct the Verification
Tools: Microsoft Excel Make sure the model is correct
Verified?
Conduct the Validation
Tools: Microsoft Excel (T-test) Make sure the model is suitable with the actual
system
Validated?
Conduct the Simulation and Determine the Minimum Replication
Tools: Microsoft Excel
Simulate the model and determine the quantity of replication to make the result more accurate
to the real system
2
YES YES NO
NO
27
2
Determine the Best Scenario Determine the best scenario by finding the scenario that has minimum total inventory cost
Compare the Result to the Real Condition Compare the result of the best scenario to the
real condition in Laresolo Tea House
Conduct the Final Project Report and Conclusion Write the report and recommend the best scenario to be applied and give the suggestion to
the research
Finished