IIIS Discussion Paper
No. 23 / June 2004
MNEs and Indust rial St ruct ure in Host Count ries: A Mean
Variance Analysis of Ireland’ s Manuf act uring Sect or
Frank Barry Depart ment of Economics, Universit y College
Dublin
Colm Kearney Prof essor of Int ernat ional Business, School
of Business St udies and Inst it ut e f or Int ernat ional
IIIS Discussion Paper No.23
MNEs and Industrial Structure in Host Countries: A
Mean Variance Analysis of Ireland’s Manufacturing
Sector
Frank Barry
Colm Kearney
Disclaimer
Any opinions expressed here are those of the author(s) and not those of the IIIS. All works posted here are owned and copyrighted by the author(s).
MNEs and Industrial Structure in Host Countries:
A Mean Variance Analysis of Ireland’s Manufacturing Sector
Frank Barry
Department of Economics, University College Dublin,
and
Colm Kearney
Professor of International Business,
School of Business Studies and Institute for International Integration Studies, Trinity College Dublin.
Abstract
We use mean-variance analysis to demonstrate the importance of a hitherto neglected benefit of enticing MNEs to locate in small and medium-sized countries. During the 25 years from 1974 to 1999, over 1000 foreign MNEs have located in Ireland, and they have raised their share of all manufacturing jobs in the country from one-third to one-half. The foreign MNEs tend to operate in high-technology sectors, and they grow faster with greater volatility than the traditional low-technology indigenous firms. Because they are imperfectly correlated with the indigenous sectors, however, the foreign MNEs have helped to create a more completely diversified manufacturing sector in the host country that can grow faster without a commensurate rise in volatility and risk.
Keywords: FDI, MNEs, industrial structure, Ireland.
JEL classification codes: F23, G11, L16
Corresponding author: Colm Kearney, School of Business Studies, Trinity College, Dublin 2, Ireland. Email: [email protected], tel: 353-1-6082688, fax: 353-1-6799503.
MNEs and Industrial Structure in Host Countries:
A Mean Variance Analysis of Ireland’s Manufacturing Sector
Abstract
We use mean-variance analysis to demonstrate the importance of a hitherto neglected benefit of enticing MNEs to locate in small and medium-sized countries. During the 25 years from 1974 to 1999, over 1000 foreign MNEs have located in Ireland, and they have raised their share of all manufacturing jobs in the country from one-third to one-half. The foreign MNEs tend to operate in high-technology sectors, and they grow faster with greater volatility than the traditional low-technology indigenous firms. Because they are imperfectly correlated with the indigenous sectors, however, the foreign MNEs have helped to create a more completely diversified manufacturing sector in the host country that can grow faster without a commensurate rise in volatility and risk.
Keywords: FDI, MNEs, industrial structure, Ireland.
1. Introduction
The worldwide stock of foreign sourced capital is approximately $6 trillion, and with annual flows of FDI in excess of $650 billion, it is not surprising that an extensive literature has emerged to explain how MNEs internationalise and manage their operations, and how their activities impinge upon host countries. It is widely acknowledged that MNEs can generate employment and exports, and research is ongoing into the nature and extent of secondary spillover effects on indigenous firms.1 Governments throughout the world compete vigorously to attract MNEs, and international business scholars continue to debate the net benefits of this for the host countries (see Haaland and Wooton (1999), Head, Ries and Swenson (2000) and Agmon (2003)).
In this paper, we focus on a hitherto neglected effect of FDI on host countries. Using an amended version of portfolio theory that has been widely applied in the regional science literature, we show how foreign MNEs can reshape the industrial structure of small and medium sized countries. Governments of such countries can attract foreign MNEs that operate in dynamic growth sectors in order to create a more
completely diversified industrial structure that will generate faster growth. As Chandra (2003) demonstrates, however, faster growth is generally accompanied by greater volatility and risk. Business analysts and commentators have also expressed concern that attracting foreign MNEs can be risky if the sectors in which they operate are more volatile than the host country. The essential insight of portfolio theory, however, is that an appropriate mix of foreign MNEs can help the host country achieve a more complete diversification of its industrial structure, and to grow faster without a commensurate rise in volatility. This occurs to the extent that the foreign MNEs operate in sectors that covary imperfectly with other sectors in the host country. Our findings are of interest to policymakers in designing and implementing their FDI strategies, and to MNEs in negotiating with potential host governments.
attractive location for high-technology MNEs by emphasising the competitiveness and stability of the economy, the skills base of its highly educated workforce, the favourable tax regime, and the available financial incentives. Over 1,050 foreign MNEs have located in Ireland. Many of these (507) are from the United States, with 148 being from Germany, 129 from Britain, 216 from the rest of Europe (including France (42), the Netherlands (34), Switzerland (26) and Sweden (21)), 55 from the Far East (including 33 from Japan), and the remaining 39 from the rest of the world.2 They are involved in a wide range of activities in sectors as diverse as e-business, engineering, financial and international services, information communication technologies, medical technologies and pharmaceuticals. Their presence has contributed significantly to transforming a largely agricultural developing country into the knowledge-based ‘Celtic tiger’ that grew at rates in excess of 10 percent during the late 1990s, and which continues to prosper in the first decade of the 2000s by exporting almost 100 percent of its GDP.
The second reason why Ireland is of interest is that size matters in international business. Lacking a substantial consumer base, small countries cannot take advantage of economies of scale and scope unless they make a strong commitment to export. Of the 227 countries in the world in 2004, less than a quarter (50) have populations greater than 20 millions, and 30 countries have between 10 and 20 million people. A
further 50 countries have between 3 and 10 millions, and the remaining 97 (43 percent) have populations of less than 3 millions. With just under 4 millions, Ireland has close to the world’s median population of 4.5 millions, and it occupies the lower end of the 3 to 10 million group which includes Austria, Bulgaria, Denmark, Finland, Israel, New Zealand, Norway, Paraguay, Sweden and Uruguay. Many of these countries have emulated Ireland’s successful FDI policies, and they in turn have been studied by international business scholars seeking to understand the causes and effects of FDI. The effects of FDI on industrial structure depend on a country’s size, and our paper has most relevance for the world’s many small and medium-sized countries.3
half of all manufacturing jobs. We ask two main questions. First, how have foreign MNEs altered the mean-variance characteristics of Ireland’s manufacturing sector? More specifically, has the growth in the share of foreign MNEs relative to indigenous firms led to higher rates of overall growth at the expense of greater volatility and risk?
Second, if the answer to the first question is yes, has the faster growth been achieved at a cost in terms of volatility that compares favourably with the risk that would be borne on a mean-variance efficient frontier? We find that attracting foreign MNEs in fast-growing, high-technology sectors has indeed generated faster growth with greater volatility. This increase, however, has been mean-variance efficient. By this we mean that while the high-technology sectors in which foreign MNEs dominate are more volatile than the indigenous sectors (which largely comprise low-technology industries such as food, beverages, textiles and clothing), the greater rates of growth amongst the foreign MNEs have more than compensated for the additional risk. Because their growth rates are imperfectly correlated with the indigenous firms, Ireland’s foreign MNEs have created a better diversified manufacturing sector that grows faster with a less than commensurate rise in volatility and risk.
Our paper is structured as follows. In the next section, we present our data and review the main developments that have occurred during 25 years of manufacturing in Ireland. Using Herfindahl indexes, we show that diversification has improved over
efficient frontier. We derive virtually identical results in each specification. Our final section summarises our arguments and draws together our main conclusions.
2. Ireland’s Manufacturing Sector
Our data covers 33 sub-sectors defined by 4-digit NACE codes. In order to generate sectors of reasonable size for mean-variance analysis, we aggregate the 33 sub-sectors into 10 standard classifications that closely correspond to NACE 2-digit codes. These are as follows (with the constituent 4-digit codes in brackets):
Food, beverage and tobacco (3110, 3130 and 3140),
Textiles, clothing, leather and footwear (3210, 3220, 3230 and 3240), Paper, printing and publishing (3410 and 3420),
Chemicals, rubber and plastics (3510, 3528, 3530, 3550 and 3560), Pharmaceuticals (3522),
Iron, steel and metal products (3710, 3720 and 3810),
Ships, cars, aircraft and transport (3841, 3843, 3845 and 3849), Professional instruments (3850),
Office computer equipment and electrical (3825, 3829, 3832 and 3839), and Miscellaneous (3310, 3320, 3610, 3620, 3690 and 3900).
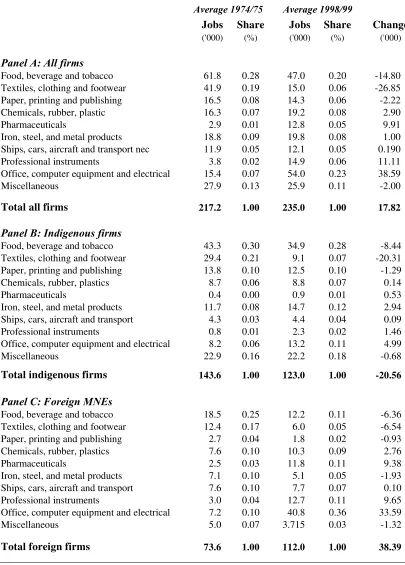
Table 1 provides an overview of developments in these sectors between the mid-1970s and the end of the 1990s for indigenous firms, foreign MNEs, and all firms. The table shows the average level of employment in 1974-1975 and 1998-99,4 and the change in employment between these two periods. Panel A shows that total employment in manufacturing increased by almost 18,000 from just over 217,000 in 1974-75, to 235,000 in 1998-99. This moderate increase, however, obscures dramatic changes during the period, with employment in indigenous manufacturing firms declining by 21,000 to 123,000. This apparently systemic decline in indigenous firm
employment has been spectacularly offset by vigorous growth in the foreign MNE sector. During the 25-year period, more than 38,000 jobs were created, raising the level of employment in Ireland’s foreign MNEs to over 112,000 in 1998-99. In 1974-75, indigenous firms accounted for two-thirds of manufacturing jobs, but by 1998-99 employment in manufacturing in Ireland was split a close to 50/50 between the indigenous and foreign MNE sector.
greater impact than big changes in minor sectors. The textiles, clothing, leather and footwear sector lost most jobs during the period (27,000) and the next largest decline of almost 15,000 jobs has been in food, beverage and tobacco. The job losses in these low-technology sectors have been more than compensated by spectacular growth in
office, computer equipment and electrical (38,000), professional instruments (11,000), and pharmaceuticals (10,000). As in several other developed countries, Ireland’s manufacturing has been transformed by the systemic decline of the traditional low-technology sectors and the rise of high-low-technology sectors.
Panel B reports on developments within the indigenous firms. As in the figures for total employment, textiles, clothing, leather and footwear shows the greatest decline, followed by food, beverage and tobacco. The job losses in these two sectors have only partially been offset by the two indigenous sectors that experienced growth:
office computer equipment and electrical and iron, steel and metal products. In the foreign MNE sector (Panel C) the greatest job losses have also been in textiles,
clothing, leather and footwear and food, beverage and tobacco. In contrast to the indigenous sector, however, these losses have been spectacularly offset by 34,000 new jobs in office computer equipment and electrical, 10,000 in professional
instruments and 9,000 in pharmaceuticals. These figures provide some evidence of the positive spillover effects of FDI. Although this is not tested in our paper, it is
clear that both the foreign and indigenous office computer equipment and electrical
sectors have expanded more rapidly than any other sector, and this trend is also clear in professional instruments and pharmaceuticals.
H= [
∑
]*100 (1) =n
1 i
2 i
α
where αi represents the share of sector i in total manufacturing. H lies between 0 and
100. For example, if all employment is in one sector only, αi is 1 and H is 100.
Alternatively, if half of all jobs are in each of two sectors, then H = [(1/2)2 +
(1/2)2]*100 = 50. The higher the value of the Herfindahl index, therefore, the more specialised the country. We have calculated the Herfindahl indexes for the indigenous and foreign MNE sectors during 1974-75 and 1998-99. For the indigenous sector, the index declined by 14 percent from 18.43 in 1974-75 to 15.92 in 1998-99, implying an increase in diversification during the period. The Herfindahl index for the foreign MNE sector, in contrast, increased by 32 percent from 14.04 to 18.52. This increase in specialisation is explained by the substantial growth in office, computer equipment
and electrical and professional instruments. The Herfindahl index for the manufacturing sector as a whole declined by a substantial 16 percent, from 15.87 in 1974-75 to 13.36 in 1998-99. It is clear that FDI by foreign MNEs has helped to create a more fully diversified manufacturing sector in Ireland. This has occurred via
two channels; directly through the introduction of new foreign sectors, and indirectly through spinoffs leading to growth in some of the local indigenous sectors.
3. Mean-variance analysis
1994, and Carlino, Defina and Sill, 2003) have refined the specifics of its application and applied it to the study of cities, regions and states in the United States. Portfolio theory has also been applied in the international business literature. Mikhail and Shawky (1979, 1980), Aggarwal (1980), Wind and Douglas (1981), Ghertman (1988), and Butler (1998) have used a portfolio approach to study the strategic investment decisions and returns of MNEs. Hanink (1985) and Mudambi (1998) have used portfolio theory to shed light on the location decisions of MNEs, and Brewer (1981), Mathur and Hanagan (1983), Longin and Solnik (1995) and Errunza, Hogan and Hung (1999) have used it to examine the extent to which MNE shareholders can diversify internationally without investing in foreign markets.
We begin our mean-variance analysis by applying Sharpe’s (1970) single index model. This provides us with a first look at the mean growth rates and volatilities for the different sectors relative to the overall manufacturing sector.6 The model is implemented by regressing the growth in employment in each sector on the growth in employment in the manufacturing sector as a whole. The model can be written formally for any sector, i, as follows.
(2)
denotes the percentage growth in overall manufacturing employment; is the
regression constant; is the ‘beta’ for sector i, and is the residual growth in
sector i. The error term is assumed to be random with finite variance and unrelated
to the growth in the overall manufacturing sector, so = = 0 for all
i and t, and = 0 for all i not equal to j. The ‘beta’ coefficient, , is a
measure of the relatively variability of sector i. If > 1, sector i is more variable
than the overall manufacturing sector, and if < 1, it is less variable.
i
constant term, , tells us which sectors are growing faster or slower than the overall
manufacturing sector, given their volatility as captured by . If > 0, the sector is
i
α
i
growing faster than the overall manufacturing sector, and if < 0, it is growing at a
slower rate.
i
α
8
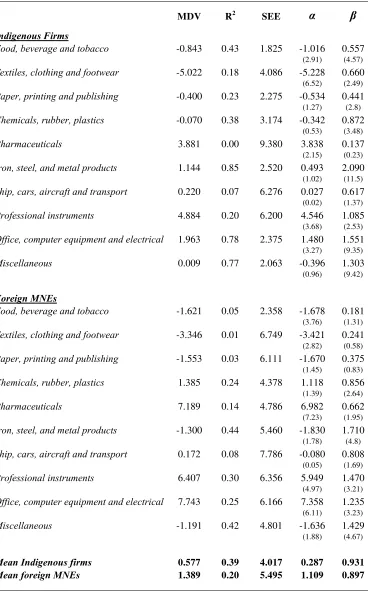
Table 2 presents the results of estimating equation (2) for the 10 indigenous sectors and 10 foreign MNE sectors on 25 years of annual data from 1974 to 1999, using robust standard errors to allow for the effects of any non-spherical disturbances. The bottom two rows of the table present the mean values across the foreign MNE and indigenous sectors. The mean of the dependent variables (MDV) are higher on average for the foreign MNEs (1.389) than for the indigenous firms (0.577). This reflects foreign MNEs generating greater job growth over the period than indigenous firms. The models explain on average 29 percent of the variation in job growth, doing almost twice as well (39 percent) in the indigenous sectors as in the foreign MNEs (20 percent).
The estimated constant terms confirm the trends in manufacturing seen in Table 1.
The alphas for the food, beverage and tobacco and textiles, clothing and footwear
sectors have negative alphas, indicating declining sectors. The pharmaceutical,
professional instruments, and office, computer and electrical sectors have
significantly positive constant terms, implying high growth. The s vary from 2.090
amongst the volatile indigenous firms in iron, steel and metal products, to a low of 0.137 for indigenous pharmaceutical firms. On average, the betas for indigenous firms and foreign MNEs are almost identical, at 0.931 and 0.897 respectively. As might be expected, the betas tend to be similar within sectors. For example, the iron,
steel and metal products, professional instruments, office, computer and electrical,
and miscellaneous sectors have betas greater than 1 amongst both indigenous firms and foreign MNEs, indicating relatively high volatility. Overall, therefore, the estimated constant terms confirm that foreign MNEs have grown at significantly faster rates than indigenous firms, while the estimated betas in each sector are similar. This suggests that Ireland’s strategy of enticing foreign MNEs has resulted in faster
growth without a commensurate rise in volatility. While this is an interesting finding, however, it treats each sector separately and does not permit us to construct an efficient frontier of optimal configurations of growth and risk. It is to this that we now turn.
i
To solve for the efficient frontier, we first define an industrial configuration, A, by a set of weights, Xi, denoting the proportion of jobs in sector i relative to the total
number of manufacturing jobs. The expected mean rate of job growth generated by configuration A is therefore described as,
(3)
and the variance of job growth in configuration A is
(4)
The first term in equation (4) is the sum of the variances of job growth in each sector multiplied by their squared weights in sectoral configuration A. The second term is the sum of the covariance terms multiplied by the product of their weights, and it introduces the possibility that sectors with job growth that covaries imperfectly or negatively with other sectors can form a ‘hedge’ that reduces the variance of the growth in overall job numbers.
,
0
Xi ≥ i=1,....N (8)
This is the standard Markowitz (1952) quadratic programming problem of portfolio theory with no riskless asset and short sales not permitted. It minimises the variance of overall job growth, subject to the constraints that the expected total job growth is the sum of each sector’s expected growth multiplied by its weight (6), that the sum of the sectoral weights is unity (7), and that there can be no negative weights (8).10 There are many standard computer packages available to solve this problem, and we use the VisualMvo programme of Efficient Solutions Inc., which solves for the efficient set and traces it out by varying GA between the minimum variance
configuration and the maximum growth configuration.
In applying the standard quadratic programming solution from finance theory to analyse a country’s industrial structure, it is important to note some important
conceptual differences between a country’s industries and an investor’s stock of financial assets. First, the composition of an investment portfolio is subject to fewer constraints than is a country’s inherited industrial structure. For example, portfolio theory does not require an investor to hold positive amounts of any particular asset. Indeed, efficient portfolios are frequently constructed with ‘short’ positions whereby some assets are held in negative quantities. Unlike a portfolio of financial assets, a country’s industrial structure is not regularly rebalanced and cannot be quickly altered. In the Irish context this raises fewer problems than it might elsewhere, because foreign MNEs in high-technology sectors have been deliberately targeted by
can assume that there is little or no ‘crowding-out’ of jobs in indigenous firms by the foreign MNEs.
A third difference between applying portfolio theory to financial assets and industry sectors is that while the returns on financial assets are inherently unpredictable, job growth has an element of predictability. In order to calculate a true measure of risk in our analysis it is necessary to subtract the predictable component from total job growth. To do this, we follow the standard procedure used in the regional science literature (see, for example, Barth, Kraft and Wiest, 1975, Schoening and Sweeney, 1991, and Board and Sutcliffe, 1991). This involves estimating a
time-series regression of the change in employment in each sector, Gi, on a constant,β0, a
time trend, T, and a quadratic time trend, T2. Here, T is a simple time trend variable
The residuals from (9), , are readily seen as the standard deviations
of employment growth in each sector adjusted for the portion of the growth rates that are predicted from the regressions. It is these adjusted standard deviations that we use in our optimisation routines to calculate the efficient frontier.
)
A 2-sector model with indigenous firms and foreign MNEs
We first solve for the efficient frontier using a 2-sector model of indigenous firms
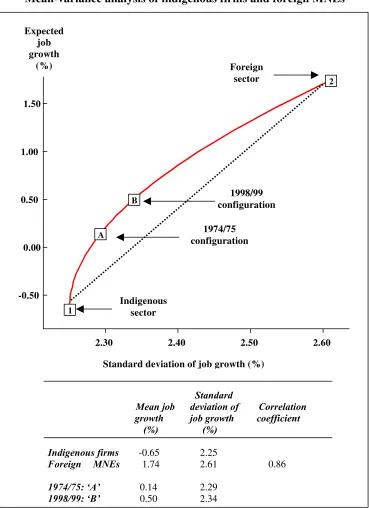
perfectly correlated with growth in the foreign MNEs, the trade-off between job growth and risk would be linear, and the efficient frontier would be a straight line, depicted by the broken line joining points 1 and 2. To see the implications of this, consider a hypothetical situation in which Ireland had no foreign MNEs at the beginning of the sample period, and was located at point 1. With perfect correlation, the policy of attracting foreign MNEs would have shifted the country’s manufacturing structure upwards and to the right towards point ‘2’ along the straight broken line.
The correlation between job growth in indigenous firms and in foreign MNEs, however, is 0.86, and the efficient frontier therefore takes the convex shape depicted by the unbroken line. Ireland’s actual configuration in 1974/75 (with 67 percent of employment in indigenous firms and the remaining 33 percent in foreign MNEs) is depicted by point A on the convex-shaped frontier. By 1998-99, the proportion of employment in foreign MNEs had increased to 48 percent, and this shifted the manufacturing structure to point B. Both A and B are superior to any points directly below them, or to their right on the straight broken line, because they yield a higher rate of job growth relative to an equivalent amount of risk (or equivalently, a lower risk relative to the rate of employment growth).11 Overall, our 2-sector model shows that attracting foreign MNEs has shifted Ireland’s manufacturing sector upwards and to the right along the efficient frontier from point A (with mean growth of 0.14
percent and an adjusted standard deviation of 2.29 percent) to point B (with mean growth of 0.50 percent and an adjusted standard deviation of 2.34 percent). This shift has generated a 350 percent rise in employment growth with only a 22 percent increase in risk.
A 2-sector model with low- and high-technology firms
Given that IDA Ireland has sought to attract high-technology MNEs, it is of interest to examine an alternative specification that divides our data set into low-technology and high-low-technology industries. We follow the OECD definition of technology intensity. The low-technology sectors are:
• Food, beverage and tobacco,
• Textiles, clothing, leather products and footwear,
• Paper, printing and publishing,
• Iron, steel and metal products, and
And the high-technology sectors are:
• Chemicals, rubber and plastics,
• Pharmaceuticals,
• Ships, cars, aircraft and transport,
• Professional instruments, and
• Office, computer equipment and electrical.
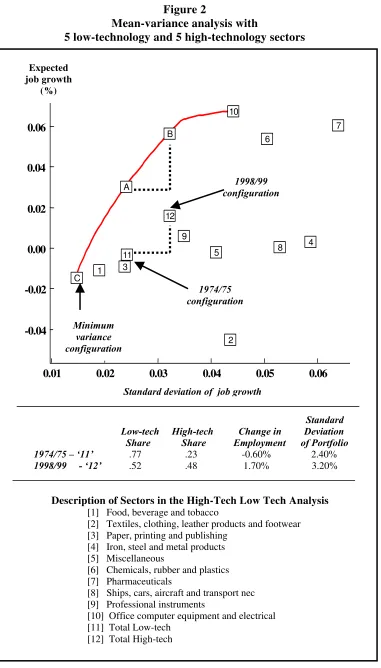
In 1974-75, the low-technology sectors accounted for over three-quarters (77 percent) of all manufacturing jobs and less than one-quarter (23 percent) were in the high-technology sectors. By 1998-99, high-high-technology industries had expanded to such an extent that the split was almost 50/50, with low-technology industries accounting for 52 percent of manufacturing employment and high-technology sectors accounting for 48 percent. This ratio closely resembles the indigenous firm / foreign MNE split. This is no coincidence, because most indigenous firms were traditionally located in the low-technology sectors, while most foreign MNEs investing in Ireland have been
in the high-technology sectors.
Figure 2 depicts the efficient frontier for the low-technology / high-technology analysis. The sectors are numbered [1] – [10] in the figure, with [1] – [5] being the low-technology sectors described in the previous paragraph, and [6] – [10] being the high-technology sectors. The points labeled [11] and [12] are the industrial configurations that obtained in 1974/75 and in 1998/99, and they closely resemble those in the 2-sector model with the indigenous firm / foreign MNE configuration. The tradeoff between job growth and greater variability that occurred as the economy moved from point [11] to [12] is very similar to that depicted in the move from points ‘A’ to ‘B’ on the efficient frontier directly above them, and it is also very similar to the move from point ‘B’ to ‘C’ in Figure 1. It follows that our results are essentially the same whether we conduct our analysis using the 2-sector indigenous firm / foreign MNE split or the 10-sector low-technology / high-technology split.
A disaggregated 20-sector model
In the preceding 2-sector analyses, we have forced the optimisation solution to place both sectors on the efficient frontier. It is unlikely, however, that all sectors are
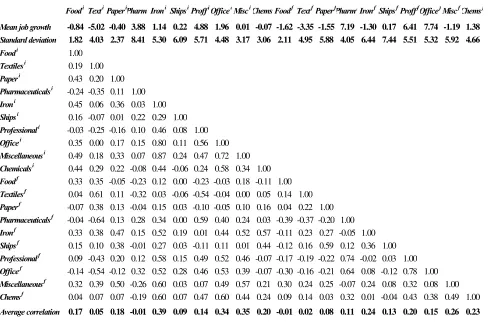
presents the mean rates of job growth and adjusted standard deviations, along with the full correlation matrix for this 20-sector analysis. Mean growth rates range from a high of 7.74 percent for foreign MNEs in the office, computer and electrical sector, followed by foreign MNEs in pharmaceuticals (7.19 percent) and professional instruments (6.41 percent). These foreign MNEs have grown at phenomenal rates over the period, and they largely account for the impressive annual growth rate of 1.39 percent for all foreign MNEs. The highest growth rates for indigenous firms are in professional instruments (4.88 percent) and pharmaceuticals (3.88 percent). The average growth for indigenous firms is just under 1 percent, and this would be much lower without the presence of these two sectors that have prospered alongside the fastest growing foreign MNE sectors. The sectors most in decline are textiles,
clothing, leather and footwear, food, beverage and tobacco, and paper, printing and
publishing. The decline of these sectors has occurred amongst both foreign MNE and indigenous firms. The picture that emerges is of a country that has shifted its manufacturing base away from low-technology towards high-technology sectors.
The adjusted standard deviations are highest for indigenous firms in the
pharmaceuticals sector (8.41 percent). This is closely followed by foreign MNEs in
ships, cars, aircraft and transport (7.44 percent) and indigenous firms in the same sector (6.09 percent), and foreign MNEs and indigenous firms in iron, steel and metal
products (6.44 and 5.30 percent respectively). The lowest standard deviations are recorded in food, beverage and tobacco for both indigenous firms (1.82 percent) and foreign MNEs (2.11 percent). The average standard deviation is higher for foreign MNEs (5.23 percent) than for indigenous firms (4.84 percent). It is interesting to note that while Ireland’s success in attracting foreign MNEs in the pharmaceuticals sector spilled over to indigenous firms, the volatility of employment in the indigenous pharmaceuticals sector has been more than twice that of foreign MNEs. While this may be an outlier, there is an important implication for policymakers who provide incentives to foreign MNEs with a view to encouraging ‘spillover’ into the domestic sector. The growth-volatility characteristics of the foreign MNEs will not necessarily be replicated by indigenous firms in the same sector.
average correlation of each sector with all others. Sectors with the highest average correlations include indigenous firms in iron, steel and metal products, office computer equipment and electrical and miscellaneous, all with means above .33. Amongst the lowest average correlations are indigenous pharmaceuticals and foreign MNEs in food, beverage and tobacco, which have negative average correlations. The mean correlation for all sectors is .17, but it is somewhat higher for the indigenous sectors (.19) than for the foreign MNEs (.14). As expected, the mean correlations between indigenous firms and foreign MNEs in the same sector (.37) are more than twice the overall mean. This is especially true for textiles, clothing, leather and
footwear (.61), miscellaneous (.57), office computer equipment and electrical (.53) and iron, steel and metal products (.52). By contrast, the correlations among indigenous and foreign MNEs are lowest in ships, cars, aircraft and transport (.03) and paper, printing and publishing (.13).
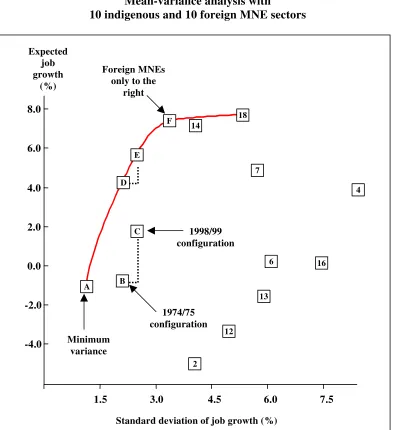
Figure 3 presents the efficient frontier for the 10 indigenous and 10 foreign MNE sectors, obtained by minimizing equation (5) subject to (6) – (8). The return-risk characteristics of the individual sectors are depicted by numbered points in the boxes. We do not include all 20 sectors in the figure. To avoid cluttering, we have omitted those that do not feature at any point along the efficient frontier (sectors 5, 8, 9, 10, 15, 17, 19 an 20), and sectors 1, 3 and 11 because they are located very close to point
Has this shift been mean-variance efficient? That is, has the extra growth been achieved at a cost (in terms of variability) that compares favourably to what could be achieved on the efficient frontier? To answer this question, consider two hypothetical configurations that lie on the frontier vertically above B and C at points D and E respectively. Configurations D and E have the same variability as B and C. Point D delivers mean growth of 3.7 percent with a standard deviation of 2.4 percent, and point E delivers mean growth of 5.6 percent with a standard deviation of 3.0 percent. The policy of attracting foreign MNEs – moving from B to C – has raised mean growth relative to its variability by a greater amount (2.5 percent) than is implied by a shift along the efficient frontier from D to E (1.9 percent). Using the level of manufacturing employment in 1999 (236,800) as a base, the extra growth relative to what could have been achieved on the efficient frontier yields an additional 7,750 jobs after 5 years, rising to an extra 17,284 jobs after 10 years. The policy of attracting foreign MNEs to locate manufacturing facilities in Ireland has increased job growth relative to its variability at a faster rate than would be implied by a movement along the efficient frontier. The policy has therefore been mean-variance efficient, as it has shifted the country’s manufacturing sector closer to the frontier.
As a robustness check on these results, we recalculate the optimisation analysis and impose constraints on the extent to which the sectoral weights can change over time.
The regional science literature recognises that altering a region’s industrial configuration is not as straightforward as modifying a portfolio of assets. In the international business context, it takes time for new FDI policies to evolve into the desired manufacturing configuration. Board and Sutcliffe (1991) and Chandra (2003) show that imposing upper and lower limits on the sectoral weights restricts the efficient frontier to a small subset of its unconstrained counterpart, and is often located inside it. Imposing constraints also ensures that all sectors are represented on the restricted frontier. We do this by replacing the constraint in equation (8) with (8’) as follows,
(8’)
, X X
where XL and XU are the lower and upper constraints on the weights respectively.
Table 4 shows that the weights in some sectors have changed considerably over the 25 years of our data period. The indigenous textiles, clothing, leather and footwear
sector, for example, has declined by over 70 percent from 13.6 percent in 1974/75 to 3.9 percent in 1998/99. In contrast, the foreign MNE office computer equipment and electrical sector has grown by over 400 percent from 3.3 percent in 1974/75 to 14.3 percent in 1998/99. All other sectors have changed by less than 10 percent. To capture the thrust of these constraints, we have re-optimised the 20-sector model by imposing the following minimum and maximum weights:
• indigenous food, beverage and tobacco: 10 and 30 percent,
• indigenous textiles, clothing, leather products and footwear: 0 and 20 percent,
• indigenous miscellaneous products: 5 and 20 percent,
• foreign MNE office, computer equipment and electrical: 0 and 20 percent, and
• all other sectors: 0 and 10 percent.
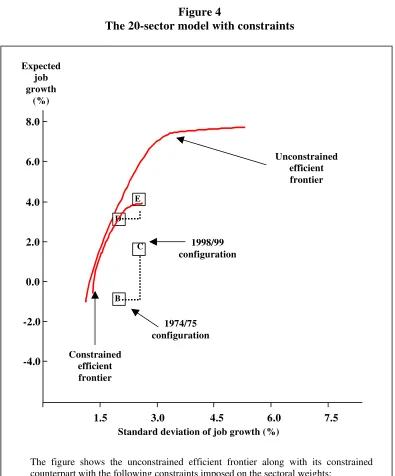
Figure 4 presents the resulting constrained frontier alongside its unconstrained counterpart. It is clear that the constrained frontier is wholly inside, and much smaller than the original efficient frontier. When we constrain the extent to which the sectors are free to adjust, therefore, the shift in Ireland’s manufacturing structure appears more mean-variance efficient relative to the constrained efficient frontier. This arises because the actual configurations that existed at the beginning and the end of the period are closer to the constrained frontier. It can also be seen that the actual shift has involved a greater rise in growth relative to risk than could have been achieved by moving along the constrained frontier.
4. Summary and Conclusions
We illustrated this using 25 years of Irish manufacturing employment data for indigenous firms and foreign MNEs at various levels of aggregation from 1974 to 1999. In 1974-75, indigenous firms accounted for two-thirds of all manufacturing jobs in Ireland, and foreign MNEs accounted for the rest. By 1998-99, the number of manufacturing jobs in foreign MNEs had grown by more than 50 percent, and their share of all manufacturing jobs had risen from a third to a half. To focus our analysis, we asked two main questions; has the growth in the share of foreign MNEs relative to indigenous firms led to higher rates of overall growth at the expense of greater volatility and risk, and if so, has the altered growth-volatility trade-off been mean-variance efficient?
We first used Herfindahl indexes to show how foreign MNEs that operate in high-technology sectors have improved the diversification of Ireland’s manufacturing sector. We also estimated Sharpe’s (1970) single index model for each sector to illustrate the extent to which the foreign MNEs have grown faster on average, while being more volatile than the indigenous firms. We then presented an aggregative portfolio analysis using 2 sectors; indigenous firms and foreign MNEs. This simple framework allowed us to demonstrate that although the foreign MNEs are more volatile than indigenous firms, the improved diversification has allowed the overall manufacturing sector to grow faster without a commensurate rise in volatility. We
increase in variability yields an extra 7,750 jobs after 5 years, rising to an extra 17,284 jobs after 10 years. This increase over 10 years is a very significant 7.3 percent of all jobs in the manufacturing sector, and it provides an interesting measure of the benefits that continue to accrue to Ireland as a result of its successful FDI policies.
Bibliography
Abraham, K. G. and L.F. Katz (1986), ‘Cyclical Unemployment: Sectoral Shifts or Aggregate Disturbances?’ Journal of Political Economy, 94, 507-522.
Aggarwal, R. (1980) ‘Investment performance of US-based multinational companies: comments and a perspective on international diversification of real assets’ Journal of International Business Studies 11, 98-104.
Agmon, T. (2003) “Who gets what: the MNE, the national state and the distributional effects of globalisation, Journal of International Business Studies, 34 (5), 416-427.
Barth, J., J. Kraft and P. Wiest (1975) “A portfolio theoretic approach to industrial diversification and regional employment” Journal of Regional Science 15(1), 9-15.
Board, J. and C. Sutcliffe (1991) “Risk and income tradeoffs in regional policy: a portfolio theoretic approach” Journal of Regional Science 31(2), 191-210.
Brainard, W.C and R.N. Cooper (1968), Uncertainty and Diversification in International Trade’, Food research Institute Studies in Agricultural Economics: Trade and Development, 8, 257-285.
Brewer, H. (1981), ‘Investor Benefits from Corporate International Diversification’,
Journal of Financial and Quantitative Analysis, 16, 1, 113-126.
Brown, D.J. and J. Pheasant (1985) “A Sharpe portfolio approach to regional economic analysis” Journal of Regional Science 25(1), 51-63.
Buckley, P.J., J. Clegg and C. Wang (2002), The impact of inward FDI on the performance of Chinese manufacturing firms’, Journal of International Business Studies, 33 (4), 637-656.
Butler, K.C., and D.C. Joaquin (1998) ‘A note on political risk and the required return on foreign direct investment’ Journal of International Business Studies 29, 599-607.
Carlino, G, Defina, R. and K. Sill (2003), ‘Postwar period changes in employment volatility: new evidence from state/industry panel data’, Research Paper No 03-18, Research Department, Federal Reserve Bank of Philadelphia, August.
Chung, W., W. Mitchell and B. Yeung (2003) ‘Foreign direct investment and host country productivity: the American automotive component industry in the 1980s’,
Journal of International Business Studies 34, 199-218.
Conroy, M.E. (1974) “Alternative strategies for regional industrial diversification”
Journal of Regional Science 14(1), 31-46.
Errunza, V., Hogan, K. and Hung, M. (1999), ‘Can the Gains From International Diversification be Achieved Without Trading Abroad?’, Journal of Finance, 54, 6, 2075-2107.
French, M. and D.E. Sichel (1993), ‘Cyclical Patterns in the Variance of Economic Activity, Journal of Business and Economics, 11(1), 113-119.
Figini, P. and H. Gorg (1999), ‘Multinational companies and wage inequality in the host country: the case of Ireland’, Weltwirtschaftliches Archiv, 135, 594-612.
Ghertman, M. (1988) ‘Foreign subsidiary and parent’s roles during strategic investment and divestment decisions’ Journal of International Business Studies 19, 47-67.
Goldberg, M., and M. Levy (2000) ‘The European Union as a country portfolio’,
European Journal of Political Economy, 16, 411-427.
Gorg, H. and D. Greenaway (2001) ‘Foreign direct investment and intra-industry spillovers: A review of the literature’, Research Paper 2001/37, Leverhulme Centre, University of Nottingham.
Gunther, J., and J. Robinson (1999) ‘Industry mix and lending environment variability; what does the average bank face?’ Economic and Financial Review, Federal Reserve Bank of Dallas, Q2, 24-31.
Haaland, J.I and I Wooton (1999) ‘International competition for multinational investment’, Scandinavian Journal of Economics, 101, 631-649.
Hanink, D.M. (1985) ‘A mean-variance model of MNF location strategy’ Journal of International Business Studies 16, 165-170.
Head, K.C., J.C. Ries and D.L Swenson (2000) ‘Attracting foreign manufacturing: investment promotion and agglomeration’, Regional Science and Urban Economics, 29, 197-218.
Hejazi, W. and A.E. Safarian (1999) ‘Trade, foreign direct investment and R&D Spillovers’, Journal of International Business Studies, 30 (3), 491-511
Hunt, G. and T. Sheesley (1994) “Specification and econometric improvements in regional portfolio diversification analysis” Journal of Regional Science 34(2), 217-235.
Lande, M. (1994) “Regional industrial structure and economic growth and stability”
Journal of Regional Science 34(3), 343-360.
Liu, X., P. Siler, C. Wang and Y. Wei (2000), ‘Productivity spillovers from foreign direct investment: evidence from UK industry level panel data’, Journal of International Business Studies, 31, 407-425.
Markowitz, H. (1952) “Portfolio selection” Journal of Finance 7(1), 77-91.
Mathur, I. and Hanagan, K. (1983), ‘Are Multinational Corporations Superior Investment Vehicles for Achieving International Diversification?’ Journal of International Business Studies, 14, 3, 135-146.
McConnell, M and G. Perez-Quiros (2000), ‘Output fluctuations in the Unites States: what has changed since the early 1980s?’, American Economic Review, 90 (5), 1461-1476.
Mikhail, A.D., and H.A. Shawky (1979) ‘Investment performance of US-based multinational corporations’ Journal of International Business Studies 10, 53-66.
Mikhail, A.D., and H.A. Shawky (1980) ‘Investment performance of US-based multinational companies: comments and a perspective on international diversification of real assets: a reply’ Journal of International Business Studies 11, 105-106.
Mudambi, R. (1998) ‘The role of duration in multinational investment strategies’
Journal of International Business Studies 29, 239-261.
Schoening, N.C. and L.E. Sweeney (1991) “Applying an industrial diversification decision model to small regions” Review of Regional Studies 22(1), 14-17.
Sherwood-Call, C. (1990) “Assessing regional economic stability: a portfolio approach” Federal Reserve Bank of San Francisco Economic Review 1, 17-26.
Siddharth, C. (2003) “Regional economy size and the growth-instability frontier: evidence from Europe” Journal of Regional Science 33(1), 95-122.
Warnock, M.V. Cacdac and F.E. Warnock (2000), ‘The declining volatility of US employment: was Arthur Burns right?’, International Finance Discussion Paper No. 677, Board of Governors of the Federal Reserve System, August.
Table 1
Employment in Irish manufacturing Annual data, 1974-1999
Average 1974/75 Average 1998/99
Jobs Share Jobs Share Change
('000) (%) ('000) (%) ('000)
Panel A: All firms
Food, beverage and tobacco 61.8 0.28 47.0 0.20 -14.80
Textiles, clothing and footwear 41.9 0.19 15.0 0.06 -26.85
Paper, printing and publishing 16.5 0.08 14.3 0.06 -2.22
Chemicals, rubber, plastic 16.3 0.07 19.2 0.08 2.90
Pharmaceuticals 2.9 0.01 12.8 0.05 9.91
Iron, steel, and metal products 18.8 0.09 19.8 0.08 1.00
Ships, cars, aircraft and transport nec 11.9 0.05 12.1 0.05 0.190
Professional instruments 3.8 0.02 14.9 0.06 11.11
Office, computer equipment and electrical 15.4 0.07 54.0 0.23 38.59
Miscellaneous 27.9 0.13 25.9 0.11 -2.00
Total all firms 217.2 1.00 235.0 1.00 17.82
Panel B: Indigenous firms
Food, beverage and tobacco 43.3 0.30 34.9 0.28 -8.44
Textiles, clothing and footwear 29.4 0.21 9.1 0.07 -20.31
Paper, printing and publishing 13.8 0.10 12.5 0.10 -1.29
Chemicals, rubber, plastics 8.7 0.06 8.8 0.07 0.14
Pharmaceuticals 0.4 0.00 0.9 0.01 0.53
Iron, steel, and metal products 11.7 0.08 14.7 0.12 2.94
Ships, cars, aircraft and transport 4.3 0.03 4.4 0.04 0.09
Professional instruments 0.8 0.01 2.3 0.02 1.46
Office, computer equipment and electrical 8.2 0.06 13.2 0.11 4.99
Miscellaneous 22.9 0.16 22.2 0.18 -0.68
Total indigenous firms 143.6 1.00 123.0 1.00 -20.56
Panel C: Foreign MNEs
Food, beverage and tobacco 18.5 0.25 12.2 0.11 -6.36
Textiles, clothing and footwear 12.4 0.17 6.0 0.05 -6.54
Paper, printing and publishing 2.7 0.04 1.8 0.02 -0.93
Chemicals, rubber, plastics 7.6 0.10 10.3 0.09 2.76
Pharmaceuticals 2.5 0.03 11.8 0.11 9.38
Iron, steel, and metal products 7.1 0.10 5.1 0.05 -1.93
Ships, cars, aircraft and transport 7.6 0.10 7.7 0.07 0.10
Professional instruments 3.0 0.04 12.7 0.11 9.65
Office, computer equipment and electrical 7.2 0.10 40.8 0.36 33.59
Miscellaneous 5.0 0.07 3.715 0.03 -1.32
Table 2
Single index model of job growth and volatility
MDV R2 SEE α β
Indigenous Firms
Food, beverage and tobacco -0.843 0.43 1.825 -1.016 0.557
(2.91) (4.57)
Textiles, clothing and footwear -5.022 0.18 4.086 -5.228 0.660
(6.52) (2.49)
Paper, printing and publishing -0.400 0.23 2.275 -0.534 0.441
(1.27) (2.8)
Chemicals, rubber, plastics -0.070 0.38 3.174 -0.342 0.872
(0.53) (3.48)
Pharmaceuticals 3.881 0.00 9.380 3.838 0.137
(2.15) (0.23)
Iron, steel, and metal products 1.144 0.85 2.520 0.493 2.090
(1.02) (11.5)
Ship, cars, aircraft and transport 0.220 0.07 6.276 0.027 0.617
(0.02) (1.37)
Professional instruments 4.884 0.20 6.200 4.546 1.085
(3.68) (2.53)
Office, computer equipment and electrical 1.963 0.78 2.375 1.480 1.551
(3.27) (9.35)
Miscellaneous 0.009 0.77 2.063 -0.396 1.303
(0.96) (9.42)
Foreign MNEs
Food, beverage and tobacco -1.621 0.05 2.358 -1.678 0.181
(3.76) (1.31)
Textiles, clothing and footwear -3.346 0.01 6.749 -3.421 0.241
(2.82) (0.58)
Paper, printing and publishing -1.553 0.03 6.111 -1.670 0.375
(1.45) (0.83)
Chemicals, rubber, plastics 1.385 0.24 4.378 1.118 0.856
(1.39) (2.64)
Pharmaceuticals 7.189 0.14 4.786 6.982 0.662
(7.23) (1.95)
Iron, steel, and metal products -1.300 0.44 5.460 -1.830 1.710
(1.78) (4.8)
Ship, cars, aircraft and transport 0.172 0.08 7.786 -0.080 0.808
(0.05) (1.69)
Professional instruments 6.407 0.30 6.356 5.949 1.470
(4.97) (3.21)
Office, computer equipment and electrical 7.743 0.25 6.166 7.358 1.235
(6.11) (3.23)
Miscellaneous -1.191 0.42 4.801 -1.636 1.429
(1.88) (4.67)
Mean Indigenous firms 0.577 0.39 4.017 0.287 0.931
Mean foreign MNEs 1.389 0.20 5.495 1.109 0.897
Figure 1
Mean-variance analysis of indigenous firms and foreign MNEs
2.30 2.40 2.50 2.60
-0.50
0.00
0.50 1.00
1.50
1
2
A B
Standard
Mean job deviation of Correlation
growth job growth coefficient
(%) (%)
Indigenous firms -0.65 2.25
Foreign MNEs 1.74 2.61 0.86
1974/75: ‘A’ 0.14 2.29
1998/99: ‘B’ 0.50 2.34 Indigenous
sector
1998/99 configuration
Foreign sector
1974/75 configuration Expected
job growth
(%)
Table 3
Means, standard deviations and correlation matrix for indigenous firms and foreign MNEs in 20 sectors
Notes. The top row shows the average annual rate of job growth in each of the 10 sectors for indigenous firms and foreign MNEs in Irish manufacturing industry over the period 1974/75 to 1998/99. The second row shows the adjusted standard deviations obtained from equation (1) in the text. The next 20 rows present the correlations, and the bottom row of the Table provides the average correlation for each sector with all other sectors. The average of these latter correlations for the whole sample is .17, for indigenous sectors is .19, and for foreign sectors is .14.
FoodiTextiPaperiPharmiIroni ShipsiProffiOfficeiMisciChemsiFoodfTextfPaperfPharmfIronfShipsfProfffOfficefMiscfChemsf
Mean job growth -0.84 -5.02 -0.40 3.88 1.14 0.22 4.88 1.96 0.01 -0.07 -1.62 -3.35 -1.55 7.19 -1.30 0.17 6.41 7.74 -1.19 1.38
Standard deviation 1.82 4.03 2.37 8.41 5.30 6.09 5.71 4.48 3.17 3.06 2.11 4.95 5.88 4.05 6.44 7.44 5.51 5.32 5.92 4.66
Foodi 1.00
Textilesi 0.19 1.00
Paperi 0.43 0.20 1.00
Pharmaceuticalsi -0.24 -0.35 0.11 1.00
Ironi 0.45 0.06 0.36 0.03 1.00
Shipsi 0.16 -0.07 0.01 0.22 0.29 1.00
Professionali -0.03 -0.25 -0.16 0.10 0.46 0.08 1.00
Officei 0.35 0.00 0.17 0.15 0.80 0.11 0.56 1.00
Miscellaneousi 0.49 0.18 0.33 0.07 0.87 0.24 0.47 0.72 1.00
Chemicalsi 0.44 0.29 0.22 -0.08 0.44 -0.06 0.24 0.58 0.34 1.00
Foodf 0.33 0.35 -0.05 -0.23 0.12 0.00 -0.23 -0.03 0.18 -0.11 1.00
Textilesf 0.04 0.61 0.11 -0.32 0.03 -0.06 -0.54 -0.04 0.00 0.05 0.14 1.00
Paperf -0.07 0.38 0.13 -0.04 0.15 0.03 -0.10 -0.05 0.10 0.16 0.04 0.22 1.00
Pharmaceuticalsf -0.04 -0.64 0.13 0.28 0.34 0.00 0.59 0.40 0.24 0.03 -0.39 -0.37 -0.20 1.00
Ironf 0.33 0.38 0.47 0.15 0.52 0.19 0.01 0.44 0.52 0.57 -0.11 0.23 0.27 -0.05 1.00
Shipsf 0.15 0.10 0.38 -0.01 0.27 0.03 -0.11 0.11 0.01 0.44 -0.12 0.16 0.59 0.12 0.36 1.00
Professionalf 0.09 -0.43 0.20 0.12 0.58 0.15 0.49 0.52 0.46 -0.07 -0.17 -0.19 -0.22 0.74 -0.02 0.03 1.00
Officef -0.14 -0.54 -0.12 0.32 0.52 0.28 0.46 0.53 0.39 -0.07 -0.30 -0.16 -0.21 0.64 0.08 -0.12 0.78 1.00
Miscellaneousf 0.32 0.39 0.50 -0.26 0.60 0.03 0.07 0.49 0.57 0.21 0.30 0.24 0.25 -0.07 0.24 0.08 0.32 0.08 1.00
Chemsf 0.04 0.07 0.07 -0.19 0.60 0.07 0.47 0.60 0.44 0.24 0.09 0.14 0.03 0.32 0.01 -0.04 0.43 0.38 0.49 1.00
Figure 2
Mean-variance analysis with
5 low-technology and 5 high-technology sectors
0.01 0.02 0.03 0.04 0.05 0.06
Standard deviation of job growth
Description of Sectors in the High-Tech Low Tech Analysis
[1] Food, beverage and tobacco
[2] Textiles, clothing, leather products and footwear [3] Paper, printing and publishing
[4] Iron, steel and metal products [5] Miscellaneous
[6] Chemicals, rubber and plastics [7] Pharmaceuticals
[8] Ships, cars, aircraft and transport nec [9] Professional instruments
[10] Office computer equipment and electrical [11] Total Low-tech
Figure 3
Mean-variance analysis with
10 indigenous and 10 foreign MNE sectors
1.5 3.0 4.5 6.0 7.5
Notes. Point A is the minimum variance configuration. Point B is Ireland’s industrial configuration in 1974/75 (with mean job growth of –0.008 percent and standard deviation of 0.024), and C is its configuration in 1998/99 (with mean job growth of 0.017 percent and standard deviation of 0.030). Point D is on the efficient frontier vertically above B (with mean job growth of 0.037 percent and standard deviation of 0.024), and E is also on the efficient frontier vertically above C (with mean job growth of 0.056 percent and standard deviation of 0.030). Attracting foreign MNEs has shifted Ireland’s manufacturing industrial structure from B to C) and raised mean job growth relative to its standard deviation by a greater amount (0.025 percent) than is implied by a shift along the efficient frontier from D to E (0.019 percent).
Standard deviation of job growth (%) Expected
job growth
Table 4
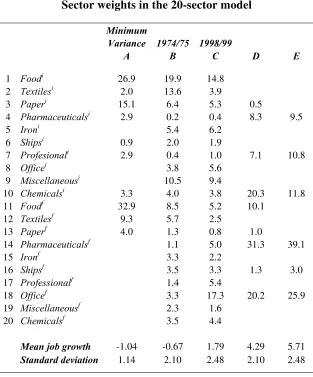
Sector weights in the 20-sector model
Minimum
Variance 1974/75 1998/99
A B C D E
1 Foodi 26.9 19.9 14.8
2 Textilesi 2.0 13.6 3.9
3 Paperi 15.1 6.4 5.3 0.5
4 Pharmaceuticalsi 2.9 0.2 0.4 8.3 9.5
5 Ironi 5.4 6.2
6 Shipsi 0.9 2.0 1.9
7 Profesionali 2.9 0.4 1.0 7.1 10.8
8 Officei 3.8 5.6
9 Miscellaneousi 10.5 9.4
10 Chemicalsi 3.3 4.0 3.8 20.3 11.8
11 Foodf 32.9 8.5 5.2 10.1
12 Textilesf 9.3 5.7 2.5
13 Paperf 4.0 1.3 0.8 1.0
14 Pharmaceuticalsf 1.1 5.0 31.3 39.1
15 Ironf 3.3 2.2
16 Shipsf 3.5 3.3 1.3 3.0
17 Professionalf 1.4 5.4
18 Officef 3.3 17.3 20.2 25.9
19 Miscellaneousf 2.3 1.6
20 Chemicalsf 3.5 4.4
Mean job growth -1.04 -0.67 1.79 4.29 5.71
Standard deviation 1.14 2.10 2.48 2.10 2.48
Figure 4
The 20-sector model with constraints
1.5 3.0 4.5 6.0 7.5 -4.0
-2.0
0.0 2.0 4.0 6.0 8.0
B C D
E
Unconstrained efficient frontier
1998/99 configuration
1974/75 configuration
Constrained efficient frontier
The figure shows the unconstrained efficient frontier along with its constrained counterpart with the following constraints imposed on the sectoral weights:
• indigenous food, beverage and tobacco: 10 and 30 percent,
• indigenous textiles, clothing, leather products and footwear: 0 and 20 percent,
• indigenous miscellaneous products: 5 and 20 percent,
• foreign MNE office, computer equipment and electrical: 0 and 20 percent, and
• all other sectors: 0 and 10 percent.
The analysis with the unconstrained frontier can be seen to carry over to the constrained case.
Standard deviation of job growth (%) Expected
job growth
Table A.1
Ireland’s 25 largest foreign MNEs
Company Products Origin Plants Jobs
Intel Ireland Ltd Microchips, computer systems US 1 4500-5000
Dell Personal computers, teleservices US 3 4000-4500
IBM Ireland Manufacturing, software, services US 4 3500-4000
Boston Scientific Ltd Medical devices US 4 2500-3000
Hewlett-Packard Ltd Printer pens, services US 6 2500-3000
Fort Dodge/Wyeth/AHP Askeaton Pharmaceuticals, baby food US 3 2500-3000
Pfizer Ireland Pharmaceuticals US 8 1500-2000
Xerox Corporation Manufacturing, services, support US 2 1500-2000
Abbott Ireland Ltd Medical devices US 7 1500-2000
Schering-Plough Pharmaceuticals US 3 1500-2000
Medtronic Ireland Ltd Medical devices US 2 1000-1500
Tyco Healthcare Medical devices US 5 1000-1500
Bausch & Lomb Ireland Contact lens US 1 1000-1500
Ericsson Systems Expertise Ltd Software development Sweden 5 1000-1500
FLS Aerospace Aircraft maintenance Denmark 1 1000-1500
Kostal Ireland GMBH Automotive, industrial electronics Germany 2 1000-1500
Microsoft European Operations Centre Applications software US 1 1000-1500
Johnson & Johnson Medical devices, pharmaceuticals US 4 1000-1500
Analog Devices B.V. Integrated circuits, components US 2 1000-1500
Hertz Europe Service Centre Ltd Car reservations US 1 1000-1500
EMC (Benelux) B.V. Data storage products US 1 1000-1500
Citigroup Credit card processing, software US 1 1000-1500
MBNA Ireland Teleservices US 2 1000-1500
Glaxosmithkline Pharmaceuticals UK 3 1000-1500
Baxter Ltd Medical devices, services US 3 1000-1500
Endnotes
i
β
1
The most common channels through which spillovers are understood to operate are demonstration effects (including the adoption of new technology, management skills and learning to export), greater competition (leading to productive efficiency), and enhanced labour productivity. Recent papers by Hejazi and Safarian (1999), Liu, Siler, Wang and Wei (2000), Buckley, Clegg and Wang (2002) and Chung, Mitchell and Yeung (2003) address many of these issues, and Blomstrom and Kokko (1998) and Gorg and Greenaway (2001) provide surveys of prior work.
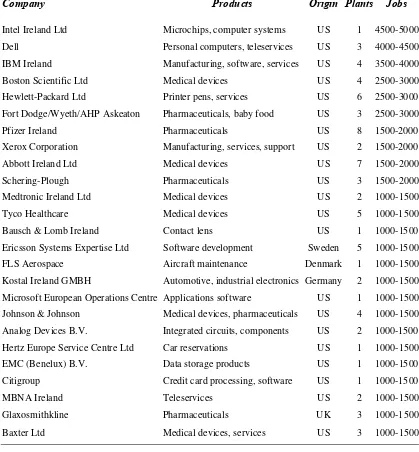
2
Table A.1 in the Appendix lists the top 25 foreign MNEs in Ireland along with their parent countries, their activities, their number of operating plants, and the jobs they have created. Many are recognizable as amongst the world’s largest companies. The Bureau of Economic Analysis (2003) estimates that the return on United States owned companies in Ireland averaged over 20 percent during 1995-2002. In 2002, foreign MNEs in Ireland employed about 129,000 workers, they spent almost $19 billions in the Irish economy, and they exported goods and services in excess of $81 billions.
3
Our analysis is, however, also relevant for individual sectors in larger countries.
4
We take average figures for the start and end dates of our data period in order to eliminate any individual year effects. We have experimented with other combinations and obtained similar results.
5
Harry Markowitz won the 1990 Nobel Prize for Economics (along with Merton Miller and William Sharpe) for his work in the development of portfolio theory. Elton and Gruber (1995) provide examples of its application in finance.
6
A similar approach was used by Abraham and Katz (1986), Palley (1992), Brainard and Cutler (1993) and Franses (1995) to examine sectoral shifts in employment, and by Byers (1990) to examine regional shifts in employment and unemployment in the United States.
7
It is conceivable that a sector’s ‘beta’ could be negative ( < 0), and this would indicate that it is evolves counter-cyclically, growing when the overall manufacturing sector declines and vice versa. This, however, is unlikely.
the growth in employment in sector i and in the overall manufacturing sector, and is the variance
of overall manufacturing employment. Thus ‘beta’ ( ) measures the extent to which a sector’s job
growth covaries with the overall manufacturing sector, and the constant term ( ) measures the extent to which a sector grows in excess of its systematic relation to the overall manufacturing sector.
9
This problem can also be solved by seeking the fastest growth rates for a given level of variance.
10 This constraint need not hold in optimizing financial portfolios, because assets can be sold short,
which implies that they have negative portfolio weights. In our analysis, however, the constraint must hold because manufacturing sub-sectors cannot have negative weights.
11
It is interesting to note that the actual rise in job growth relative to risk that was achieved in Ireland between 1974/75 and 1998/99, represented in Figure 1 by the movement from point ‘A’ to ‘B’ along the efficient frontier, is greater than what could have been achieved along the broken straight line trade-off. The job growth-risk tradeoff along the convex-shaped frontier is 7.20 (a rise of 0.36 percent in job growth divided by a rise of 0.05 percent in the standard deviation). Along the broken straight line trade-off, it is 6.64 (a rise of 2.39 percent in job growth relative to a rise of 0.36 percent in the standard deviation). This will not always hold, as the slope of the former changes but the latter has a constant slope.
12