Automated Intelligent real-time system for aggregate classi
fi
cation
Nor Ashidi Mat Isa
a,⁎
, Zamani Md Sani
b, Mohammad Subhi Al-Batah
a aImaging and Intelligent System Research Group (ISRT), School of Electrical and Electronic Engineering, Engineering Campus, Universiti Sains Malaysia, 14300 Nibong Tebal, Penang, Malaysia
bDepartment of Mechatronics Engineering, Universiti Teknikal Malaysia Melaka, Hang Tuah Jaya, 76100 Durian Tunggal, Melaka, Malaysia
a b s t r a c t
a r t i c l e
i n f o
Article history: Received 16 June 2009
Received in revised form 11 April 2011 Accepted 16 April 2011
Available online 8 May 2011
Keywords:
Aggregate classification Intelligent system Real-time system Artificial neural network Image processing Shape classification
Traditionally, mechanical sieving and manual gauging are used to determine the quality of the aggregates. In order to obtain aggregates with better characteristics, it must pass a series of mechanical, chemical and physical tests which are often performed manually, and are slow, highly subjective and laborious. This research focuses on developing an intelligent real-time classification system called NeuralAgg which consists of 3 major subsystems namely the real-time machine vision, the intelligent classification and the database system. The image capturing system can send high quality images of moving aggregates to the image processing subsystem, and then to the intelligent system for shape classification using artificial neural network. Finally, the classification information is stored in the database system for data archive, which can be used for post analysis purposes. These 3 subsystems are integrated to work in real-time mode which takes an average of 1.23 s for a complete classification process. The system developed in this study has an accuracy of approximately 87% and has the potential to significantly reduce the processing and/or classification time and workload.
© 2011 Elsevier B.V. All rights reserved.
1. Introduction
Aggregate is one of the major components in the concrete production. Granite and limestone are still the main rocks used in the aggregates production. The characteristics of the aggregates such as the shape, size and surface texture play important role in the production of high strength concrete. The properties such as the nature and the degree of the stratification of rock deposit, the type of crushing plant used and the size reduction ratio greatly influence the shape of aggregate particles and the quality of fresh and hardened concrete (Hudson, 1995; Kwan and Mora, 2001; Rajeswari, 2004). Improvement in the shape has been proven to be a major factor in the reduction of the water to cement ratio needed to produce a concrete mixture (Rao and Prasad, 2002). Similarly,Hudson (1995)has found that this high quality aggregate has the ability to decrease the cost of production and placement of concrete.
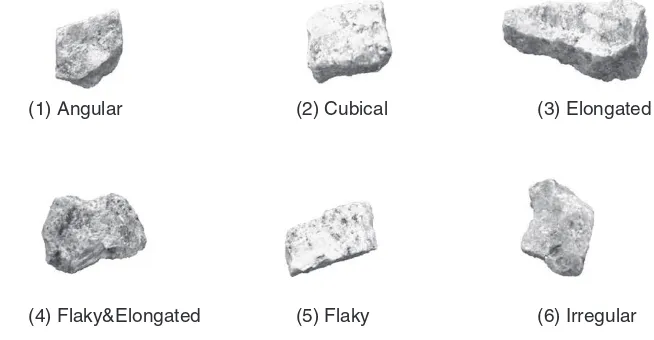
Generally, aggregates can be classified into two main classes namely, good and poor aggregates. The forms of good aggregate can be further classified into angular and cubical while those of the poor aggregate can be divided into four types namely elongated,flaky,flaky & elongated and irregular (Rajeswari, 2004; Ramli, 1991) as shown inFig. 1.
Traditionally, the size and shape analysis of coarse aggregates are done by mechanical sieving and manual gauging as detailed in the
British Standard BS812, Section 103.1 (British-Standard-Institution, 1985), BS812, Section 105.1 (British-Standard-Institution, 1989) and BS812, Section 105.2 (British-Standard-Institution, 1990). Generally, in sieving operation, known also as the“gradation analysis”, errors can be introduced due to different shapes of particles.
In order to improve the traditional classification method, numer-ous techniques using imaging systems and analytical procedures to measure aggregates' dimensions are already available; for e.g. the Multiple Ratio Shape Analysis (MRA), VDG-40 Videograder, Computer Particle Analyzer (CPA), Micromeritics OptiSizer (PSDA), Video Imaging System (VIS), Buffalo Wire Works (PSSDA), Camsizer, WipShape, University of Illinois Aggregate Image Ana-lyzer (UIAIA), Aggregate Imaging System (AIMS) and Laser-Based Aggregate Analysis System (LASS).
MRA (Jahn, 2000) is used for categorizing various particle forms found in a coarse aggregate sample. It is based on classifying aggre-gates according to their dimensional ratios into five different categories instead of one (b2:1, 2:1 to 3:1, 3:1 to 4:1, 4:1 to 5:1, N5:1). The device consists mainly of a digital caliper connected to a
data acquisition system and a computer. A particle is placed on a press table, and the press is lowered until it touches the aggregate particle and stops. The device records the gap between the press and the table, which is equal to the particle dimension. The particle is then rotated in another direction and the procedure is repeated to obtain other di-mensions. These readings are recorded in a custom-designed spread-sheet that displays the distribution of dimensional ratios in the aggregate sample.
⁎Corresponding author. Tel.: + 60 4 5996051; fax: + 60 4 5941023. E-mail addresses:[email protected](N.A.M. Isa),[email protected]
(Z.M. Sani),[email protected](M.S. Al-Batah).
0301-7516/$–see front matter © 2011 Elsevier B.V. All rights reserved. doi:10.1016/j.minpro.2011.04.009
Contents lists available atScienceDirect
International Journal of Mineral Processing
VDG-40 Videograder (Browne et al., 2001) consists mainly of a device to feed the aggregates that fall in front of a backlight and a camera to capture images. The system uses a line-scan charge-coupled device (CCD) camera to capture the image and evaluate every particle in the sample as it falls in front of the backlight. A mathematical procedure based on assuming elliptical particles is used to calculate each particle's third dimension from the two-dimensional (2D) projection images captured. All analyses and data reporting are performed in a custom software package. This system is used in the laboratory to obtain automated aggregate gradation measurements and also particleflatness and elongation.
The third system called the CPA (Tyler, 2001) is similar to the VDG-40 Videograder. The CPA uses a line-scan CCD camera to capture the image and evaluate every particle in the sample as it falls in front of the backlight. However, it can be used in the laboratory as well as on-line (continuous scanning of a product stream). The current analysis of this system focuses on the gradation and form by assuming an idealized shape for aggregate particles to obtain the third dimension from images of the 2D projection. The CPA delivers information about particle count, particle size distribution, flat and elongation and sphericity. All analyses and data reporting are performed in a specifically-tailored software package.
The PSDA was initially developed for online applications (Browne et al., 2001). The system also uses a line-scan CCD camera to capture the image and evaluate particles in a sample as it falls in front of the backlight. Similar to the image analysis system discussed earlier, an idealized shape of particles is used to provide information about the gradation and shape. All analyses and data reporting are performed in a custom-made software package.
Another system that uses a line-scan CCD camera to perform similar tasks is the VIS (Browne et al., 2001). Similar to the VDG-40 Videograder system, the VIS assumes an idealized shape of a particle to provide information on the gradation and form. All analyses and data reporting are performed in a custom-made software package.
Browne et al. (2001)also described another system called the PSSDA. Again, this system performs similar tasks of capturing the image and evaluating particles as they fall in front of the backlight. The system developed for a laboratory environment, provides information about the particles' gradation and shape. Roundness is used to describe the form and angularity of the aggregate. There are two systems available for measuring the characteristics of coarse andfine aggregates. One system is used for the analysis of coarse aggregates (PSSDA-Large) and another forfine aggregates (PSSDA-Small).
The Camsizer system consists of two optically matched digital cameras, which are used to capture images of fine and coarse aggregates at different resolutions. Individual particle exits the hopper and falls between the light source and the camera. Particles
are detected as projected surfaces and are digitized in the computer. This commercially available system automatically produces particle size distribution and provides some aspects of the particles' shape characteristics. The Camsizer measures the aggregate through their sphericity, symmetry and ratio of the length to breadth. Angularity in the Camsizer is described based on convexity.
The ninth system called the WipShape was developed for coarse aggregate analysis (Maerz et al., 1996; Maerz and Lusher, 2001; Maerz and Zhou, 2001). In thefirst version of the system, the aggregate particles are fed from a hopper into a mini-conveyor system. In a more recent version, the aggregate particles are placed in front of two orthogonal oriented synchronized cameras, which capture images of each particle from two views. These images are used to determine the three dimensions of particles. The system provides information on the aggregate's shape and gradation. The WipShape provides a measure of aggregate form by providing information on the dimensional ratio from particle images. This particular system also uses the minimum average curve radius method to quantify aggregates' angularity. The system is small-sized, which makes it only usable infield laboratories.
The UIAIA system uses three cameras to capture projections of coarse particles as they move on a conveyor belt (Rao et al., 2002). These projections are used to reconstruct three-dimensional repre-sentations of particles. The shape is determined from the measured dimensions directly without the need to assume the idealized shape of particles. The system provides information on the gradation, form, angularity and texture. The form of aggregate particles is measured by calculating the flat and elongated ratio. The UIAIA measures angularity using the outline slope method, while the aggregate's surface texture is measured using the erosion–dilation method.
The AIMS system operates based on two modules (Fletcher et al., 2002; Masad, 2005). The first module is for the analysis of fine aggregates, where black and white images are captured using a video camera and a microscope. The second module is devoted to the analysis of coarse aggregate, where gray images as well as black and white images are captured. Thefine aggregates are analyzed for form and angularity, while the coarse aggregates are analyzed for form, angularity and texture. The coarse aggregate form is determined based on a three-dimensional analysis of particles (using sphericity). The video microscope is used to determine the depth of particles, while the images of 2-D projections provide the other two dimensions. Angularity is determined by analyzing the black and white images, while texture is determined by analyzing the gray images. Two methods are used to quantify the angularity of coarse and fine aggregates. These methods are gradient angularity and radius angularity. The texture of coarse aggregate is quantified by the wavelet method.
(1) Angular
(2) Cubical
(3) Elongated
(4) Flaky&Elongated
(5) Flaky
(6) Irregular
Kim et al. (2001, 2002) reported that the LASS system was developed to characterize the size and shape parameters of coarse aggregates. A laser scanner is mounted on a linear motion slide that passes over an aggregate scattered on aflat platform, scanning the particles with a vertical laser plane. The three-dimensional (3-D) scanner data is then transformed into gray-scale digital images, where the gray scale pixel values present the height of each datum point. These heights are used to calculate aggregate characteristics. These images are used to determine parameters of form, angularity and texture.
Another three machine vision systems for aggregate classification can be found inMurtagh et al. (2005), Singh and Rao (2005) and Tessier et al. (2007). Those systems are developed for real-time applications. Generally, the systems are divided into two main stages, namely image processing and classification. The image processing stage is used to extract significant features of aggregate, while the classification stage is designed to recognize the type or quality of aggregate.
Murtagh et al. (2005) proposed a machine vision system to quantify aggregate granularity based on a multiple-scale image entropy obtained from a given image. By usingfive wavelet scales, from the B3 spline a trous redundant wavelet transform, an entropy per-scale was determined, and thus provided afive-valued feature vector for each image. For each scale, there are five features of significant structures such as the percentage of significant wavelet coefficients, the number of maxima, the number of structures (connected components of significant wavelet coefficients), the size in pixels of the largest detected structure and the entropy at each resolution scale. A gradient image is produced by using the Canny edge detector. As a consequence, another five aforementioned features are obtained from the gradient image. A new orthogonal coordinate space is determined in such a way that the spread of class means in this new space is maximized, while the compactness of classes is restrained. Then, the nearest mean classified used in the multiple Discriminant Analysis (DA) is employed to facilitate the assessment of discriminability between the classes in this feature space. The uses of the redundant wavelet transform could avoid aliasing due to decimation, since the redundant wavelet transform does not favor any orientation. As reported, for randomly chosen training sets, an average of 97% success rate on the test sets has been achieved. In the case of the smaller training and bigger test sets, an average of 95% success rate was obtained on the test sets.
Singh and Rao (2005) made use of the visual texture of ore particles, which vary with the mineral contents, to classify them. In the developed system, the visual texture of ore particles is extracted by using an image processing technique in the RGB color space. The
first-order statistical analysis such as the grayscale values and the second-order statistical analysis such as entropy, contrast, energy and homogeneity are used by the Radial Basis Function (RBF) neural network for classification purpose. The values of grayscale, entropy, contrast, energy and homogeneity for each region are different and thus they are used to distinguish among the regions representing the manganese, iron, alumina and aggregate. Overall, the developed system was significantly classified as comprising of 88.89% brown, 86.20% white and 91.04% gray windowpanes in correct classes and thus an overall accuracy of 88.71% was reached.Singh and Rao (2005) further claimed that the application of the proposed technique for ore sorting and ore classification was wider than those based on X-rays, due to itsflexibility and easy application.
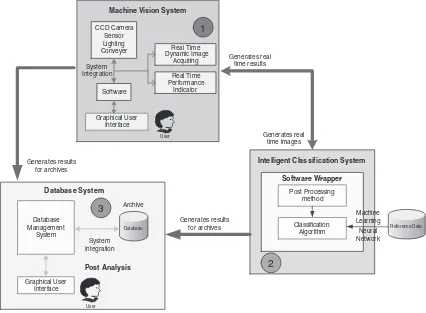
Another similar machine vision system for aggregate classifi -cation can be found in Tessier et al. (2007). In the proposed system, the Principle Component Analysis (PCA) is used to extract the color features while both Wavelet Texture Analysis (WTA) and Gray Level Co-occurrence Matrices (GLCM) are applied to quantify the texture features. To handle the dry/wet surface condition, the Discriminant Partial Least Squares (PLS-DA) regression model is
used to reduce the dimensionality of the feature space and to remove systematic variations in visual appearance caused by dry/ wet rock conditions. The Multi-class Support Vector Machine (n -SVM) is used to establish class boundaries in order to cope with the strong color and texture similarities between mineral types. The proposed approach has been claimed to produce very good results for dry minerals and promising results for wet rock mixture. In addition, the proposed approach can be possibly applied to other heterogeneous mineral systems showing strong color/texture similarities between mineral classes and systematic variations in visual appearance such as dry/wet surface conditions. Based on the promising capabilities employed by those aforemen-tioned classification systems for aggregates, this paper will introduce an online system called NeuralAgg which can perform real-time image capturing, automatic image processing, intelligent classification and data archiving for aggregates. It consists of 3 different subsystems namely the real-time machine vision system, the intelligent classifi -cation system and the database system. These subsystems are integrated together to work as a real-time aggregate shapes classification system. The block diagram for the 3 integrated sub-systems is shown inFig. 2.
2. System design
The system developed in the present study is designed to function as a real-time classification model. It consists of 3 subsystems and is integrated to function as a single system.
2.1. Machine vision system development
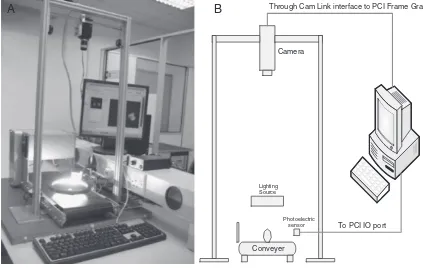
As shown inFig. 2, the mechanical prototype of thefirst subsystem of the NeuralAgg consists of a conveyor, a charge-coupled device (CCD) camera, light emitting diode (LED) lights, photoelectric sensor and personal computer which is developed to perform the machine vision task. The conveyor is used to transport the aggregates for the image acquiring process. UNIQ UC800CL camera, a 1024× 776 full frame resolution digital CCD, global shutter with 45 frames per second (fps) is chosen for the camera hardware for the system. With its cam link interface, it has the advantage of high data rate transfer though the bus up to 510 MB/s which could avoid any bottle neck issue related to the image transfer prior to the processing. In addition, the camera uses the progressive scanning technology which is suitable to capture moving aggregates on the conveyor. For the connection between the camera and the computer, a X64-CL iPro, a compatible frame grabber is used. The frame grabber is a highly versatile PCI frame grabber, which is capable of acquiring images from two independent Base or one Medium Camera LinkTM camera and is also able to perform image transfers at rates up to 528 MB/s. A photoelectric sensor with a retro-reflective method is used to sense the presence of the aggregates for the image acquiring process. Dedicated illumination and optical system are very crucial and the LED is chosen to illuminate the aggregates. A dark-field method is used for lighting where it illuminates from a point parallel to its surface. This would make the texture and other high angle features appear bright while most of the objects appear dark. With all of these equipments and methods' selection, a prototype is developed as shown inFig. 3.
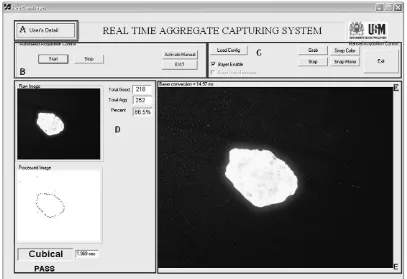
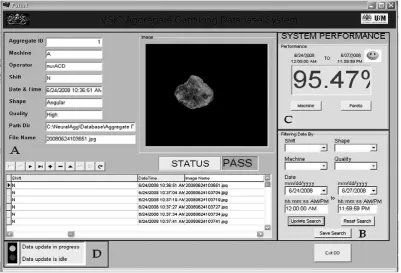
The GUI (seeFig. 4) is designed for user-friendly environments to control the hardware on the machine vision system. Two options are given to the user: performing the image acquiring process either automatically (Section B inFig. 4) or manually (Section C inFig. 4). The system indicator for the real-time result on the performance of the system is also displayed on the main system of the GUI.
The GUI of the system contains 5 sections as follows:
Section B –For the automated control of the process where automated operation should be the best case. This would be the default condition for the process.
Section C –For the manual control for the engineer or higher level users to do the debugging or manual operation as needed where access will be restricted.
Section D–The display windows for the user on the real time image capturing, image acquiring and the result of the classifi -cation process together with the total numbers of aggregates being captured.
Section E –Live camera view for the vision system.
2.2. Intelligent classification system
After the image is captured by the vision system, it will be sent to the second subsystem which is the intelligent classification system. It consists of image pre-processing, features extraction and classification process (John, 2002; Miguel and Rodriguez, 2004; Myler and Weeks, 1993; Gonzalez and Richard, 2002).
Firstly, the image will go through the image segmentation and clustering process to differentiate between the aggregate and background of the image. After that, a feature extraction process will be performed to extract the Hu (Hu, 1962) and Zernike (Pejnovic et al., 1992) moments from both aggregate's area and boundary. Then, the feature selection techniques will be implemented in order to analyze and determine the suitable features for aggregate recognition. Finally, the neural network will be used for the classification process. A total of 1704 aggregate images have been captured; i.e. 852 aggregate images as good shapes (cubical and angular) and 852 as poor shapes (irregular, elongated,flaky andflaky&elongated). Then, the captured images are implemented with pre-processing tech-niques in order to increase their quality and contrast, and features
extraction technique to extract significant features for classification purpose.
The pre-processing stage consists of segmenting the image automatically using an iterative thresholding method, followed by growing and shrinking processes to provide a clear and better separation between object and background (Low and Ibrahim, 1997). In the feature extraction stage, one of the real challenges in this study is using the geometrical moments for features extraction in aggregate shape classification. The Hu and Zernike moments are chosen as their invariance property against geometrical transforma-tions like scaling, translation and rotation, making it a good candidate feature extractor to be used for aggregate recognition (Hu, 1962; Pejnovic et al., 1992; Al-Batah et al., 2009). Based on this argument, two sets of seven Hu and nine Zernike moment invariant functions are computed; one set derived from the area (ϕ1−ϕ7,Z1−Z9) and the other from the boundary (ϕ1P−ϕ7P,Z1P−Z9P).ϕiandZiare thei-th Hu and Zernike moments respectively, which are extracted from the area. On another hand,ϕiPandZiPare thei-th Hu and Zernike moments respectively which are extracted from the boundary. With respect to this condition, a 32-feature vector is generated.
Having extracted the 32 features, the next step is undertaken to determine the useful and important features using feature selection techniques. In search of the optimum features, the Discriminant Analysis (DA) is used as a feature selection tool for handling the problem of aggregate recognition. The DA is a very popular supervised learning technique (Hand, 1981). The DA is fast, easy to implement and readily available in statistical packages. In this study, this analysis is employed in order to eliminate the noisy and insignificant extracted features to be used for the aggregate shape recognition or classifi ca-tion stage. In the DA technique, the Ward's Linkage method with univariate and multivariate tests are applied, which is capable to remove those insignificant features; leaving only features that can be said to be the optimum or significant features for aggregate shape CCD Camera
recognition. After implementing the DA technique using the SPSS software, from the original 32 features extracted, 8 optimum features have been chosen as the significant features for aggregate shape recognition. The 8 optimum features areϕ1,ϕ2P,ϕ3,ϕ4,Z1,Z1P,Z2Pand Z6. The 8-feature vector has been constructed which is sent to the neural network for the recognition phase.
In the past few decades, research on neural networks had shown great efforts in unraveling the unexplored in various areas of science, engineering, industrial and other disciplines. One of the most common applications of neural networks is pattern classifi -cation. In addition, the most commonly used neural network architecture is perceptron, especially the Multilayered Perceptron (MLP). Some popular applications of perceptron-based networks in recognition tasks can be found in (Marinai et al., 2005; Hippert et al., 2001; Sava et al., 1996; Marcialis and Roli, 2005). The successfulness of applying perceptron-based networks in pattern recognition had drawn out the strong interest in this study to use it for aggregate shape classification.
One of the main imperfections associated with the MLP lies on its highly non-linear nature. The MLP with non-linear activation function is highly non-linear in unknown parameters. The non-linear activa-tion funcactiva-tion plays an important role in MLP for it to be a universal function approximator. However, it makes the MLP difficult to be trained. The learning algorithm must be based on the non-linear optimization technique, resulting in slow parameters' convergence, intensive computation and poor local minima. Also, the error function or the non-linear activation function must be able to be differentiated when applying a gradient descent learning algorithm.
In order to reduce the highly non-linear nature,Mashor (2000) introduced a modified version of the MLP network called the Hybrid Multilayered Perceptron (HMLP). In the HMLP network, extra connections are added to link between the input layer and output layer. By connecting the network inputs directly to the output nodes, a linear model is formed in parallel with the non-linear conventional MLP architecture.Fig. 5shows the architecture of an HMLP with one hidden layer. Based on Mashor (2000), the HMLP network with
connections across layers offers more degree of freedom than the conventional MLP network. Hence, it is proven to be more robust than the conventional MLP where fewer hidden nodes are needed to solve the same problem. This is due to the linear cross layer connection between the input and output layers which is useful when approximating the linear portion of the problem.
Generally, the outputs of HMLP network are the combination of both linear and non-linear connections. Non-linear connections consist of the conventional MLP output with a non-linear activation function such as sigmoid activation function. Linear connections consist of the cross layer connections that are attached directly from input nodes to output nodes. When solving real world problems, we will never know how the output response is to be produced, with respect to the given set of inputs without any prior knowledge. Hence, solving linear problem using a non-linear model like the MLP can never be better than using a linear model. Despite the fact that the linear problem can be solved easily, by using the SLP or MLP with the linear activation function (though the MLP with linear activation function can be reduced to SLP), we cannot foresee the type of problem to be solved. Thus, the HMLP with cross layer connections is the best solution for both linear and non-linear problems (Mashor, 2000).
As proof, several empirical studies have been carried out to show the superiority of HMLP over the conventional MLP (Dahlan et al., 2009; Wan-Mamat et al., 2008; Mat-Isa et al., 2008a,b; Mat-Isa et al., 2004; Mashor et al., 2004).Mat-Isa et al. (2008a, 2008b)showed that the HMLP can reach its optimum structure with fewer hidden nodes when solving the same problem compared with the conventional MLP. Small structure indicates that the HMLP possesses a superior generalization capability. Thus, it can properly handle a new input data that were not used in the training process and increase the accuracy of the predicted output. In addition, Mashor (2004) further demonstrated that the HMLP outperformed other types of neural networks such as the RBF in system identification tasks. A study on the HMLP with more than one hidden layers by
Wilamowski (2009) has also concluded that the HMLP is more
powerful than the conventional MLP. Conveyer
Lighting Source
Camera
Photoelectric sensor
Through Cam Link interface to PCI Frame Grabber
To PCI IO port
A
B
Based on the abovementioned promising capabilities of neural networks as an intelligent pattern classifier tool and better perfor-mance produced by HMLP over conventional MLP, in this study, the HMLP network is proposed for handling the aggregate classification problem. As shown inFig. 5, formoutput nodes, the output of the HMLP network is given by:
ˆ ykð Þt = ∑
nh
j= 1 w2jkF ∑
ni
i= 1
w1ijxið Þt +b1j
+ ∑
ni
i= 0
wlikxið Þt; for 1≤j≤nhand 1≤k≤mð1Þ
wherewij1,wjk2andwikl denote the weights of the connection between input and hidden layers, weights of the connection between hidden and output layers, and weights of the linear connection between input
and output layers, respectively.bj1andxidenote the thresholds in hidden nodes and inputs that are supplied to the input layer, respectively. ni,nh, and m are the number of input nodes, hidden nodes and output nodes respectively.F(•) is an activation function and is normally be selected as a sigmoid function.
The recursive prediction error (RPE) derived by Ljung and Soderstorm (1983), was modified byChen et al. (1998)to train the MLP network. The RPE algorithm is a Gauss–Newton type algorithm and it has been shown byBillings et al. (1990)that the algorithm is much better than the back propagation algorithm with the momen-tum constant. To handle the additional linear connections for the HMLP network, a modified version of the RPE algorithm called the modified recursive prediction error (MRPE) algorithm is introduced (Mashor, 2000). The MRPE algorithm can provide faster convergence rate and betterfinal convergence values of weights and thresholds for the HMLP network.
In this study, the effectiveness of the HMLP trained with the MRPE algorithm is proven through the comparison with the DA and two conventional neural networks namely the Radial Basis Functions (RBF) and the MLP network. As mentioned, the DA with the Ward's Linkage method is used. RBF and MLP networks are used as these two neural networks are commonly used as a benchmark neural networks-based classifier for the pattern classification application (Eklund and Hoang, 2002, 2006). As compared to the HMLP network that can represent both linear and non-linear functions, RBF and MLP networks are highly non-linear neural networks. For fair comparison, the number of hidden layer for HMLP, RBF and MLP networks, is set to one. For all classifiers, 50% of the training examples are selected at random from the entire data set and the remaining 50% of the data are used as testing data to determine the performance of the network.
Table 1 shows the performance for the DA, RBF, MLP and HMLP
networks, using 1704 data based on 8 features selected using the DA technique. The highlighted feature of the present comparison is to determine the best classifier to represent the real time for
Fig. 5.One-hidden layer HMLP network.
aggregate classification. For performance comparison purpose, the percentage of the correct classification (or accuracy) for the good aggregate (Accgood), poor aggregate (Accpoor) and overall (Accoverall) are employed, which are defined as follows:
Accgood=
number of good aggregates correctly classified
total number of good aggregates ð2Þ
Accpoor=
number of poor aggregates correctly classified
total number of poor aggregates ð3Þ
Accoverall=
number of poor and good aggregates correctly classified total number of aggregates
ð4Þ
As tabulated inTable 1, the accuracy percentage achieved by using the HMLP network is significantly better as compared to other classifiers. Over the whole classifiers, the best accuracy rate achieved is 85.52% using the HMLP as compared with those from the DA, RBF and MLP which are 81.75%, 82.88% and 84.73%, respectively. From the results, marginal improvements were obtained using the combination of linear and non-linear classifiers (HMLP network) as compared to other methods. The improvements of accuracy recorded are 3.70%, 2.64% and 0.79% sourced from the DA, RBF and MLP respectively.
The results also show that the HMLP is the best classifier to further classify the aggregates into good and poor shapes with high performance for each shape. From the comparison made on the
whole networks, the HMLP performs better than other classifiers with the recorded accuracy 86.53% and 84.52% for good and poor shapes, respectively.
3. Database system
The database is proposed as a data storage system where all the classification information will be archived. The database is designed to be a local single-tier application. The information archived can be used for post studies on the performance of the crusher machine or the strength of the concrete produced. The database system GUI is shown inFig. 6.
The Database GUI contains 4 sections to be used as follows:
Section A –To view the data information in the database by using the navigator button.
Section B –The combination of the data control component for data
filtering purpose and the retrieval of the raw data for analysis. Users can select any combination option in the
filtering and save the data. The raw data can be opened by using Microsoft Excel software for thorough analysis. Section C–Results display area as the indicator for the quality of
concrete or its performance for the aggregates machine producer could be retrieved for any interval time selected from the Section Bfiltering options.
Section D–Indicator to alert user, if the updating process is “in progress”.
4. Systems integration
Generally, all three aforementioned separate subsystems use the scanning folder method to detect any new activity before the task can be started, or else it will remain idle. Textfile is the crucial medium for updating all the information. The updating process happens in a zigzag mode within the 2 systems (i.e. the real-time machine vision and intelligent systems) and is sent to the database system for storage.
Table 1
Performance comparison between DA, RBF, MLP and HMLP for aggregate shape classification.
Classification type DA RBF MLP HMLP
Accgood 83.20 83.95 85.81 86.53
Accpoor 80.30 81.81 83.64 84.52
Accoverall 81.75 82.88 84.73 85.52
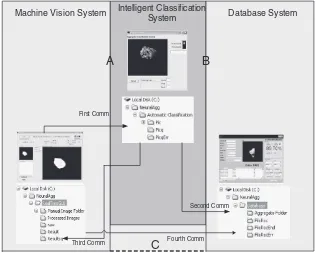
Four different communications happen between the applications when running in full mode as shown inFig. 7. The processflow of the system is shown inFig. 8.
4.1. Integration of vision system with intelligent classification system
For the integration of these two systems, a two way communica-tion is designed, where both systems need to update the informacommunica-tion in the textfile before being sent to the database. Firstly, a template needs to be created by the user to save the initial information on the operator's details. The information includes the Operator ID, Machine ID and Shift information, which will then be saved to a dedicated folder. The content will be copied to the new textfile created for test information updates of the image acquisition and classification processes.
In thefirst communication as shown in Section (A)Fig. 7, a folder is used for temporary storage and is scanned for new image periodically. Once a new image is saved in the folder, a textfile will be created and appended. The textfile contains information for Date, Time, Image Name, and T (i.e. time when the image is captured). Prior to that, the user's information from the templatefile has already been copied into the textfile.
It will then process the image and append more information such as the prediction output value from the classification engine, Shape, Quality, Status, End Time (consists of date and time when completed), Time stamp when image processing starts, Image Processing Time, Feature Extraction time, Classification time and Time stamp when the image processing time, will be appended again in the corresponding image's text file. A copy of the image is converted to the Joint Photographic Engineering Group (JPEG) format and sent to the database application as shown in the second communication in Section (B)Fig. 7.
The vision system also uses the same method in the third communication as shown in Section (A)Fig. 7. The result folder is scanned periodically for any new result sent out by the classification system. A processed BMP image for the post-processing result is saved to the processed images' folder later for display.
In the last communication, which is the fourth communication, the vision system will record the final time stamps T2, when the classification is completed. As shown in Section (C) inFig. 7, it will then extract theT1value (time when image is acquired) from the image's textfile and calculate the interval between the two times. The interval of this process would be the time needed for the complete automated classification process as shown in Eq.(5). BothT2and time interval are the last information appended to the corresponding text
file and then they are sent to the database system for the data archive.
Real Time Complete Process =T2–T1 ð5Þ
whereT1is the time stamp when the image is acquired in secondsT2is the time stamp when the classification completes and the result is displayed to the GUI vision system.
4.2. Database system integration
A folder is created and being monitored by the database software periodically. For any new textfile detected, the program will scan and extract all the information and then arrange it accordingly to the rows and columns in the database table. It will then use the converted JPEG image for the display purpose.
5. Results and discussions
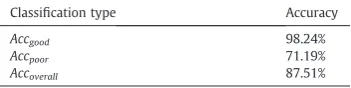
A total of 1690 aggregates (where the images are acquired automatically on the conveyor) have been used to analyzed the system accuracy and the system time latency. From 1690 samples, 1020 are good aggregates while another 670 are poor aggregates. This dataset is different as compared to the static data in the System Design, Section II, Sub-section 2, paragraph 3, which are used for the complete testing purpose. With the PC configuration at Core2Duo, 1.80 GHz CPU speed with 3 Gigabyte RAM, the real-time classification accuracy of the aggregates are tabulated inTable 2. The system latency time is defined from the image acquired until the result is displayed at the machine vision GUI.
Third Comm
Second Comm First Comm
Machine Vision System
Intelligent Classification
System
Database System
A
B
Fourth Comm
C
Based on the results tabulated inTable 2, the developed system has been proven to have high capability to classify the aggregate in real-time situations with accuracy up to 87.51%. The NeuralAgg system has the capability to capture the moving aggregate and simultaneously classify its quality. Although, the NeuralAgg system produces a slightly low accuracy for poor aggregate classification (i.e. 71.19%),
it is capable to demonstrate high accuracy for classification of good aggregate with the percentage up to 98.24%.
The timing study analysis is employed to determine the average time needed for the processes which can be used to predict the output result for the next classification process. Furthermore, it is a method to compare and check the process that contributes to longer time, which later can be improved towards time reduction. The results obtained from the time stamp on each of the process and the breakdowns based on its processes are tabulated inTable 3.
From the results inTable 3, the system latency time lies at the average of 1228 ms. In this analysis, the real-time imaging time is acquired from the trigger event that starts the process, image acquisition, image transfer to frame grabber and image transfer to the processor, which totally requires 174 ms. From the average result, the process for the real-time imaging can be considered really fast by using the hardware selected. The remainders of the time captured in the system latency, which exclude the real-time imaging and image processing time, is the time needed for the result information to be passed back to the vision system software for the result to be displayed.
6. Conclusion
It is highly desirable to have an automated machine vision system which can perform the monitoring and real-time feedback. The machine vision system developed in this study is able to capture dynamic images for image pre-processing and the classification process. Overall, the images captured are of high quality, where the object is sharp and can clearly be differentiated with its background thereby facilitating the image processing and classification process. In addition, a database system has been developed to archive all the information related to the classifi ca-tion process. It can be used by the user as a center to retrieve and study all the data for the post-studies and analysis. In addition, the utilities developed in this study can speed up data-crunching. The conventional method for data archive by using the paper records can be replaced with the developed electronic database. This electronic database does not deteriorate through time. Finally, an online system which consists of 3 different subsystems such as the machine vision, classification and database systems has been successfully developed in this study. These 3 subsystems have been integrated to work together to automatically capture images and to classify and archive all the data. The average time needed to complete a classification process for one aggregate is 1.23 s. As an extension of this study, our future plan is to introduce a more intelligent neural network which could produce a shorter processing time with better classification performance.
References
Al-Batah, M.S., Mat-Isa, N.A., Zamli, K.Z., Sani, Z.M., Azizli, K.A., 2009. A novel aggregate classification technique using moment invariants and cascaded multi-layered perceptron network. International Journal of Mineral Processing 92 (1–2), 92–102. Billings, S.A., Jamaluddin, H.B., Chen, S., 1990. A comparison of the back propagation and recursive prediction error algorithms for training neural networks. International Journal of Control, Mechanical System and Signal Processing 5 (3), 233–255.
Image acquisition Copy information from template and create new text file by vision system
GUI
Image send to classification engine and process
Complete?
Send processed BMP to vision system GUI Text file update by classification
engine
Display at vision system GUI Text file update by vision system
GUI
Send text file to database for storage
End
No
Yes
Send JPEG file to database
A
B
C
User key in user’s detail in vision system GUI in
template text file Start
Fig. 8.Processflow of the system.
Table 3
Average latency time for the image processing and classification.
Process average Latency time (ms)
Real-time imaging 174
Image processing time 228
Feature extract time 577
Classification time 10
Total image processing time 815
System latency 1228
Table 2
The performance of the NeuralAgg system for real-time aggregate classification.
Classification type Accuracy
Accgood 98.24%
Accpoor 71.19%
British-Standard-Institution, 1985. Testing aggregates: Methods for determination of particle shape. Sieve Test. (British Standard BS 812: Section103.1). British Standard Institution, London.
British-Standard-Institution, 1989. Testing aggregates: Methods for determination of particle shape. Flakiness index. (British Standard BS 812: Section105.1). British Standard Institution, London.
British-Standard-Institution, 1990. Testing aggregates. Methods for determination of particle shape. Elongation index of coarse aggregate. (British Standard BS 812: Section105.2). British Standard Institution, London.
Browne, C., Rauch, A.F., Haas, C.T., Kim, H., 2001. Comparison tests of automated equipment for analyzing aggregate gradation. Proceedings of the 9th Annual Synposium of the International Center for Aggregate Research (ICAR), Austin, Texas, USA.
Chen, S., Billings, S.A., Grant, P.M., 1998. A parallel recursive prediction error algorithm for training layered neural network. International Journal of Control 51 (6), 1215–1228.
Dahlan, N.Y., Kasuan, N., Ahmad, A.S., 2009. Modelling of various meteorological effects on leakage current level for suspension type of high voltage insulators using HMLP neural network. IEEE Symposium on Industrial Electronics & Applications, 2009 (ISIEA 2009) 35–40.
Eklund, P., Hoang, A., 2002. A performance survey of public domain machine leaning algorithms. School of Information Technology, Griffith University, Technical Report. Eklund, P., Hoang, A., 2006. A comparative study of public supervised classifier performance on the UCI database. Australian Journal of Intelligent Information Processing Systems 9 (1), 1–39.
Fletcher, T., Chandan, C., Masad, E.A., Sivakumar, K., 2002. Measurement of aggregate texture and its influence on HMA permanent deformation. Journal of Testing and Evaluation 30 (6), 524–531.
Gonzalez, C.R., Richard, E.W., 2002. Digital image processing, 2nd Edition. Prentice-Hall, New Jersey.
Hand, D.J., 1981. Discimination and classification. John Wiley and Sons, New York. Hippert, H.S., Pedreira, C.E., Souza, R.C., 2001. Neural networks for short-term load
forecasting: A review and evaluation. IEEE Transactions on Power Systems 16, 44–55.
Hu, M.K., 1962. Visual pattern recognition by moment invariants, computer methods in image analysis. IEEE Transaction on Information Theory 8 (2), 179–187. Hudson, B., 1995. The effect of manufactured aggregate and sand shape on concrete
production and placement. Auckland, Svedala New Zealand Limited.
Jahn, D., 2000. Evaluation of aggregate particle shapes through multiple ratio analysis. Proceedings of the 8th Annual Symposium of the International Center for Aggregate Research (ICAR), Denver, USA.
John, C.R., 2002. The image processing handbook, 4th Edition. CRC Press LLC. Kim, H., Haas, C.T., Rauch, A.F., Browne, C., 2001. A prototype laser scanner for
characterizing size and shape properties in aggregate. Proceedings of the 9th Annual Synposium of the International Center for Aggregate Research (ICAR), Austin, Texas, USA.
Kim, H., Haas, C.T., Rauch, A.F., 2002. Artificial intelligence based quality control of aggregate production. Proceedings of the 19th International Symposium on Automation and Robotics in Construction (ISARC), Maryland, USA 369–374. Kwan, A.K.H., Mora, C.F., 2001. Effects of various shape parameters on packing of
aggregate particles. Magazine of Concrete Research 53 (2), 91–100.
Ljung, L., Soderstorm, T., 1983. Theory and Practice of Recursive Identification. MIT Press, Cambridge, Massachusetts.
Low, B.K., Ibrahim, M.K., 1997. A fast and accurate algorithm for facial feature segmentation. International Conference on Image Processing 2, 518–521. Maerz, N.H., Lusher, M., 2001. Measurement offlat and elongation of coarse aggregate
using digital image processing. Proceedings of 80th Annual Meeting on Transpor-tation Research Board. paper no. 01–0177. Washington D. C. USA.
Maerz, N.H., Zhou, W., 2001. Flat and elongated: advanced using digital image processing. Proceedings of the 9th Annual Synposium of the International Center for Aggregate Research (ICAR). Austin, Texas, USA.
Maerz, N.H., Palangio, H., Franklin, J.A., 1996. WipFrag image based granulometry system. Proceedings of the FRAGBLAST 5, Workshop on Measurement of Blast Fragmentation. 91–99. Montreal, Canada.
Marcialis, G.L., Roli, F., 2005. Fusion of multiplefingerprint matchers by single-layer perceptron with class-separation loss function. Pattern Recognition Letters 26, 1830–1839.
Marinai, S., Gori, M., Soda, G., 2005. Artificial neural networks for document analysis and recognition. IEEE Transactions on Pattern Analysis and Machine Intelligence 27, 23–35.
Masad, E.A., 2005. Aggregate Imaging System (AIMS): basics and applications. Report 5 1707-01-1. Texas Transportation Institute, USA.
Mashor, M.Y., 2000. Hybrid multilayered perceptron networks. International Journal of Systems Science 31, 771–785.
Mashor, M.Y., 2004. Performance comparison between HMLP, MLP and RBF networks with application to on-line system identification. Proceedings of IEEE Conference on Cybernetics and Intelligent Systems 1, 643–648.
Mashor, M.Y., Osman, M.K., Arshad, M.R., 2004. 3D object recognition using 2D moments and HMLP network. Proceedings of International Conference on Computer Graphics, Imaging and Visualization 126–130 (CGIV 2004).
Mat-Isa, N.A., Mashor, M.Y., Othman, N.H., 2004. Classification of cervical cancer cells using HMLP network with confidence percentage and confidence level analysis. International Journal of the Computer, The Internet and Management 11, 17–29. Mat-Isa, N.A., Al-Batah, M.S., Zamli, K.Z., Azizli, K.A., Joret, A., Noor, N.R.M., 2008a.
Suitable features selection for the HMLP and MLP networks to identify the shape of aggregate. Construction and Building Materials 22 (3), 402–410.
Mat-Isa, N.A., Mashor, M.Y., Othman, N.H., 2008b. An automated cervical pre-cancerous diagnostic system. Artificial Intelligence in Medicine 42 (1), 1–11.
Miguel, A., Rodriguez, V., 2004. Features extraction and image processing. The Computer Journal 47 (2), 271.
Murtagh, F., Qiao, X., Crookes, D., Walsh, P., Muhammed-Basheer, P.A., Long, A., Starck, J. L., 2005. A machine vision approach to the grading of crushed aggregate. Machine Vision Applications 16 (4), 229–235.
Myler, H.R., Weeks, A.R., 1993. The pocket handbook of imaging processing algorithms in C. Prentice Hall, New Jersey.
Pejnovic, P., Buturovic, L., Stojiljkovic, Z., 1992. Object recognition by invariants. Proceeding of the 11th IAPR International Conference on Pattern Recognition 2, 434–437. Rajeswari, S. R. 2004. Studies on the production and properties of shaped aggregattes
from the vertical shaft impact crusher, MSc Thesis, Universiti Sains Malaysia, Penang, Malaysia.
Ramli, M., 1991. Concrete and building technology. Ministry of Education, Malaysia, Dewan Bahasa dan Pustaka.
Rao, G.A., Prasad, B.K.R., 2002. Influence of the roughness of aggregate surface on the interface bond strength. Cement Concrete Research 32, 253–257.
Rao, C., Tutumluer, E., Kim, I.T., 2002. Quantification of coarse aggregate angularity based on image analysis. Transportation Research record 1787,Transportation Research Board. National Research Council, Washington D. C., USA. 117–124. Sava, H.P., Grant, P.M., McDonnell, J.T.E., 1996. Spectral characterization and
classification of Carpentier-Edwards heart valves implanted in the aortic position. IEEE Transactions on Biomedical Engineering 43, 1046–1048.
Singh, V., Rao, S.M., 2005. Application of image processing and radial basis neural network techniques for ore sorting and ore classification. Minerals Engineering 18, 1412–1420.
Tessier, J., Duchesne, C., Bartolacci, G., 2007. A machine vision approach to on-line estimation of run-of-mine ore composition on conveyor belts. Minerals Engineer-ing 20, 1129–1144.
Tyler, W.S., 2001. Particle size and shape analyzers (CPA). Product Brochure, Ohio, USA. Wan-Mamat, W.M.F., Mat-Isa, N.A., Zamli, K.Z., Wan-Mamat, W.M.F., 2008. Hybrid version of MLP neural network for transformer fault diagnosis system. Interna-tional Symposium on Information Technology, 2008 (ITSim 2008) 1–6. Wilamowski, B.M., 2009. Neural network architectures and learning algorithms.