EISSN: 2086-4094 DOI: 10.4308/hjb.18.4.182
The Growth of Body Size and Somatotype of Javanese
Children Age 4 to 20 Years
TETRI WIDIYANI‡∗∗∗∗∗, BAMBANG SURYOBROTO, SRI BUDIARTI, ALEX HARTANA
Department of Biology, Faculty of Mathematics and Natural Sciences, Bogor Agricultural University, Darmaga Campus, Bogor 16680, Indonesia
Received September 26, 2011/Accepted December 29, 2011
Growth of body size (body height and body weight) and somatotype in 363 girls and 299 boys aged 4 to 20 years of ethnic Javanese lived in Magelang Regency Indonesia were studied cross-sectionally. Over half of them were categorized in the well-off family, therefore underweight or underfat prevalence in our subjects was low (14.3%) but overweight and obesity prevalence was also low (14%). They were shorter and lighter than reference children from U.S., Japan and Yogyakarta but they improved when compared with those of the same ethnic of Bantul and with the different ethnic of rural India. There was a clear age-related change of their somatotype. At age 4 years, the physique of children subjects in both sexes is found to be mesomorph-endomorph. Thereafter it is transformed into ectomorphic-endomorph in girls and to mesomorph-ectomorph in boys at the age of 20 years. In girl subjects, the onset of puberty was characterized by an acceleration of endomorphy component at age 8 years. While in our boys it was characterized by an acceleration of ectomorphy since age 9 years. The different growth pattern of somatotype components showed that the use of BMI as an indicator of fatness in children should be reassessed.
Key words: growth, Javanese children, body size, body mass index, somatotype
___________________________________________________________________________
_________________
‡Current address: Department of Biology, Faculty of
Mathematics and Natural Sciences, Sebelas Maret University, Jalan Ir. Sutami 36 A, Surakarta 57126, Indonesia
∗ ∗ ∗ ∗
∗Corresponding author. Phone/Fax: +62-271-663375,
E-mail: [email protected]
INTRODUCTION
Numerous studies have been carried out in Indonesia to evaluate variations of the principal anthropometric characteristics in relation to growth (Adhianto & Soetjiningsih 2002; Puspita 2004; Rahmawati et al. 2004; Waters et al. 2004; Artaria & Henneberg 2007; Hermawan 2007; Miharja 2008; Tuan & Nicklas 2009; Aryo 2011). Growth is the best global indicator of children’s well-being. It is the single measurement that best defines the health and nutritional status of children, just as it provides an indirect measurement of the quality of life of an entire population (de Onis & Blössner 2003). During the human growth, the body changes significantly in size and shape (Kalichman & Kobyliansky 2006). Body weight and body height are the main dimensions of body size.
Based on the 2-component model of body composition (Ellis 2000), body weight consists of fat mass and fat free mass. Fat mass is the most variable component of the body. A common indicator for fat mass is body mass index (BMI) (Dietz & Bellizzi 1999; Chakraborty et al. 2009; Kulkarni et al. 2010), which is defined by World Health Organization (WHO) as a simple index of weight-for-height (http://apps.who.int/bmi/index.jsp). It has been recommended as the best measurement for monitoring overall body adiposity in the majority of large-scales studies although BMI does not singly quantitate body
fat as it amalgamates frame size (which reflects mineral content) and lean tissue (Roemmich et al. 1997; Fields & Goran 2000). On the other hand, skinfold thickness is widely used as a measure of fatness (Norgan 2005). It has most of the characteristics of a good field method to measure level of fatness because it directly measures subcutaneous fat layers. Nevertheless, a study of body weight and height only is not always sufficient enough to produce complete information regarding child physique and growth (Özener & Duyar 2008).
Indonesia has a wide variety of ethnological groups so it is important to carry out research into the growth of body size and somatotype. In the present study, we selected children from the Javanese population in Magelang Regency. The purpose of the study is to evaluate growth of body size (height and weight) and somatotype in the Javanese children aged 4 to 20 years from Magelang Regency. The growth of body size of the Magelang children is compared to that of several reference populations. Data recommended by the 2002 National Health Examination Surveys (NHES) and National Health and Nutrition Examination Surveys (NHANES) reference population (NHES & NHANES 2002) are the most suitable for use as an international growth reference (Bener & Kamal 2005). We also used reference children living in Japan (Kimura 1984), India (Venkaiah et al. 2002), and Indonesia (Bantul and Yogyakarta) (Rahmawati et al. 2004).
MATERIALS AND METHODS
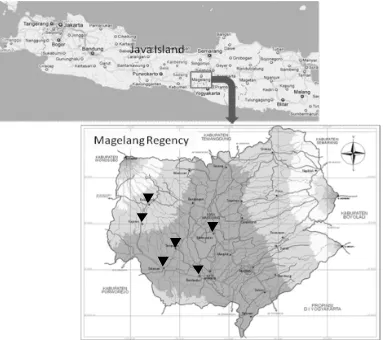
Subjects. The subjects were ethnic Javanese lived in Magelang Regency. Magelang Regency is mainly a rural region with a land area of 1,085.73 km2 comprised of 21
sub-districts. The regency is located in the Kedu Plain between Mount Merbabu, Mount Sumbing and Mount Merapi in Central Java, Indonesia (Figure 1). It has an average elevation of about 360 meters above sea level. The regency is located 43 km north of Yogyakarta and
75 km south of Semarang, the capital of Central Java. According to the Indonesia’s Central Agency on Statistics (BPS 2006), it had an estimated population of 1,179,867 with age cohort 0 to 24 years comprised of 276,642 boys and 263,285 girls. A cross-sectional growth study was conducted during October 2008 to October 2009. Before enrolling, all the parents or child guardians were sent a letter with detailed information, in which their children were invited to participate in the study. If they approved to participate, they were asked to write an informed consent and completed a questionnaire on their child’s birth dates, ethnicity and other demographic data. Age (in year) was determined by calculating the difference between the date of measurement and the date of birth and the difference was divided by 365.25 days. In trying to get growth norms, we eliminated outliers because they may be suspected as in abnormal health condition. These outliers were detected as individuals beyond 3rd and 97th
percentiles in preliminary analysis of the whole data (see Data Analysis).
Measurements. In order to determine body size and somatotype we measured 10 anthropometric measurements, i.e. body weight (WT), body height (HT), triceps skinfold, subscapular skinfold, supraspinale skinfold, calf skinfold, humerus breadth, femur breadth, upper-arm girth, and calf girth. We followed the anthropometric measurement manual of NHANES III (1988). WT and HT are the main dimensions of body size.
210 bp WT consists of fat mass (FM) and fat free mass (FFM).
FM is the most variable component of the body. An indicator for FM is body mass index (BMI, in kg/m2) (Dietz
& Bellizzi 1999; Kulkarni et al. 2010) which was computed following the standard formula of WHO, BMI = weight/
height2 (http://apps.who.int/bmi/index.jsp). Skinfold thickness is widely used as a measure of fatness (Norgan 2005), because it directly measure subcutaneous fat layers. Various estimation equations have been derived to determine whole body fatness from skinfold measurements on some anatomical sites. Equation of Slaughter et al. (1988) had been used to estimate percentage of body fat (PBF) among children age 8-18 years of various ethnic groups (Wong et al. 2000; Morrison et al. 2001). The equation follows the standard sex-specific and applies 2 skinfolds thickness, triceps skinfold (T) and calf skinfold (C). The PBF equations used in boys was PBF (%) = (1.33(T + C )) − (0.08(T + C )2)
− 3.533 while in girls was PBF (%) = (1.33(T + C )) − (0.013(T + C )2)
− 2.5.
All ten anthropometric dimensions above were needed to calculate the anthropometric somatotype. Equations for its calculation followed Heath-Carter method that resulted in a three-exact decimal score of endomorphy, mesomorphy and ectomorphy (Carter 2002). Endomorphy = −0.7182 + 0.1451(X) − 0.00068 (X2) + 0.0000014 (X3) where
X = (sum of triceps, subscapular and supraspinale
skinfolds). Mesomorphy = [(0.858 × humerus breadth) + (0.601 × femur breadth) + (0.188 corrected arm girth) + (0.161 × corrected calf girth)] − (height × 0.131) + 4.5 and
ectomorphy = HWR × 0.732 − 28.58 if HWR was greater than or equal to 40.75. HWR (height weight ratio) was body height divided by cube root of body weight. If HWR was less than 40.75 but more than 38.25, then ectomorphy = HWR × 0.463 − 17.63 and if HWR was equal to or less than 38.25 given a rating of 0.1.
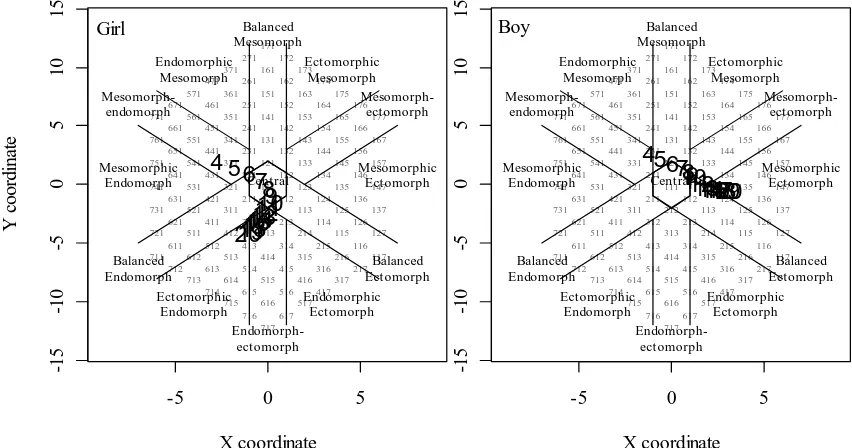
Data Analysis. All anthropometric data were statistically analyzed in the Section of Biosystematic and Ecology of Animals Department of Biology, Bogor Agricultural University. WT, HT, BMI, and PBF were presented as growth charts at 9 levels of percentiles (3, 5, 10, 25, 50, 75, 90, 95, and 97%) which were drawn by applying generalized additive models for location, scale and shape (GAMLSS) (Rigby & Stasinopoulos 2005). In somatotyping, the three-number somatotype scores were determined; individuals represented by the somatotype scores were plotted on a two-dimensional somatochart (somatoplot) using X,Y coordinates derived from the score (Carter 2002). X coordinate = ectomorphy − endomorphy and Y coordinate = 2 × mesomorphy − (ectomorphy + endomorphy).
Sexual dimorphism of growth of WT, HT, BMI, PBF, and somatotype at each age-group were analyzed by Student’s t-tests. Age-related change of WT, HT, BMI, PBF, and somatotype were examined by the application of ANOVA model and followed by the use of Tukey HSD (honest significant difference) post hoc test for multiple comparisons. Associations of sociodemographic indicators to body sizes were analyzed by linear mixed
effect models as mentioned by Lindstrom and Bates (1988). For screening the nutritional status of our subjects based on BMI and PBF, we compared them to the accepted conventions of Kuczmarski et al. (2000) for BMI and McCarthy et al. (2006) for PBF. A child is defined as underweight if BMI is lower than the 5th percentile, at risk
for underweight if BMI ranges in the 5th to 15th percentile,
normal if BMI ranges in the 16th to 84th percentile,
overweight if BMI ranges in the 85th to 94th percentile, and
obese if BMI is higher than 95th percentile (Kuczmarski et
al. 2000). Based on PBF, McCarthy et al. (2006) selected the 2nd percentile to define the upper limit of underfat, and
the 85th and 95th percentiles to define the lower limits of
overfat and obese. All statistical procedures were performed using the R software version 2.9.1 (http:// www.R-project.org/).
RESULTS
Sociodemographic Characteristic. A total of 397 girls and 334 boys age 4 to 20 years participated for the study. After eliminating outliers, subjects remained were 363 girls and 299 boys. They were ethnic Javanese living in Magelang Regency of Central Java Province, Indonesia. In average, their family size was 5 and ranged from 2 to12 members. Over half of their parents (58%) had received secondary education (junior and senior high school), 27% attended primary school and only 14% graduated in the college (diploma, bachelor, master, and doctoral). Over half of the fathers (65%) worked as government employee, private employee and labor while about 35% were unemployment or self financed as farmer and entrepreneur. However 33% of the mothers were house wife and about 36% worked as government employee, private employee and labor, while 31% were farmer and entrepreneur. About 40% of the parents had monthly income lower than the regionally minimum salary of Magelang Regency in year 2010. According to the Indonesia’s Investment Coordinating Board in 2008 (www.regionalinvestment. com), its value was 752,000 Indonesian Rupiah (IDR). Regionally minimum salary is regulated every year by local government based on the rates of several goods in an area. It is a standard used by industry in paying their labor or their employees. This readily provides a basis to infer middle class segment of community. Over than half of the parents (60%) had monthly income higher or equal to the regionally minimum salary while other 40% were lower (Table 1). Thus most children subjects were categorized in the well-off family.
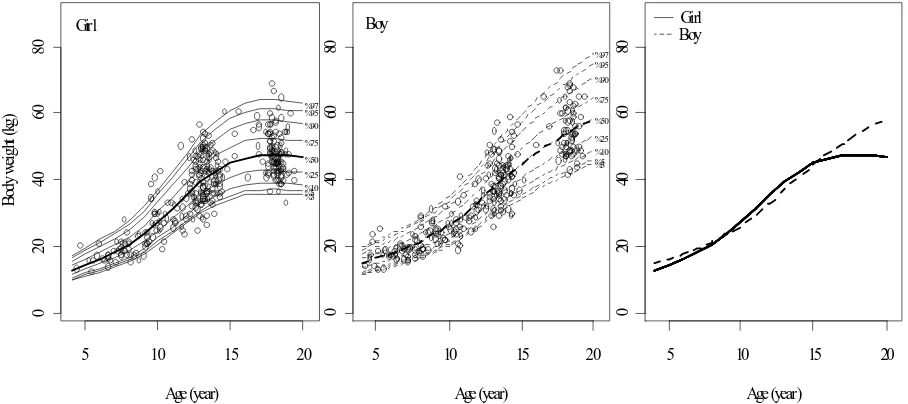
Body Sizes. Figures 2 and 3 present growth charts of body weight and height, respectively, for Javanese girls and boys aged 4-20 years lived in Magelang Regency. According to the 50th percentile, at age 4 years girl body
of age. Sex differences existed significantly (P < 0.05) after age 12 years. Nevertheless, during age 10 to 15 years girls were heavier than boys. According to the 50th percentile,
females at age 20 years were about 11.69 kg lighter and 12.9 cm shorter than males at the similar age.
According to the 50th percentile of BMI growth chart
(Figure 4), girls were about 13 kg/m2 while boys were about
14 kg/m2 at age 4 years. We found BMI also increase with
age in boys, but in girls it ceased to grow after 17 years of age. At age 20 years, BMI of girls were about 19 kg/m2 and
boys were about 20 kg/m2. Over half of our subjects (65%)
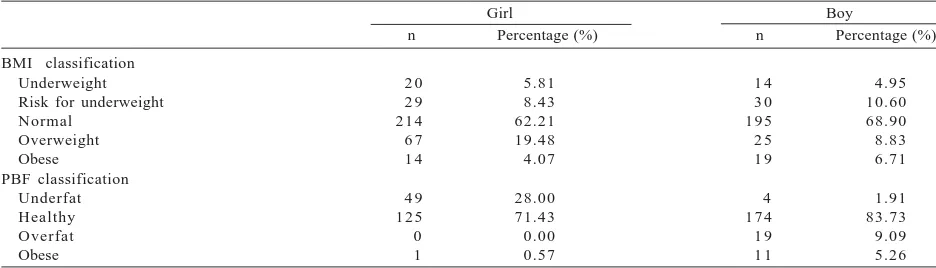
were normal and 5% were underweight. Prevalence of overweight in girl was higher than in boys but prevalence of obese was rather similar in both sexes (Table 2). Among
Table 1. Sociodemographic characteristic of children included the study
Girl Boy
1 (single child) 2-4
> 4
Mother education Primary school Junior high school Senior high school
College (diploma and bachelor) Father education
Primary school Junior high school Senior high school
College (diploma and bachelor) Post graduate (master and doctoral) Mother occupation
Household wife
Self financed (farmer, trader, entrepreneur) Employee (government, private, labor) Father occupation
Unemployed
Self financed (farmer, trader, entrepreneur) Employee (government, private, labor) Total monthly income of parent*
Low (< 752,000 IDR)
Medium (752,000-1,500,000 IDR) High (> 1,500,000 IDR)
1 6
n = number of subjects; *Regionally minimum salary of Magelang Regency in year 2010 was 752,000 Indonesian Rupiah (IDR) (Indonesia’s Investment Coordinating Board 2008).
5 10 15 20
Figure 2. Growth chart of body weight in girl (left, solid lines) and boy (center, dashed-lines) age 4 to 20 years lived in Magelang Regency. Bold line for 50th percentile and others for 3rd, 5th, 10th, 25th, 75th, 90th, 95th, and 97th percentiles (bottom to top).
Figure 4. Growth chart of body mass index in girl (left, solid lines) and boy (center, dashed-lines) age 4 to 20 years lived in Magelang Regency. Bold line for 50th percentile and others for 3rd, 5th, 10th, 25th, 75th, 90th, 95th, and 97th percentiles (bottom to top).
Combined of both sex curves (right) were derived from 50th percentile.
5 10 15 20
Figure 3. Growth chart of body height in girl (left, solid lines) and boy (center, dashed-lines) age 4 to 20 years lived in Magelang Regency. Bold lines for 50th percentile and others for 3rd, 5th, 10th, 25th, 75th, 90th, 95th, and 97th percentiles (bottom to top). Combined
of both sex curves (right) were derived from 50th percentile.
5 10 15 20
Table 2. Prevalence of underweight, normal, overweight, and obese according to body mass index (BMI) percentiles and prevalence of underfat, healthy, overfat, and obese according to percentage of body fat (PBF) percentiles among children subjects lived in Magelang Regency
Girl Boy
n Percentage (%) n Percentage (%)
BMI classification Underweight Risk for underweight Normal n = number of subjects. According to BMI percentiles: underweight was defined as BMI < 5th percentile, at risk for underweight 5th < BMI
< 15th percentile, normal 15th < BMI < 85th percentile, overweight 85th < BMI < 95th percentile, and obese BMI > 95th percentile
(Kuczmarski et al. 2000). According to PBF percentiles: underfat was defined as PBF < 2nd percentile, healthy 2nd < PBF < 85th
the sociodemographic indicators, monthly income of the parent and parents education level were the significant predictors for BMI (P < 0.05) in girl subjects but not in boys. The higher monthly income and the higher education level of the parent, BMI of the girls was higher. PBF growth charts are shown in Figure 5. In girls, PBF increased for every age from 3 to 17 years but not in boys (Figure 5). PBF of girls grew slightly during age 3 to 6 years. However, after 6 years they accelerated. In boys, PBF fluctuated. They decreased from age 3 to 8 years and then slightly increased for the next 4 years. Since age 12 PBF of boys continued to decrease. Sex differences existed early at about age 6 years. Girls at age 17 years had twice greater of body fat than boys. Based on the PBF values, most subjects (over 70%) in both sexes were healthy. The others were overfat and underfat. Boys were more in overfat and obese state (14%) than girls (0.6%) and subsequently girls were more in underfat state (28%) than boys (2%) (Table 2). Among the sociodemographic indicators, monthly income of the parent and parents
education level were the significant predictors for PBF (P < 0.05) in girls but not in boys. The higher monthly income and the higher education level of the parent, PBF of the girls was higher.
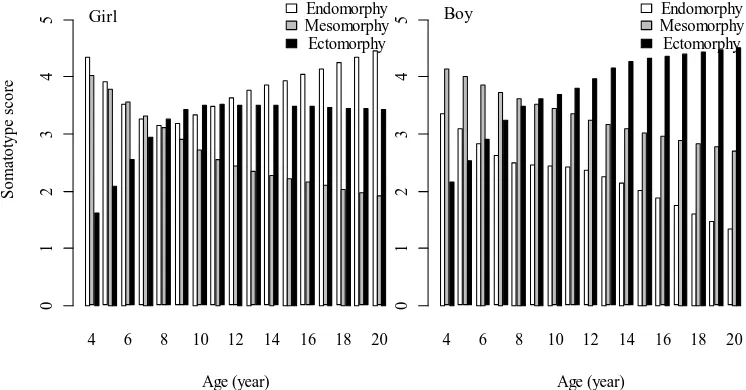
Somatotype. Median values of the somatotype components for each age group are presented in Figure 6. We found somatotype varied with sex and age. A significant sexual difference in the three components of somatotype was found (P < 0.05). At age 4 years, both girls and boys had more dominant endomorphy and mesomorphy components. However in the subsequent ages, ectomorphy component increased but mesomorphy component decreased. The decreased of mesomorphy component was parallel to the decrease of endomorphy component in both sexes although from 8 years of age endomorphy component in girls increased instead. The age-related change of endomorphy component in both sexes were significant at P < 0.05. Mesomorphy component in both sexes demonstrates a significant decrease (P < 0.05) with age from 4 to 20 years. At about age 8 years the
5 10 15 20
5
1
0
1
52
0
2
53
0
3
5
Age (year)
%97 %95 %90 %75 %50 %25 %10 %5 %3 Boy
5 10 15 20
5
1
0
1
52
0
2
53
0
3
5
Age (year)
B
ody f
at
(
%
)
%97 %95 %90
%75
%50
%25
%10 %5 %3 Girl
5 10 15 20
5
1
0
1
52
0
2
53
0
3
5
Age (year) Girl
Boy
Figure 5. Growth chart of body fat in girl (left, solid lines) and boy (center, dashed-lines) age 4 to 20 years lived in Magelang Regency. Bold line for 50th percentile and others for 3rd, 5th, 10th, 25th, 75th, 90th, 95th, and 97th percentiles (bottom to top). Combined of
both sex curves (right) were derived from 50th percentile.
4 6 8 10 12 14 16 18 20
Age (year)
01
234
5 Boy MesomorphyEndomorphy
Ectomorphy
4 6 8 10 12 14 16 18 20
Age (year)
S
o
m
at
o
type
s
cor
e
01
234
5 Girl Endomorphy
Mesomorphy Ectomorphy
three components somatotype in girls tended to be at balance. Since about 10 years of age, ectomorphy component in girls ceased to grow. Nevertheless, ectomorphy component in boys shows a significant increase (P < 0.05). Therefore girls became to be more endomorphic while boys more ectomorphic at the older ages. We plotted median values of somatotype score for each age group to the Carter’s somatochart as shown in Figure 7. There is a clear direction of age-related change of somatotype in children at age range 4 to 20 years from balanced mesomorph-endomorph (somatotype score 4-4-2) to central (somatotype score 3-3-3) to ectomorphic-endomorph (somatotype score 4-2-3) in girls and from mesomorph-endomorph (somatotype score 3-4-2) to mesomorphic-ectomorph in boys (somatotype score 1-3-5).
Relationship of endomorphy component to the BMI and PBF were analyzed as shown in Figure 8. There was a positive correlation of endomorphy component to BMI in girls (R2=0.497, P < 0.05) but not in boys (R2=0.012, P >
0.05). Nevertheless, endomorphy component correlated positively to PBF in both sexes. All correlations were significant at P < 0.05 with R2 values were 0.813 in girls
and 0.718 in boys. Therefore, BMI in girls correlated significantly to PBF (R2=0.570, P < 0.05), but not in boys
(R2=0.0001, P > 0.05).
DISCUSSION
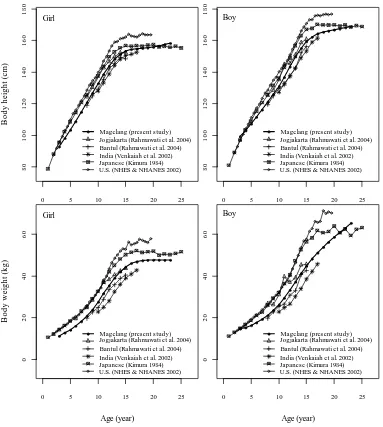
This discussion begins with a comparison of the children body size in the present data with those reported for several ethnic to study the population differences in growth pattern. Available data of height and weight were obtained from the studies in Javanese children from Bantul and Yogyakarta Indonesia (Rahmawati et al. 2004), Japanese children (Kimura 1984), India children from rural areas in Andhra Pradesh, Gujarat, Karnataka, Kerala,
Madhya Pradesh, Maharashtra Sissa, Uttar Pradesh, and Tamil Nadu Provinces (Venkaiah et al. 2002), and U.S. children (NHES & NHANES 2002). U.S., Japan and Yogyakarta samples came from families belonging to a relatively higher level of socioeconomic statuses compare to Magelang; hence they had better nutrition and optimum living conditions. In general, Javanese children from Magelang Regency were shorter and lighter than the children of those U.S., Japan and Yogyakarta as shown in Figure 9. They improved when compared with those of the same ethnic from Bantul and with the different ethnic from rural India. Bantul Regency is a rural region with rather similar condition to the Magelang Regency. Bantul is about 60 km south of Magelang Regency. Although Javanese children from Bantul, Yogyakarta and Magelang
-5 0 5
Figure 7. Somatoplot of the 50th percentile somatotype score (bold numbers) of girls (left) and boys (right) lived in Magelang Regency
by age, 4 to 20 years.
are genetically close to each other compared to India, their growth patterns were different in relation to India. Reference children from the Indian study also lived in rural area with low socioeconomic status (Venkaiah et al. 2002) so their height and weight were lower than Javanese children (Yogyakarta, Magelang, and Bantul). Most U.S. sample came from white children which belong to Caucasoid as the Indian so they are rather similar genetically. However, India children from rural area had lower physical growth as the genetic potential would only be expressed in the well-off and healthy populations (Bogin & Sullivan 1986; Thomis & Towne 2006). This was also true for Japanese and Javanese children which are the same Mongoloid race yet Japanese children had greater growth in their body sizes because they live in the better socioeconomic conditions. It is a well known fact that the well-off population has higher physical growth than the poor ones (Jones et al. 1985; Shen et al. 1996; Mueller & Smith 1999; Rahmawati et al. 2004).
During the human growth, the body changes significantly in size, structure, proportions, and composition (Kalichman & Kobyliansky 2006). In our study there was a clear age-related change of somatotype in children aged 4 to 20 years. At age 4 years, the physique of Magelang Regency children in both sexes is found to be mesomorph-endomorph (somatotype score 4-4-2 in girl or 3-4-2 in boy). Thereafter it is transformed into ectomorphic-endomorph (4-2-3) in girls and to mesomorphic-ectomorph (1-3-5) in boys at the age of 20 years. Thus during the growth period, there has been major qualitative changes take place in the physique of a child (Singh et al. 2007). Based on the change in somatotypic component, we could determine the onset of puberty (Kulin & Müller 1996). In our girl subjects, it is characterized by an acceleration of endomorphy component and followed by a plateau of ectomorphy component which is shown at age 8 years (Figure 6). It is well known that endomorphy reflects body fat (Carter 2002). According to
0 5 10 15 20 25
80
100
1
20
140
1
60
180
Boy
Magelang (present study) Jogjakarta (Rahmawati et al. 2004) Bantul (Rahmawati et al. 2004) India (Venkaiah et al. 2002) Japanese (Kimura 1984) U.S. (NHES & NHANES 2002)
0 5 10 15 20 25
80
100
1
20
140
1
60
180
B
o
dy he
igh
t (
cm
)
Girl
Magelang (present study) Jogjakarta (Rahmawati et al. 2004) Bantul (Rahmawati et al. 2004) India (Venkaiah et al. 2002) Japanese (Kimura 1984) U.S. (NHES & NHANES 2002)
0 5 10 15 20 25
02
0
4
0
6
0
Age (year)
B
ody
w
ei
gh
t (
kg)
Girl
Magelang (present study) Jogjakarta (Rahmawati et al. 2004) Bantul (Rahmawati et al. 2004) India (Venkaiah et al. 2002) Japanese (Kimura 1984) U.S. (NHES & NHANES 2002)
0 5 10 15 20 25
02
0
4
0
6
0
Age (year) Boy
Magelang (present study) Jogjakarta (Rahmawati et al. 2004) Bantul (Rahmawati et al. 2004) India (Venkaiah et al. 2002) Japanese (Kimura 1984) U.S. (NHES & NHANES 2002)
Kulin and Müller (1996) and Aryo (2011), girls augment their body fat noticeably at 7 years of age. Nevertheless, according to Davidson et al. (2003), it could be exhibited from age 5 to 9 years. Thus our girl subjects were categorized in normal puberty. Onset of puberty in our boys is characterized by an acceleration of ectomorphy exceeded the mesomorphy components. Mesomorphy component decreased gradually during age 4 to 20 years. These pattern of changes are rather similar to the Bandung boys as reported by Aryo (2011) but in Magelang boys the changes occurred later than in Bandung boys. The mesomorphy component reflects muscle and skeletal tissue (Carter 2002). Nevertheless Kulin and Müller (1996) stated that lean body mass, which is made up primarily of muscle and skeletal tissue, increases significantly in boys since age 9 years in Caucasian population. The different pattern of somatotypic component dominance during puberty might deal with ethnicity and socioeconomic condition differences between Magelang and Bandung boys from those mentioned by Kulin and Müller (1996).
We also reported relationships of endomorphy component of somatotype to BMI and PBF. We found endomorphy component correlate significantly to PBF (in both sexes) (Figure 8) as endomorphy reflects body fatness (Carter 2002). However endomorphy component was found not to correlate to BMI in our boy subjects. Although BMI is the most commonly used indirect measure of overall adiposity (Bose & Mascie-Taylor 1997; Bose 2002; Ghosh et al. 2004; Bhadra et al. 2005), BMI does not quantitate body fat as it amalgamates frame size (mineral content) and lean tissue (Roemmich et al. 1997; Fields & Goran 2000). The different growth pattern of somatotypic components between girl and boy showed that the use of BMI as an indicator of fatness in children should be reassessed. Assessment of body fat from skinfolds, as it leads to endomorphy, gives a more direct estimate of body fat mass (Fett et al. 2006), especially more so in children and adolescents (Deurenberg et al. 1990).
We observed correlations of several sociodemographic factors to body fat. We found that monthly income of parent was the main predictor. This is in accordance to the notion that, socioeconomic status correlates to the body fat across entire range of ethnic groups (Bogin & Sullivan 1986). Several publications worldwide showed that the low socioeconomic status causing children to suffer from mild to moderate energy malnutrition (Jones et al. 1985; Shen et al. 1996; Mueller & Smith 1999; Rahmawati et al. 2004; Water et al. 2004). Poor children experience greater reduction in fat storage under nutritional stress. Over half of our subjects (about 60%) were categorized in the well-off children. Their parents had relatively high salary and education level (Table 1). Therefore underweight or underfat prevalence in our subjects was lower (14.3%) comparing to the national survey (27.4%) conducted by Indonesia Family Life in 2000 (Tuan & Nicklas 2009) or comparing to the United Nations System Standing Committee on Nutrition report (26.5%) in 2004 (Leroy et al. 2008).
It was conclude that of our children subjects (> 50%) were categorized in the well-off family. Their parents had higher education level with monthly income higher or equal to the regionally minimum salary of Magelang Regency (752,000 Indonesian Rupiah). At age 4 years girl body size were 13 kg in body weight and 100 cm in body height, while boy’s were 15 kg in body weight and 100 cm in body height. In girls, BMI were about 13 kg/m2 and PBF
were 14% while in boys, BMI were about 14 kg/m2 and
PBF were 15%. At age 20 years their body size increased. In girls, they were 47 kg in body weight and 150 cm in body height, while boys were 58 kg in body weight and 167 cm in body height. BMI also increased, girls were about 19 kg/m2 and boys were about 20 kg/m2. PBF
increased to 25% in girls but decreased to 10% in boys. Because of our subjects came from well-off family, underweight or underfat prevalence was low (14.3%). There was a clear age-related change of their somatotype. At age 4 years, the physique of children subjects in both sexes is found to be mesomorph-endomorph (somatotype score 4-4-2 in girl or 3-4-2 in boy). Thereafter it is transformed into ectomorphic-endomorph (4-2-3) in girls and to mesomorph-ectomorph (1-3-5) in boys at the age of 20 years. In girl subjects, the onset of puberty was characterized by an acceleration of endomorphy component which is shown at age 8 years. While in our boys it was characterized by an acceleration of ectomorphy since age 9 years. The different growth pattern of somatotypic components between girl and boy showed that the use of BMI as an indicator of fatness in children should be reassessed.
ACKNOWLEDGEMENT
We are grateful to the Government of Magelang Regency for the permission of this study. We would also like to express our gratitude to the school principals, teachers and all the subjects for all their support throughout the study. This paper was drawn from Doctorate theses of Tetri Widiyani and funded by Scholarship for Post-graduate Study from the Indonesian Ministry of Education, Directorate General of Higher Education.
REFERENCES
Adhianto G, Soetjiningsih. 2002. Prevalence and risk factors of overweight and obesity in adolescents. Paediatr Indo 42:206-211.
Artaria MD, Henneberg M. 2007. Schoolchildren who do not reach WHO reference despite good socioeconomic status: A mixed-longitudinal study of body height and weight of Javanese and Cape-Coloured Schoolchildren. Bull Soc Suisse Anthropol 13:1-12.
Aryo RK. 2011. Perawakan anak umur 4-19 tahun di Kota
Bandung [thesis]. Bogor: Bogor Agricultural University,
Indonesia.
Beunen G, Claessens A, Lefevre J, Ostyn M, Renson R, Simon J. 1987. Somatotype as related to age at peak velocity and peak velocity in height, weight and static strength in boys. Hum
Biol 59:641-655.
Bhadra M, Mukhopadhyay A, Bose K. 2005. Differences in body composition between pre-menarcheal and menarcheal Bengalee Hindu girls of Madhyamgram, West Bengal, India.
Anthropol Sci 113:141-145. http://dx.doi.org/10.1537/ase.
0 4 0 5 0 5
Bhasin MK, Jain S. 2007. Biology of the Tribal Groups of Rajasthan, India: 4. Age changes in somatotype. Anthropol 9:257-265. Bogin B, Sullivan T. 1986. Socioeconomic status, sex, age, and ethnicity as determinants of body fat distribution for Guatemalan children. Am J Phys Anthropol 69:527-535. http:/ /dx.doi.org/10.1002/ajpa.1330690413
Bose K. 2002. Age trends in adiposity and central body fat distribution among adult white men resident in Peterborough, East Anglia, England. Coll Antropol 26:179-186.
Bose K, Mascie-Taylor CGN. 1997. Relationship of body mass index, regional adiposity and body fat distribution with some risk factors of NIDDM in adult Caucasian and migrant Pakistani males. Bull Mém Soc Anthropol Paris 9:279-290. http://dx.doi. org/10.3406/bmsap.1997.2486
[BPS] Badan Pusat Statistik. 2006. Magelang Regency in Figures. Magelang: Pemerintah Daerah Kabupaten Magelang dan Badan Pusat Statistik.
Carter JEL. 2002. The Heath-Carter anthropometric somatotype
- instruction manual. Surrey: TeP and Rosscraft.
Carter L. 1996. Somatotyping. In: Norton K, Olds T (eds).
Anthropometrica. Sydney: University of New South Wales Pr.
p 147-170.
Chakraborty R, Bosea K, Bisai S. 2009. Relationship of family income and house type to body mass index and chronic energy deficiency among urban Bengalee male slum dwellers of
Kolkata, India. HOMO J Comp Hum Biol 60:45-57. http://
dx.doi.org/10.1016/j.jchb.2008.06.007
Davison KK, Susman EJ, Birch LL. 2003. Percent body fat at age 5 predicts earlier pubertal development among girls at age 9.
Pediatrics 111:815-821. http://dx.doi.org/10.1542/peds.111.
4.815
de Onis M, Blössner M. 2003. The world health organization global database on child growth and malnutrition: methodology and applications. Int J Epidemiol 32:518-526. http://dx.doi. org/10.1093/ije/dyg099
Deurenberg P, Pieters JJL, Hautvast JGAJ. 1990. The assessment of the body fat percentage by skinfold thickness measurements in childhood and young adolescence. Bri J Nutr 63:293-303.
http://dx.doi.org/10.1079/BJN19900116
Dietz WH, Bellizzi MC. 1999. Introduction: the use of body mass index to assess obesity in children. Am J Clin Nutr 70(suppl): 123S-125S.
Ellis KJ. 2000. Human body composition: in vivo methods. Physiol
Rev 80:649-680.
Fett CA, Fett WCR, Oyama SR, Marchini JS. 2006. Body composition and somatotype in overweight and obese women pre- and post-circuit training or jogging. Rev Bras Med Esporte 12:39e-43e.
Fields DA, Goran MI. 2000. Body composition techniques and the four-compartment model in children. J Appl Physiol 89:613-620.
Gakhar I, Malik SL. 2002. Age changes and sex differences in somatotypes among Jats of Delhi. Anthropol Spec Issue 1:115-125.
Ghosh A, Bose K, Chakravarti S, Chaudhuri ABD, Chattopadhyay J, Dasgupta G, Sengupta S. 2004. Adiposity measures and their relationship with metabolic risk factors for coronary heart disease in Bengalee Hindu men of Kolkata, India. Anthropol
Sci 112:115-119. http://dx.doi.org/10.1537/ase.00093
Ghosh S, Malik SL. 2004. A comparative study of age changes in somatotypes of Brahmin and Rajput boys of Sundarnagar, Himachal Pradesh. Anthropol 6:19-23.
Hebbelinck M, Duquet W, Borms J, Carter JEL. 1995. Stability of somatotypes: a longitudinal growth study in Belgian children followed from 6 to 17 years. Am J Hum Biol 7:575-588.
http://dx.doi.org/10.1002/ajhb.1310070505
Hermawan C. 2007. Pola pertumbuhan anak usia 4 sampai 13
tahun di wilayah Karawang [thesis]. Bogor: Bogor
Agricultural University, Indonesia.
Jones DY, Nesheim MC, Habichi JP. 1985. Influences in child growth associated with poverty in the 1 970’s: an examination of HANESI and HANESII, cross-sectional US national surveys.
Am J Clin Nutr 42:714-724.
Kalichman L, Kobyliansky E. 2006. Sex- and age-related variations of the somatotype in a Chuvasha population. HOMO J Comp
Hum Biol 57:151-162. http://dx.doi.org/10.1016/j.jchb.2006.
01.002
Kimura K. 1984. Studies on growth and development in Japan. Y
Phys Anthropol 27:179-214. http://dx.doi.org/10.1002/ajpa.
1330270509
Kuczmarski RJ, Ogden CL, Grummer-Strawn LM, Flegal KM, Guo SS, Wei R, Mei Z, Curtin LR, Roche AF, Johnson CL. 2000.
CDC Growth Charts: United States. Advance data from vital and health statistics no. 314. Hyattsville, Maryland: Centers
for Disease Control and Prevention/National Center for Health Statistics.
Kulin HE, Müller J. 1996. The biological aspects of puberty.
Pediatr Rev 17:75-86. http://dx.doi.org/10.1542/pir.17-3-75
Kulkarni B, Shatrugna V, Nagalla B, Rani KU. 2010. Regional body composition of Indian women from a low-income group and its association with anthropometric indices and reproductive events. Ann Nutr Metab 56:182-189. http://dx. doi.org/10.1159/000276597
Leroy JL, García-Guerra A, García R, Dominguez C, Rivera J, Neufeld LM. 2008. The Oportunidades Program increase the linear growth of children enrolled at young ages in urban Mexico. J Nutr 138:793-798.
Lindstrom MJ, Bates DM. 1988. Newton-raphson and EM algorithms for linear mixed-effects models for repeated-measures data. J Am Statis Assoc 83:1014-1022. http://dx.doi. org/10.2307/2290128
McCarthy HD, Cole TJ, Fry T, Jebb SA, Prentice AM. 2006. Body fat reference curves for children. Int J Obes 30:598-602.
http://dx.doi.org/10.1038/sj.ijo.0803232
Miharja EA. 2008. Besar tubuh anak usia 4 sampai 14 tahun di
wilayah Purwakarta [thesis]. Bogor: Bogor Agricultural
University, Indonesia.
Morrison JA, Barton BA, Obarzanek E, Crawford PB, Guo SS, Schreiber GB. 2001. Racial differences in the sums of skinfolds and percentage of body fat estimated from impedance in black and white girls, 9 to 19 years of age: the National Heart, Lung, and Blood Institute Growth and Health Study. Obes Res 9:297-305. http://dx.doi.org/10.1038/oby.2001.37
Mueller I, Smith TA. 1999. Patterns of child growth in Papua New Guinea and their relation to environmental, dietary and socioeconomic factors – further analyses of the 1982-1983 Papua New Guinea National Nutrition Survey. PNG Med J 42:94-113.
[NHANES III] National Health and Nutrition Examination Survey III. 1988. Body measurements (anthropometry). Rockville: Westat Inc.
[NHES and NHANES] National Health Examination Surveys and National Health and Nutrition Examination Surveys. 2002.
2000 CDC growth charts for the United States: methods and development. Maryland: Department of Health and Human
Services of US.
Norgan NG. 2005. Laboratory and field measurements of body composition. Pub Health Nutr 8:1108-1122. http://dx.doi.org/ 10.1079/PHN2005799
Özener B, Duyar I. 2008. The effect of labour on somatotype of males during the adolescent growth period. HOMO J Comp
Hum Biol 59:161-172. http://dx.doi.org/10.1016/j.jchb.2007.
12.002
Puspita T. 2004. Pola pertumbuhan tinggi badan, berat badan
dan indeks massa tubuh anak Bogor usia 5 sampai 15 tahun
[thesis]. Bogor: Bogor Agricultural University, Indonesia. Rahmawati NT, Hastuti J, Ashizawa K. 2004. Growth and
Rigby RA, Stasinopoulos DM. 2005. Generalized additive models for location, scale and shape. Appl Statist 54:507-554. http:/ /dx.doi.org/10.1111/j.1467-9876.2005.00510.x
Roemmich JN, Clark PA, Weltman A, Rogol AD. 1997. Alterations in growth and body composition during puberty. I. Comparing multicompartment body composition models. J Appl Physiol 83:927-935.
Shen T, Habicht JP, Chang Y. 1996. Effect of economic reforms on child growth in urban and rural areas of China. N Engl J
Med 335:400-406. http://dx.doi.org/10.1056/NEJM1996080
83350606
Singh SP, Singh P, Malhotra P, Sidhu LS. 2007. Somatotypes of high altitude Spitian boys. J Hum Ecol 22:129-133. Slaughter MH, Lohman TG, Boileau RA, Horswill CA, Stillman
RJ, van Loan MD, Bemben DA. 1988. Skinfold equations for estimation of body fatness in children and youths. Hum Biol 60:709-723.
Thomis MA, Towne B. 2006. Genetic determinants of prepubertal and pubertal growth and development. Food Nutr Bull 27:S257-S278.
Toselli S, Gruppioni G. 1999. Study of somatotype in Italian children aged 6–10 years. Int J Anthropol 14:135-146. http:/ /dx.doi.org/10.1007/BF02443893
Tuan NT, Nicklas TA. 2009. Age, sex and ethnic differences in the prevalence of underweight and overweight, defined by using the CDC and IOTF cut points in Asian children. Eur J
Clin Nutr 63:1305-1312. http://dx.doi.org/10.1038/ejcn.
2009.90
Venkaiah K, Damayanti K, Nayak MU, Vijayaraghavan K. 2002. Diet and nutritional status of rural adolescents in India. Eur J
Clin Nutr 56:1119-1125. http://dx.doi.org/10.1038/sj.ejcn.
1601457
Ventrella AR, Semproli S, Jürimäe J, Toselli S, Claessens AL, Jürimäe T, Brasili P. 2008. Somatotype in 6–11-year-old Italian and Estonian schoolchildren. HOMO J Comp Hum Biol 59:383-396. http://dx.doi.org/10.1016/j.jchb.2007.07.001
Waters H, Saadah F, Surbakti S, Heywood P. 2004. Weight-for-age malnutrition in Indonesian children, 1992–1999. Int J
Epidemiol 33:589-595. http://dx.doi.org/10.1093/ije/dyh074
![PENGEM. PROFESI [Compatibility Mode]](data:image/gif;base64,R0lGODlhAQABAIAAAP///wAAACH5BAEAAAAALAAAAAABAAEAAAICRAEAOw==)