Abstract--Leakage current frequency components are
frequently used as a tool for surface condition monitoring on polymeric insulation material and their pollution severity. Fast Fourier Transform (FFT) is one of the methods that are applied for the analysis, but it has some limitation in non-stationary signal. This paper presents analysis of leakage current on polymeric insulation material for high voltage application in frequency domain and time-frequency representation. Tracking and erosion test (Inclined Plane Test (IPT)) complying with BS EN 60587-2007 is conducted on polymeric insulation to select a set of different leakage current patterns from capacitive, resistive and discharge. Then, the leakage current patterns are analysed in frequency domain and time-frequency representation using Fast Fourier Transform and spectrogram technique, respectively. It is found that the surface condition of polymeric insulation material state can be classified accurately by using spectrogram compared to Fast Fourier Transform.
Index Terms--Inclined-Plane Test, Leakage Current, Fast
Fourier Transform, Time-Frequency Representation, spectrogram
I. INTRODUCTION
N high voltage engineering or its applications, insulation is the most important part to prevent the flow of current to undesired paths. The dielectric strength and electrical field are a key properties of insulating material and they become the major factors that determine the failure of the insulation[1]. It is being widely accepted by many power utilities worldwide, including Malaysia. It is being widely accepted by many power utilities worldwide, including Malaysia. There are many advantages of polymeric composite material over conventional ceramic material with a detailed comparison between ceramic and polymer electrical insulation includes asexplained in [2]. A good insulation system give better design, performance and life span of the electrical apparatus. Even though, it has been used widely, there are still many issues such as ageing performance, expected lifetime and their long-term reliability are not known and therefore are a concern to users. To overcome these, a large number of studies and research activities for improvement on their performance have been made. These include the development of new materials, the understanding of deterioration of chemical, electrical and mechanical over the stress, design and manufacturing process of material, and also development of practical testing, monitoring, reliability methods of measuring and service performance.
This paper describes the reliability method to measure loss of hydrophobicity on polymeric insulation, which leads to tracking and erosion as well as to flashover under contaminated condition. One of the key indicators widely accepted to measuring the surface condition of polymeric insulation either in service or accelerated aging laboratory test is by investigating its leakage curent (LC) signal. For LCperformance factor that should be controlled is flashover mechanism because of dry band formation on the surface. Basically, LC signal that leads to surface flashover can be divided into three events state [2] which are the early aging period (EAP), transition period (TP), and late aging period (LAP).
They consists of capacitive current, resistive current, non-linear current and non-non-linear with discharge current [3]. When the sample is completely dry or in hydrophobic state, it is classified as EAP and only low capacitive LC flowed. In the second state, TP, the polymer insulation surface became hydrophilic and LC will change significantly from capacitive to resistively. Finally, during the LAP, LC is completely resistive and surface discharge took place.
Measurement of the LC such as amplitude, pulse, accumulated charge and discharge duration has been used to provide information on degradation [2]. But onwards literatures show, LC harmonic component analysis give better information [2, 4-6]. G.P Bruce and S.M Rowland [7], Suwarno et al [8], A.H El Hag et al [9-11]and Hussein Ahmad [12] examined low harmonic components of LC as a diagnostic tool to study aging and surface condition. A correlation was found that frequency component correspond to surface discharge event as well as high pollution severity.
In most of previous works, LC is normally analyzed in frequency domains, and the fast Fourier transform (FFT) is used for transformation technique. However, LC signals are usually in non-stationary pattern especially during dry-band condition and surface discharge. Thus, this technique is only suitable for stationary signals and does not provide temporal information [13]. Any abrupt signals localized in time require more than FFT. Another reason was reported by C.Muniraj and S.Chandrasekar [14] who found that the analysis of LC in polluted polymer insulator shows that FFT is fast in computation but possess limitations in resolution. In time or frequency domain plot, it just gives half of the information about the signal. A frequency domain plot will tell "what" the
Leakage Current Analysis on Polymeric Surface
Condition using Time-Frequency Distribution
N. Q. Zainal Abidin, A. R. Abdullah, N. Norddin, A. Aman, and K. A. Ibrahim Faculty of Electrical Engineering
Universiti Teknikal Malaysia Melaka (UTeM)
signal looks like, but does not notify “when” it occurred. Meanwhile, a time domain plot will present "when" something happened, but it does not notify "what" happened. To overcome these limitations, time frequency representation (TFR) with spectrogram technique is used. There are other time frequency representations (TFR) that can be used such as Gabor, S-transform and Wavelet techniques. These types of analysis have been successfully employed in signal processing application such as seismic data analysis, audio processing, sonar application and etc.
The aim of this study is to examine the reliable method of surface monitoring using LC signal in time-frequency domain. Spectrogram is performed to detect the surface event of polymeric material. Incline Plane Test (IPT) that complying with BS EN 60578-2007 was conducted on Polypropylene polymeric composite to simulate a set of different LC patterns from capacitive, resistive or hydrophilic state and local arcing event. Then the comparison between FFT and spectrogram is made to distinguish the best method for the determination of surface condition state of events.
II. EXPERIMENTAL WORK
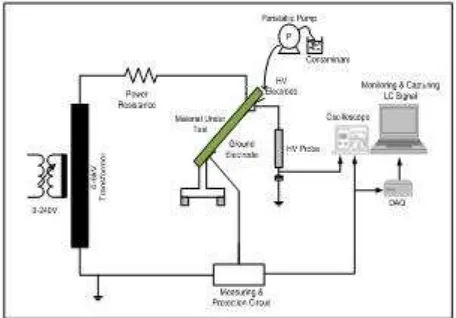
IPT is normally used to evaluate the tracking and erosion resistance of insulating materials. It is a valuable tool for the comparison and evaluation of new and different materials under controlled electrical stress, to compare the suitability of materials for the dielectric surface of an insulator. It also has simplicity in test procedure and low equipment cost. IPT complies with BS EN 60587 [15], and Polypropylene is used as the material under test. The selection of Polypropylene as electrical insulation, their advantages and properties are mentioned in [16]. Fig. 1 shows the schematic circuit diagram for Inclined Plane Test. LABVIEW program is developed for LC data monitoring and storage for analysis purpose. In this study, Method 2 ‘variable-voltage method’ or stepwise tracking voltage is applied to simulate the initial and continuous tracking voltage as well as surface condition events for sample specimen. The voltage is increased from 0-3.5kV while maintaining the conductivity level of 2.5mS/cm and flow rate at 0.3ml/min.
The LC flow on polymer insulation surface can be divided into several parts which are the early aging period (EAP), transition period (TP) and late aging period (LAP) [17]. It consists of capacitive current, resistive current, non-linear current and non-linear with discharge current [3], which is the basic concept of this present study. When the sample is completely dry or in hydrophobic state it is classified as EAP and only low capacitive LC flowed. In the second state, TP, the polymer insulation surface became hydrophilic and LC will change significantly from capacitive to resistively. Finally, during the LAP, LC is completely resistive and surface discharge took place.
Fig. 1 Schematic diagram of Incline Plane Test
III. ANALYSIS TECHNIQUES
Fourier transform is mathematical techniques which convert signal from time to frequency domain. Discrete Fourier transform (DFT) is a digital filtering algorithm that calculates the magnitude and phase at discrete frequencies of a discrete time sequence while fast FFT are computationally capable algorithms for computing the DFT. FFT is useful to get the magnitude and/or phase of a number individual or band of frequencies [19]. The current peaks of leakage current waveform are efficient tool to collect information about surface condition on polluted insulators and performing an FFT analysis to extract its frequency characteristics [20]. The FT is defined as:
∫
∞
∞ −
− =
= F x t xt e j ftdt
f
X( ) { ()} () 2π (1)
where x(t) is the time domain signal, X(f) is the FFT, and ft is the frequency to analyze.
Spectrogram is motivated by the limitation of FFT to cater non-stationary signals whose spectral characteristics change in time. It represents a three-dimensional of the signal energy with respect to time and frequency. This technique is the result of calculating the frequency spectrum of windowed frames of the compound signal [21]. Normally, the STFT is computed at a finite set of discrete values of ω. In addition, due to the finite length of the windowed sequence, the STFT is precisely represented by its frequency sample as long as the number of frequency sample is larger than the window length. Spectrogram provides a distribution of the energy signal in a time-frequency plane [22] and it can be defined as
2 2 ) ( ) ( ) , ( x
S ∫
∞
−∞
− −
= x w t e j f dt
f
t τ τ πτ (2)
where x(τ) is the input signal and w(t) is the window
IV. RESULT AND DISCUSSION
The LC signal starts with capacitive and become resistive with increasing LC amplitude [23]. Later, discharge activities take place and there are more harmonics that can be seen as shown in Fig. 4.
A. Capacitive
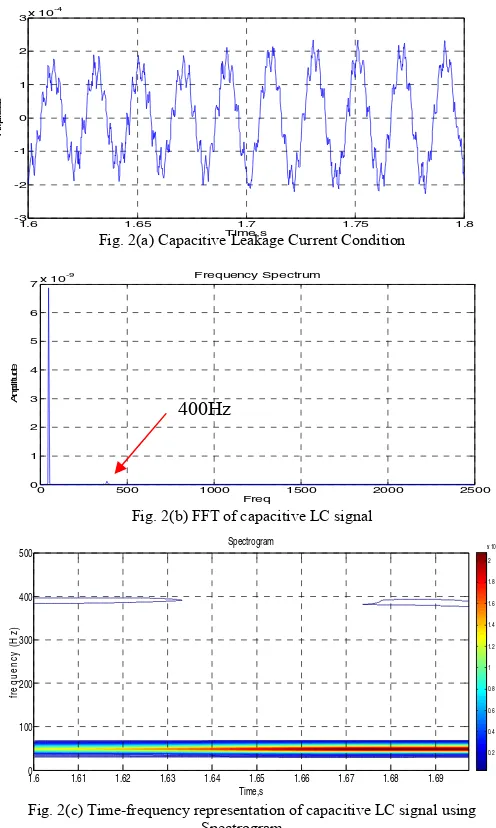
The hydrophobic state or capacitive type is a sinusoidal shape with highly distorted waveform and their amplitude value in the range of µA. At this condition, the power amplitude of LC below than threshold value 1x10⁻¹⁰ is considered as a noise. Fig. 2(a) and 2(b) show the LC in time and frequency domain respectively. In Fig. 2(b), since the sampling frequency is 5 kHz the plot contained the frequency component up to 2.5 kHz, and depicts the non-fundamental frequency visible at around 400 Hz. Fig. 2(c) shows the time-frequency representation of capacitive LC signal using spectrogram. The highest amplitude is represented in red color while the lowest is represent in blue color.
Fig. 2(a) Capacitive Leakage Current Condition
Fig. 2(b) FFT of capacitive LC signal
Fig. 2(c) Time-frequency representation of capacitive LC signal using Spectrogram
B. Resistive
Resistive LC type can be defined as hydrophilic state of insulating surface which occurs at voltage stress from 0.9 kV to
2.8 kV as shown in Fig. 3(a). The amplitude of this signal is varied depending on the applied voltage stress and it’s up to 30mA. Fig. 3(b) and 3(c) show the LC in frequency and time-frequency representation, respectively. In both figures, it clearly shows that only fundamental frequency 50 Hz exists in pure sinusoidal signal.
Fig. 3(a) Resistive Leakage Current Condition
Fig. 3(b) FFT of resistive LC signal
Fig. 3(c) Time-frequency representation of resistive LC signal using Spectrogram
C. Discharge Activities
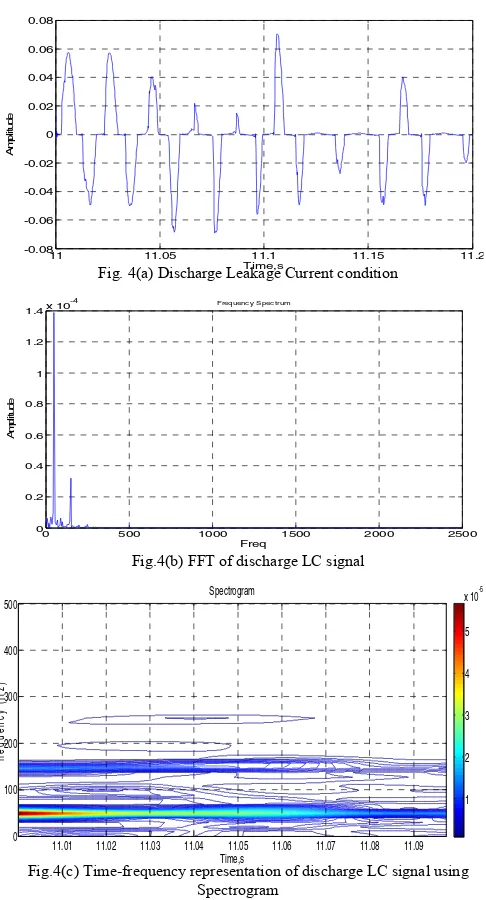
Corresponding to a distorted non-linear symmetrical as shown in Fig. 4(a), arcing with lower sound is produced because of dry band region resulting from evaporation of conducting film. It can be observed at constant voltage of 3.5kV and sustain for longer than 8 cycles. The effect of distorted linear symmetrical is associated with fundamental and non-fundamental frequency component. Fig. 4(b) and 4(c) shows the frequency spectrum and time-frequency representation of the signal, respectively.
0 500 1000 1500 2000 2500
0
0 500 1000 1500 2000 2500
Fig. 4(a) Discharge Leakage Current condition
Fig.4(b)FFT of discharge LC signal
Fig.4(c) Time-frequency representation of discharge LC signal using Spectrogram
The different in frequency component behavior is observed significantly with the LC signal shape. The non-fundamental frequency component is appearing associated with the distorted signal for capacitive and non-linear symmetrical LC signal. While, in pure sinusoidal LC signal only fundamental frequency signal is existed. The correlation between the surface condition events could be made, where highly distorted signal will have higher non-fundamental frequency component. Instead of using frequency domain analysis, time-frequency representation with spectrogram gives better information on the material surface condition. The state of events from EAP to LAP can be classified by observing the result of spectrogram analysis. Other observations are the length, type of window and frequency sampling that is used has affected the frequency resolution as well as time resolution of spectrogram results. After a careful study and observation, corresponding resolution selected is 10 Hz with window length 512 and sampling frequency is 5 k Hz.
V. CONCLUSION
Spectrogram distribution is performed to detect the surface event of polymeric material. Incline Plane Test (IPT) that complying with BS EN 60578-2007 is conducted on Polypropylene polymeric composite to simulate a set of different LC patterns from capacitive, resistive or hydrophilic state and local arcing event. The conclusion that can be made is the LC amplitude is directly proportional with voltage stresses, while the frequency component level of the signal can be used as indicator of surface condition event. Also, with higher content will indicate the severity of the LC signal distortion. Spectrogram analysis gives better information on frequency component compared to FFT analysis. The correlation of surface event could be determined by frequency component of LC, where the higher content of frequency component represent as LAP and sinusoidal shape represent hydrophilic state of event or TP.
VI. ACKNOWLEDGEMENT
The authors gratefully acknowledge the Faculty of Electrical Engineering, Universiti Teknikal Malaysia Melaka for giving the support in this study.
VII. REFERENCES
[1] M.S Naidu and V. Kamaraju, High Voltage Engineering: Tata McGraw-Hill Publishing Company Limited, 2009.
[2] M. A. R. M. Fernando and S. M. Gubanski, "Leakage currents on non-ceramic insulators and materials," IEEE Transactions on Dielectrics and Electrical Insulation, vol. 6, pp. 660-667, 1999.
[3] M. A. R. M. Fernando and S. M. Gubanski, "Leakage Current Patterns on Contaminated Polymeric Surfaces," IEEE Transactions on Dielectrics and Electrical Insulation, vol. 6, pp. 688-694, 1999.
[4] M. A. R. M. Fernando and S. M. Gubanski, "Ageing of silicone rubber insulators in coastal and inland tropical environment," IEEE Transactions on Dielectrics and Electrical Insulation, vol. 17, pp. 326-333, 2010. [5] S. Chandrasekar, C. Kalaivanan, A. Cavallini, and G. Montanari,
"Investigations on leakage current and phase angle characteristics of porcelain and polymeric insulator under contaminated conditions," IEEE Transactions on Dielectrics and Electrical Insulation, vol. 16, pp. 574-583, 2009.
[6] S. Kumagai, B. Marungsri, H. Shinokubo, R. Matsuoka, and N. Yoshimura, "Comparison of leakage current and aging of silicone rubbers and porcelain in both field and salt-fog tests," IEEE Transactions on Dielectrics and Electrical Insulation, vol. 13, pp. 1286-1302, 2006. [7] G. P. Bruce and S. M. Rowland, "Performance of Silicone Rubber in DC
Inclined Plane Tracking Tests," IEEE Transactions on Dielectrics and Electrical Insulation vol. 17, pp. 521-532, 2010.
[8] Suwarno and S. K. Ardianto, "Leakage Current Waveforms and Arcing Characteristics of Epoxy Resin for Outdoor Insulators under Clean and Salt Fogs," ITB J. Eng. Sci., vol. 40, pp. 40-60, 2008.
[9] A. H. El-Hag, S. Jayaram, and E. A. Cherney, "Low Frequency Harmonic Components of Leakage Current as a Diagnostic Tool to Study Aging of Silicone Rubber Insulators," Annual Report Conference on Electrical Insulation and Dielectric Phenomena, pp. 597-600, 2001.
[10] A. H. El-Hag, "A New Technique to Detect Dry-Band Arcing," IEEE Transaction on Power Delivery vol. 20, pp. 1202-1203, 2005.
11 11.05 11.1 11.15 11.2 -0.08
0 500 1000 1500 2000 2500
0
11.01 11.02 11.03 11.04 11.05 11.06 11.07 11.08 11.09
[11] Ayman H. El-Hag, Shesha H. Jayaram, and E. A. Cherney, "Fundamental and Low Frequency Harmonic Components of Leakage Current as a Diignosiic Tool to Study Aging of RTV and HTV Silicone Rubber in Salt-Fog," IEEE Transactions on Dielectrics and Electrical Insulation, vol. 10, pp. 128-136, 2003.
[12] Hussein Ahmad, M.A. Salam, Lee Yi Ying, and N. Bashir, "Harmonic components of leakage current as a diagnostic tool to study the aging of insulators," Journal of Electrostatics, vol. 66, pp. 156-164, 2008. [13] Olivier Rioul and M. Vetteri. (1991) Wavelet and Signal Processing. IEEE
SP Magazine. 14-38.
[14] C.Muniraj and S.Chandrasekar, "Analysis of Leakage Current on Polluted Polymer Insulator by High Resolution Spectrum Estimation Method," presented at the IEEE Third International Conference on Power System, Kharagpur, India, 2009.
[15] B. Standard, "Electrical insulating materials used under severe ambient conditions -Test methods for evaluating resistance to tracking and erosion," in BS EN 60587:2007, ed: BSi, 2007.
[16] A. Aman, M. M. Yaacob, and J. A. Razak, "Dielectric Strength of Waste Tyre Dust-Polypropylene (WTD-PP) for High Voltage Application,"
Australian Journal of Basic and Applied Sciences, vol. 5, pp. 1578-1583, 2011.
[17] M. A. R. M. Fernando and S. M. Gubanski, "Leakage Currents on Non-ceramic Insulators and Materials," IEEE Transactions on Dielectrics and Electrical Insulation, vol. 6, pp. 660-667, 1999.
[18] C. Gherasim, "Signal processing for voltage and current measurements in power quality assessment," Doctoral thesis, 2006
[19] E. P. Leite, Matlab - Modelling, Programming and Simulations: Sciyo. [20] M. A. Douar, A. Mekhaldi, and M. C. Bouzidi, "Flashover process and
frequency analysis of the leakage current on insulator model under non-uniform pollution conditions," IEEE Transactions on Dielectrics and Electrical Insulation, vol. 17, pp. 1284-1297, 2010.
[21] A. R. Abdullah, A. Z. Sha'ameri, and N. M. Saad, "Power quality analysis using spectrogram and gabor transformation," 2007.
[22] A. R. Abdullah and A. Z. Sha'ameri, "Power Quality Analysis Using Linear Time-Frequency Distribution," presented at the IEEE International Conference on Power and Energy (PECon), Johor Baharu Malaysia, 2008. [23] H. I. S. Jayasundara, W. P. S. Sudarshani, and M. A. R. M. Fernando,
"Leakage current patterns on high voltage insulators: Analysis on frequency and time-frequency domains," 2008.
VIII. BIOGRAPHIES
Nur Qamarina binti Zainal Abidin was born in Perak, Malaysia, on November 25, 1985. She received Diploma and B. Eng. degrees with honours in electrical engineering from the University Teknikal Malaysia Melaka (UTeM) in 2006 and 2011, respectively. Currently, she is master’s degree student researcher in the field of high voltage engineering.
Abdul Rahim Bin Abdullah was born in Kedah, Malaysia in 1979. He received his B. Eng., Master and PhD degree from University Teknologi Malaysia in 2001, 2004 and 2011, respectively, in Electrical Engineering and Digital Signal Processing. He is currently a Senior Lecturer and Coordinator of Center of Excellent Robotic and Industrial Automation (CeRIA), University Teknikal Malaysia Melaka (UTeM).
Nurbahirah binti Norddin was born in Kedah, Malaysia in 1987. She received her Diploma and B. Eng from Universiti Teknikal Malaysia Melaka in 2008 and 2011, respectively, in electronic power and drives. She is now pursuing her Master Degree in High Voltage engineering at UTeM.
Aminudin bin Aman was born in Melaka, Malaysia in 1973. He received his B. Eng. and Master Degree from University of Technology Malaysia in 1998 and 2007, respectively, in Control & Instrumentation and High Voltage engineering. He is now pursuing his PhD in same university in High Voltage engineering.