INHOMOGENOUS COLOR OBJECT RECOGNITION USING MONOCROHMATIC-BASED TECHNIQUE
WITH COLOR CAMERA
Noraidah binti Ahmad
Bachelor of Mechatronics Engineering
I hereby declare that I have read through this report entitle “Inhomogeneous Color Object Recognition Using Monochromatic-based Technique” and found that it has comply the
partial fulfilment for awarding the degree of Bachelor of Mechatronics with Honours.
Signature:………..
Supervisor’s Name: Mrs. Nurdiana binti Nordin @Musa
INHOMOGENOUS COLOR OBJECT RECOGNITION USING MONOCHROMATIC
BASED TECHNIQUE WITH COLOR CAMERA
NORAIDAH BINTI AHMAD
A submitted in partial fulfilment of the requirements for the degree of Bachelor of Mechatronics Engineering with Honours
I declare that this report entitle “Inhomogeneous Color Object Recognition Using Monochromatic-based Technique” is the result of my own research except as cited in the references. The report has not been accepted for any degree and is not concurrently submitted
in candidature of any other degree
Signature:……….. Student’s Name: Noraidah binti Ahmad
Matrix No. : B010910287
ACKNOWLEDGMENT
First of all, I would like to express my utmost gratitude to almighty Allah upon compilation of the first progress report.
A million thanks to my supervisor Mrs. Nurdiana binti Nordin@Musa, who had guided be a lot of task during this semester session 2011/2012. I also want to thanks the lecturers and staffs UTeM for their cooperation during I complete the first PSM that had given valuable informations, suggestions and guidance in the compilation and preparation this fist PSM.
Deepest thank and appreciation to my parents, family and others for their cooperation, encouragement, constructive suggestion and full support for the report completion, from the beginning till the end. Also thanks to all my friends and everyone, those have been
ABSTRACT
ABSTRAK
CONTENTS
2.2 Monochromatic-based technique 4
2.3 Color images 5
2.4 Digital Camera 6
2.5 Graphical User Interface (GUI) 8
CHAPTER 3 METHODOLOGY
3.1 Research and review on techniques used by individuals to 10
improve the monochromatic image processing.
3.2 Conclude with a hypothesis that the utilization of MATLAB 10
could improve the image processing together with proper image processing technique
3.3 Preparation on the agendas required to conduct the test 11
3.3.1 The general procedure towards conducting the 11
test is as below and the flow chart
3.3.1.1 Calibrate the color camera and capture 13
the image of the balls
3.3.1.2 Analyze the RGB images on single color 16
channel and color channel combination
3.3.1.3 Enhanced the contrast of the grayscale 17
3.3.1.4 Strategy of Recognition 18
CHAPTER 4 RESULT
4.1 Experimental Result 20
CHAPTER 5 ANALYSIS AND DISCUSSION OF RESULT
5.1Analysis on Experimental Result 24
5.2 Discussion on Experimental Result 25
CHAPTER 6 CONCLUSION AND RECOMMENDATION
6.1 CONCLUSION 28
6.2 RECOMMENDATION 28
REFERENCES 29
APPENDICES 30
Matlab Programming 28
Circular Hough Transform 30
Draw a Circle 42
LIST OF FIGURE/TABLES
Figure 2.1 The mechanism of reflected light on inhomogeneous surface 4
Figure 2.2 RGB Images on Single Channels Conversion and 5
RGB histogram
Figure 2.3 A three dimensional array of RGB image 6
Figure 2.4 Image Sensors: CCD (left) and CMOS (right) 7
Figure 2.5 Imaging chain for digital photography 7
Figure 2.6 Graphical user interface (GUI) 8
Figure 3.1 Flow diagram of the project 9
Figure 3.2 MATLAB 2011 Windows 10
Figure 3.3 Flow Diagrams of General Procedures 12
Figure 3.4 Flow Diagrams of Calibrate the color camera and capture 13
the image of the balls.
Figure 3.5 Image Acquisition Tool 14
Figure 3.6 Hardware Browser 14
Figure 3.7 Preview the Image 15
Figure 3.8 Acquisition Parameters 15
Figure 3.9 Data Exporter 16
Figure 3.10 Flow Diagrams of Analyze RGB images to grayscale images 16
Figure 3.11 Flow Diagrams of analyze grayscale images and enhance 17
the contrast
Figure 3.12 Flow Diagrams of Strategy of Recognition 18
Table 2.1 Recognition Rate (%) For Different Alterations 4
Table 4.1 Circular Recognition on Single Color Channel and 20
Color Channel Combinations
Table 5.2 Errors of Center Positions of Ball on Single Color Channel 27
1 CHAPTER 1
INTRODUCTION
1.1 Introduction
Color images consist of 3-D vectors, which is present the sensor reading of short wavelength (red), medium length (green) and long wavelength (blue) of visible light from the scene. With this combination, more information is delivered about the scene compared to 2D gray level images (e.g. the different color of object of the same shape, the shade of the sky, the color temperature of the incident light). Therefore, the object recognition strategy for color images are vector-valued based and therefore involves a difficult strategy and time consuming compared to the gray level processing. If the contrast of the colored object from the background can be enhanced using one specific color channel or their combination of two of these channels, a simple 2D gray level image processing can be used to recognize the object. Hence, we can reduce the computational speed without compromising the recognition rate.
1.2 Problem Statement
2 robotic application such as target location (object recognition), path planning (passive path planning require beacons for localization) and route mapping. This project is to recognize inhomogeneous color object by using monochromatic based technique with color camera from individual color channels and then combines the individual result to obtain acceptable recognition.
1.3 Objectives
i. To obtain the gray level object recognition strategy for inhomogeneous spherical
object recognition.
ii. To obtain appropriate combination of color channel and color object for better
contrast of object compared to background.
iii. To analyze the effectiveness of the color channel and color channel combination
in terms of recognition rate and speed.
1.4 Project Scope
i. The combination of color channels opted for this project in color camera: R, G, B,
RG, RB and GB.
ii. The inhomogeneous object is of a spherical shape is defined as target.
iii. The object will be painted with matte paints in three color; red, green and blue.
iv. Range of the object to the image sensor is one meter.
v. Normal office
vi. Lighting condition 500 lux.
These following matters are not taken into account in this project:
i. The amount of surfaces roughness.
ii. The spectral variation and color temperature of illuminating light.
3 CHAPTER 2
LITERATURE REVIEW
2.1 Object Recognition
4 Table 1.1 Recognition Rate (%) For Different Alterations
Signe Redfield [6] proposed a real-time prototype system to identify soda can using histogram indexing with only 16 colors with excellent results. The accuracy under the fixed conditions which in a room achieved almost 100% with a variety of soda cans. Marcin Smereka [14] proposed a method from Hough Transform to detect a circular object. This approach has been applied in medical field which to recognize nuclei of cells. Dr. Neelu Jain [15] proposed a new recognition strategy on coin recognition. Dr. Neelu Jain noting that the main advantage of using Hough Transform (HT) is high reability and it gives ideal result even in presence of noises. Then, HT led to reduced processing time for edge-finding of objects. This project continues to propose a strategy of recognition based on method [14] and [15] using Circular Hough Transform and produce grayscale images as result.
Figure 2.1 The mechanism of reflected light on inhomogeneous surface
2.2 Monochromatic-based technique
Monochromatic-based technique gained information from individual color channels and then combines the individual result to obtain acceptable recognition. Most of the color edge detections are monochromatic based techniques which produces a better result when value techniques are applied. A disruption in gray-level images is specified as an edge and for color images is not defined the term of
Uniform
5 color edge. From Wikipedia [16], the edge detection is an important task in image processing and computer vision specifically in features detection and feature extraction which is aiming the identify points in a digital image at the brightness of an image then simultaneously changes sharply and has discontinuities. In color images, a color vector which consists of three color channels is assigned to a pixel and then mixed in different combinations which produce color that visible to the human eye.
2.3 Color images
A color image requires three separate items of information for each pixel and they represent value levels of the information given. For RGB images, the images are built from three separate channels for red, green and blue. Each pixel has intensities from 0 (black) to 255 (white) and each pixel eight bit and a total of 255³=16,777,216 represent any possible color in the image as 24-bit color [7]. The image also consists of a three matrices representing the value of red, green and blue for each pixel. The resulting of grayscale images from each channel produces similar brightness. The red channel has a brighter part in red part and caters the contrast map, green channel has much brighter part in green part and shown to have more sources detail and blue channel has much brighter in blue part and take over for the noise [8]. From objectives as illustrated in Chapter 1, this color images produced a three gray-scaled images from three color components; red, green and blue color components and its combination; RB, RG and GB. The results produced the most significant and less significant color channels on color images based on contrast, recognition rate and
speed to recognize object. The image with an m-by-n frame size represented by m x n
x 3 in MATLAB.
6 Figure 2.3 A three dimensional array of RGB image
2.4 Digital Camera
7 referred such sRGB and etc. Hence, the transformation of an image to a device dependent representation, the device color characterization model has been reverse so that the image can be downloaded in an output ready state to a specific output device. A final viewable image is produced by this output device as their softcopy (LCD) or hardcopy (printer).
Figure 2.4 Image Sensors: CCD (left) and CMOS (right)
Courtesy: Google
8 2.5 Graphical User Interface (GUI)
A graphical user interface (GUI) is a human-computer interface (i.e., a way for humans to interact with computers) that uses windows, icons and menus and which can be manipulated by a mouse and a keyboard as well. Hence, GUIDE is MATLAB’s Graphical User Interface (GUI) design environment that stores two files, which are generated the first time we save or run the GUI; .fig file contains a complete description of the GUI figure layout and the component of the GUIA and .m file contains the code that control the GUI. The example of GUI interface is shown in Figure 1.8. The major advantage of GUIs is that they make computer operation more intuitive, and thus easier to learn and use. For example, it is much easier for a new user to move a file from one directory to another by dragging its icon with the mouse than by having to remember and type seemingly arcane commands to accomplish the same task.
9 CHAPTER 3
METHODOLOGY
The research process flow has been built to describe the plan of the study. The flow chart is the general flow chart for the whole project. All the activities made up the whole project report are illustrated in this flow as shown in Figure 3.1 below.
10 3.1 Research and review on techniques used by individuals to improve the monochromatic image processing.
Most of the research and reviews are referred via reading materials on academic articles, journals and websites. The research on variety of issued that has been highlighted and taken noted, including the method used to determine the edge of the spherical shape in an image, the color constancy, light conditions, algorithm for spectral and colorimeter characterization and many others more. Thus, this information are tabulated and compared with each other, as illustrated in chapter 2: literature review.
3.2 Conclude with a hypothesis that the utilization of MATLAB could improve the image processing together with proper image processing technique
The MATLAB Software is proposed to improve the current analysis result of the monochromatic image processing. MATLAB software is enriched with high-level language and interactive environment, suitable for intensive and complex tasks, with faster performances as compared with traditional programming languages. Besides that, MATLAB supports the entire data analysis process for image processing, ranging from reading images, conversion of image to any different format, filtering the image with any provided algorithm library to producing an accurate visualization, making it suitable choice of implementing image processing via IT.
11 With MATLAB, an image can be converted to a matrix and then various operations can be performed on it to get the desired results and values such identify colors, intensity, edges, texture and pattern in an image.
3.3 Preparation on the agendas required to conduct the test
3.3.1 The general procedure towards conducting the test is as below and the flow chart is shown in Figure 3.4:
1. The DFK 21AU04 color camera is calibrated for optimum output.
2. The spherical object is coated with matte colored paint, placed in front of the camera.
3. The image of the spherical object is captured and analyzed in term of grayscale images on single color channel and its combinations.
4. The grayscale images are analyzed through Circular Hough Transform method and the result is obtained in recognition and processing time.
12 Figure 3.3 Flow Diagrams of General Procedures
Start
Capture the image of the balls,
painted with a matte paint (green, blue and yellow)
Analyze the RGB images on three color channel and color channel combination to get the gray level images and enhance contrast
Analyze the gray level image with Circular Hough Transform to get the center and radius of the balls
Object recognition by drawing the circle of the ball
Measure the rate and speed of processing
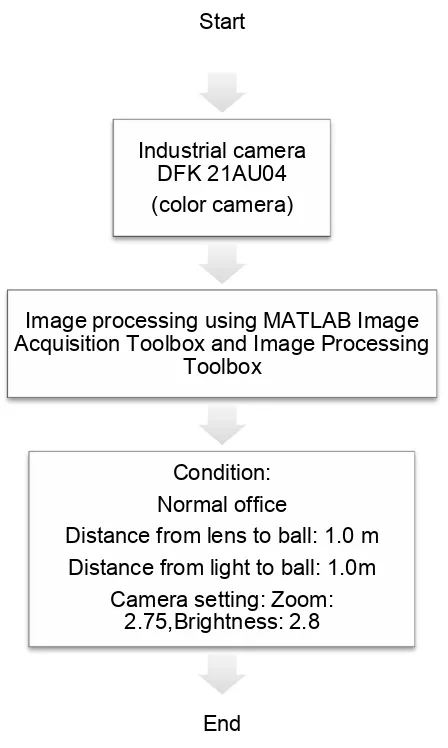
13 3.3.1.1 Calibrate the color camera and capture the image of the balls
Figure 3.4 Flow Diagram of Calibrating the color camera and capturing the image of the balls.
The ball image is captured by using an industrial camera and the output of the image can be viewed in using Matlab software. Above is the procedure of capturing the ball image and the flow diagram of capturing the images of the balls
1. The ball and camera is set as follow;
Distance from lens to ball: 1.0 m Distance from light to ball: 1.0m
Camera setting: Zoom: 2.75,Brightness: 2.8
14 2. The industrial camera is connected with the computer. Open Matlab software and type
command ‘Imaqtool’. Then, the command window as above will show.
Figure 3.5 Image Acquisition Tool
3. The hardware of the image acquisition toolbox is selected which is the industrial camera at hardware tool. Then, select the pixel of the output image.