ISSN: 1693-6930
accredited by DGHE (DIKTI), Decree No: 51/Dikti/Kep/2010 155
Intelligent Monitoring System on Prediction of Building
Damage Index using Neural-Network
Mardiyono*1, Reni Suryanita2, Azlan Adnan3 1
Informatic Engineering, Politeknik Negeri Semarang, Indonesia
2Civil Engineering Department, Faculty of Engineering University of Riau, Indonesia 3
Faculty of Civil Engineering, Universiti Teknologi Malaysia, Johor Bahru, Malaysia e-mail: [email protected], [email protected], [email protected]
Abstrak
Gempa bumi berpotensi menghancurkan gedung tinggi. Kerusakan bangunan dapat diindeks oleh FEMA menjadi tiga kategori yaitu immediate occupancy (IO), life safety (LS), dan collapse prevention (CP). Untuk menentukan indeks kerusakan, model bangunan telah disimulasikan ke dalam perangkat lunak analisis struktur. Data Percepatan telah dianalisis menggunakan metode non linier dalam program analisis struktur. Beban gempa adalah riwayat waktu di permukaan, PGA = 0105g. Karya ini mengusulkan sistem pemantauan cerdas memanfaatkan jaringan syaraf tiruan (JST) untuk memprediksi indeks kerusakan bangunan. Sistem ini juga menyediakan sistem peringatan dan pemberitahuan untuk menginformasikan status kerusakan. Data pembelajaran dilatih pada JST umpan maju dan menggunakan kembali algoritma propagasi. Sistem peringatan ini dirancang untuk dapat mengaktifkan suara alarm, melihat bar waspada atau teks, dan mengirimkan pemberitahuan melalui email untuk keamanan atau manajemen. Sistem ini diuji dengan menggunakan data sampel diwakili dalam tiga kondisi melibatkan IO, LS, dan CP. Hasil penelitian menunjukkan bahwa sistem pemantauan yang diusulkan cerdas bisa memberikan prediksi dengan akurasi 92% dan mengaktifkan sistem alarm. Penerapan sistem dalam pemantauan bangunan akan memungkinkan untuk prediksi cepat, cerdas dan akurat terhadap indeks kerusakan bangunan akibat gempa.
Kata kunci: bangunan, cerdas, indeks kerusakan, jaringan syaraf tiruan, monitoring
Abstract
An earthquake potentially destroys a tall building. The building damage can be indexed by FEMA into three categories namely immediate occupancy (IO), life safety (LS), and collapse prevention (CP). To determine the damage index, the building model has been simulated into structure analysis software. Acceleration data has been analyzed using non linear method in structure analysis program. The earthquake load is time history at surface, PGA=0105g. This work proposes an intelligent monitoring system utilizing artificial neural network to predict the building damage index. The system also provides an alert system and notification to inform the status of the damage. Data learning is trained on ANN utilizing feed forward and back propagation algorithm. The alert system is designed to be able to activate the alarm sound, view the alert bar or text, and send notification via email to the security or management. The system is tested using sample data represented in three conditions involving IO, LS, and CP. The results show that the proposed intelligent monitoring system could provide prediction of up to 92% rate of accuracy and activate the alert. Implementation of the system in building monitoring would allow for rapid, intelligent and accurate prediction of the building damage index due to earthquake.
Keywords: artificial neural network, building, damage index, intelligent, monitoring
1. Introduction
index. Since the collection of data from the accelerometer normally takes a long time, it triggers an idea to develop an intelligent monitoring system which would allow data collection from the accelerometer and prediction of the damage index to be carried out rapidly and accurately.
The application of artificial intelligent on civil engineering field has been performed in relation to building/structure [5], [12], [13], [14] management and control [2], [3], [10], [13], disaster [6], [7] and earthquake [4], [8], [9]. Mostly, the algorithm utilized in the training process is back propagation or otherwise, radial basis is used by [5] in the research of reducing earthquake effects on nonlinear base isolated building. The implementation of ANN results in the prediction rate of over 96 % [2] and 98 % [3], [13]. This indicates that ANN is feasible and reliable to be applied as intelligent engine for prediction in civil engineering fields. This research will also utilize ANN in other case study on the prediction of building condition after an earthquake event that is enhanced with monitoring and alert system. The aim of this research is to develop an intelligent monitoring for prediction the building damage index due to an earthquake.
This paper is organized as follows; Chapter 2 explains the overview of damage index of building structure. Chapter 3 describes the proposed BP-ANN Architecture while Chapter 4 discusses the research methodology used in this research. Design and development of intelligent monitoring is explained in Chapter 5. Furthermore the results and discussion are described in chapter 6 and concluded thereafter.
2. Damage Index of Building Structure
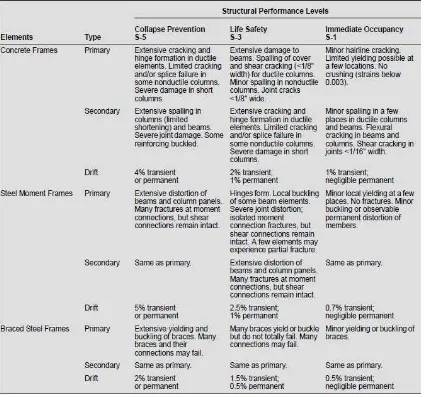
Damage index of building structure based on structural performance levels in FEMA 356 [1]. Each level has a wide range which can be defined by individual building owners. In the system, IO, LS and CP are denoted by index 1, 2 and 3 respectively. The structural performance levels criteria of concrete and steel element of building are shown in Table 1 below.
Structural performance levels are the indicator to explain the damage of structure element in post-earthquake evaluation. In the structure monitoring, the indicator is shown as alert or warning system.
3. Proposed BP-ANN Architecture
The intelligent monitoring uses Back-Propagation Artificial Neural Network (BP-ANN) to predict the building damage index. An architecture has been proposed in the previous research which consists of three layers involving input, hidden, and output layer as shown in Figure 1. Input layer involves 16 input cells that fetch data from the accelerometer, whereas hidden layer comprises of 32 cells/neurons connected to all outputs of the input cells. In output layer, 1 neuron is provided where its input connects to all outputs of the hidden cells.
Figure 1.The Proposed Architecture of BP-ANN [16]
Several equations derived from BP-ANN algorithm are utilized in computing the output of each neuron, error, Mean Squared Error (MSE), and the weight. Sigmoid activation function is utilized in each neuron and the output is calculated based on the following equation:
=
(
+
∑
ୀଵ
)
(1)Where sigmoid function (݂) is shown in equation (2):
=
ଵଵାష (2)
The error of output cell can be determined as follows:
Output cell:
=
−
(1 −
)
(3) Hidden cell:
=
∑
:வ
,
1 −
(4)The weights are updated as the following equations: Weights hidden to output:
∗,
=
,+
(6)Weights input to hidden:
∗,
=
,+
(7):
learning rateFurthermore, the ANN architecture was trained and tested using the following steps: (a) Simulating the earthquake occurred in such building to get the accelerometer and damage
index data using Finite Element Software Analysis. (b) Splitting the data into training and testing.
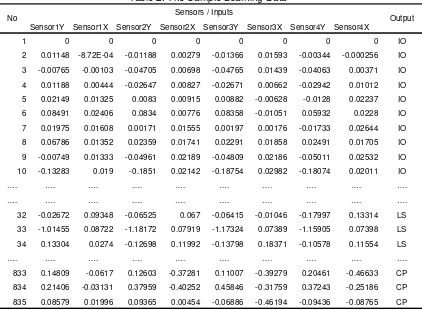
(c) Training the ANN using the data shown in Table 2. This process is iterated up to 1000 times with
is 0.1.(d) Testing the ANN with the data explained in Table 3.
(e) Save the weights to text file as the initial weight value for intelligent monitoring software.
Table 2. The Sample Learning Data
Sensor1Y Sensor1X Sensor2Y Sensor2X Sensor3Y Sensor3X Sensor4Y Sensor4X
1 0 0 0 0 0 0 0 0 IO
2 0.01148 -8.72E-04 -0.01188 0.00279 -0.01366 0.01593 -0.00344 -0.000256 IO 3 -0.00765 -0.00103 -0.04705 0.00698 -0.04765 0.01439 -0.04063 0.00371 IO 4 0.01188 0.00444 -0.02647 0.00827 -0.02671 0.00662 -0.02942 0.01012 IO 5 0.02149 0.01325 0.0083 0.00915 0.00882 -0.00628 -0.0128 0.02237 IO 6 0.08491 0.02406 0.0834 0.00776 0.08358 -0.01051 0.05932 0.0228 IO 7 0.01975 0.01608 0.00171 0.01555 0.00197 0.00176 -0.01733 0.02644 IO 8 0.06786 0.01352 0.02359 0.01741 0.02291 0.01858 0.02491 0.01705 IO 9 -0.00749 0.01333 -0.04961 0.02189 -0.04809 0.02186 -0.05011 0.02532 IO 10 -0.13283 0.019 -0.1851 0.02142 -0.18754 0.02982 -0.18074 0.02011 IO
…. …. …. …. …. …. …. …. …. ….
…. …. …. …. …. …. …. …. …. ….
32 -0.02672 0.09348 -0.06525 0.067 -0.06415 -0.01046 -0.17997 0.13314 LS 33 -1.01455 0.08722 -1.18172 0.07919 -1.17324 0.07389 -1.15905 0.07398 LS 34 0.13304 0.0274 -0.12698 0.11992 -0.13798 0.18371 -0.10578 0.11554 LS
…. …. …. …. …. …. …. …. …. ….
833 0.14809 -0.0617 0.12603 -0.37281 0.11007 -0.39279 0.20461 -0.46633 CP 834 0.21406 -0.03131 0.37959 -0.40252 0.45846 -0.31759 0.37243 -0.25186 CP 835 0.08579 0.01996 0.09365 0.00454 -0.06886 -0.46194 -0.09436 -0.08765 CP
No Sensors / Inputs Output
Based on the experiment conducted in previous research, the result of MSE obtained is 1.6 E-10 and the rate of prediction = 92%. Hence, the BP-ANN architecture is ready to be applied as an intelligent machine of building damage index monitoring system.
4. Research Methodology
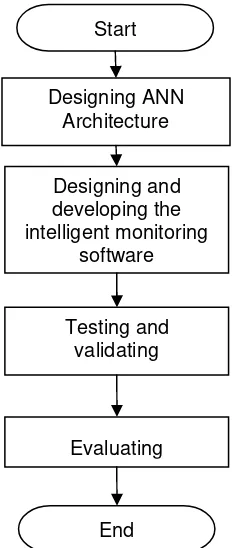
To achieve the aim, this research is conducted in several steps depicted in Figure 2. The steps are explained as follows:
(a) Designing ANN architecture including simulating the building damage index due to an earthquake, training and testing ANN, and obtaining the initial weights.
Table 3. The Sample Testing Data
Sensor1Y Sensor1X Sensor2Y Sensor2X Sensor3Y Sensor3X Sensor4Y Sensor4X
1 0 0 0 0 0 0 0 0 IO
2 0.014 -8.72E-04 -0.00936 0.00279 -0.01114 0.01593 -9.18E-04 -2.56E-04 IO 3 -0.01329 -0.00103 -0.05271 0.00699 -0.05331 0.01439 -0.04627 3.71E-03 IO 4 0.01552 0.00441 -0.02294 0.00825 -0.02323 0.00672 -0.0259 1.01E-02 IO 5 0.03516 0.01341 2.31E-02 0.00922 2.36E-02 -0.00693 0.00129 2.27E-02 IO 6 0.12355 0.02448 0.12261 0.00751 0.12286 -0.0106 0.09897 2.24E-02 IO 7 0.03371 0.01502 0.01339 0.01612 0.01351 0.00402 -0.00405 2.62E-02 IO 8 0.09246 0.01322 0.04559 0.01769 0.0446 0.02025 0.04853 1.61E-02 IO 9 -0.00788 0.01372 -0.04681 0.02156 -0.04454 0.01758 -0.05108 2.74E-02 IO 10 -0.1788 0.0211 -0.22818 0.02019 -0.23116 0.02806 -0.22604 2.01E-02 IO
…. …. …. …. …. …. …. …. …. ….
90 0.02086 0.07325 -0.07237 0.08811 -0.07333 0.09062 -0.0906 0.11632 LS 91 0.03517 0.08069 -0.16619 0.09481 -0.096 0.11093 -0.121 0.12003 LS 92 -0.0574 0.13524 -0.17086 0.10049 -0.11818 0.05812 -0.23251 0.15577 CP 93 -0.10365 0.16339 -0.15026 0.14706 -0.14032 0.06875 -0.28638 0.22109 CP
…. …. …. …. …. …. …. …. …. ….
98 0.01318 9.75E-04 0.01694 -0.03709 0.01493 -0.03715 0.01878 -0.03998 IO 99 0.04583 -0.01932 0.04199 -0.03572 0.0287 -0.03548 0.05436 -0.05473 IO 100 0.11601 -0.03066 0.10189 -0.03402 0.08294 -0.03419 0.11749 -0.0601 IO
No Sensors / Inputs Output
Figure 2. Steps of Research Methodology Start
End Designing ANN
Architecture
Designing and developing the intelligent monitoring
software
Testing and validating g
(c) Designing and developing the alert system (d) Testing and validating
(e) Evaluating
Figure 2 shows the research methodology used in this study. Designing the ANN architecture is the core of prediction engine to determine the building damage index based on the fetched data from accelerometer. The architecture consists of 16 input cells, 32 hidden cells, and 1 output cell. The training and testing result [16] indicate that the ANN could predict the building damage index with the accuracy rate of up to 92%. The second step is designing and developing the intelligent monitoring software utilizing VB.NET. The software scope is defined to handle the following tasks; collecting the inputs from accelerometer, feeding forward the inputs to ANN, predicting the output as building damage index, and providing the alert if the result is LS or CP. To test and validate the software, the sample data, including three outputs; IO, LS, and CP are tested and the software has to show the input data in number and line chart, and the notification in text, color bar, and email alert. The last step is evaluation stage that collects the lacks of software found by the user and makes the necessary correction.
5. Design of Intelligent Monitoring
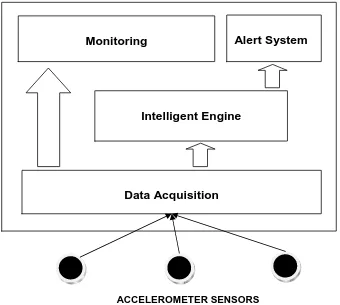
Building intelligent monitoring has a main function on the prediction of damage index when an earthquake occurred. Several components/modules that supported the main function include data acquisition module, intelligent engine module, alert system module, and monitoring module. The framework is illustrated in Figure 3.
Figure 3. Intelligent Monitoring Framework
Figure 3 is a proposed framework of building intelligent monitoring that contains several modules or components. The descriptions of each module are discussed as follows:
Monitoring
Alert System
Intelligent Engine
Data Acquisition
- Accelerometer Sensor: vibration or acceleration of the building can be measured by accelerometer sensor. When an earthquake occurred, there is acceleration caused by gravity. The acceleration signals are identified into three-axis direction. Thus the sensors provide the acceleration data and transfer the signal to the data acquisition module.[ Thesis Graham]
- Data Acquisition: The acceleration signals from many sensors are gathered in the data acquisition module. This module converts the electric signal fetched from sensor to the digital data that can be processed by the software into different data format transferred to intelligent engine and monitoring module. Data acquisition includes timestamp, acceleration data X, Y, and Z direction.
- Intelligent Engine: The prediction of building damage index is determined by inserting the acceleration data from data acquisition module to the input of intelligent engine. The core of this engine is the ANN that has 92% prediction rate through the training and testing process in the previous research [ ]. All of the input data should be normalized before feeding forward to the ANN. The prediction output is presented in three levels namely IO (safe), LS (moderate safe), and CP (total damage).
- Monitoring: The acceleration data from data acquisition are shown in the monitoring screen. It enables the user to see the progress of reading data from the sensors. In this module the acceleration data are presented in line chart and numeric value.
- Alert System: When the prediction output indicated to LS and CP, alert system notifies the user that the condition of the building is not secure. The alerts are provided into three formats namely alert bars showing in different color (IO: green, LS:orange, and CP:Red), alert sound/alarm, and alert-mail sending to the user.
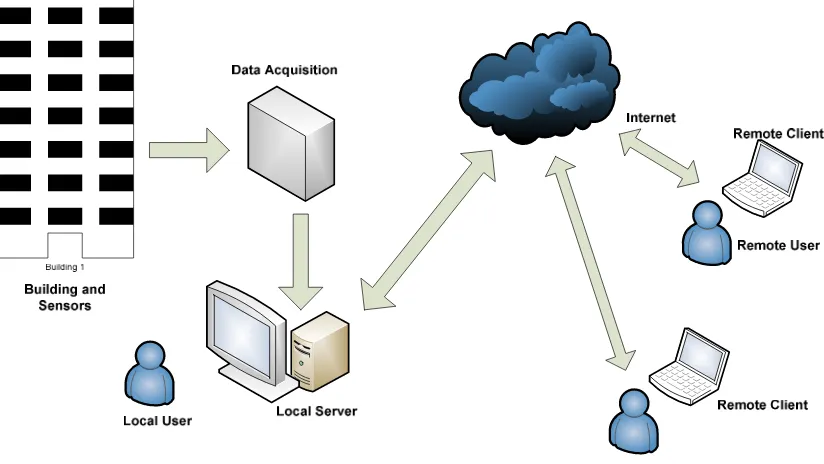
The modules that are mentioned above are developed utilizing VB.NET provided in two versions involving local and remote monitoring. The local monitoring is located in the building whereas the remote monitoring accesses the data from any places via internet. HTTP server is utilized to provide the remote data that has a script converting acceleration data to HTML format. The illustration of the two accessed methods is shown in Figure 4.
Figure 4. Intelligent Monitoring Architecture
specific points, generally located in the basement, middle, and roof of building. Data emerging from sensors are fetched by data acquisition module. Furthermore, the local server normalizes the acceleration data and carries out the prediction. Remote client is able to monitor the acceleration data using remote monitoring software that has the similar function with local server including intelligent engine, alert system and monitoring. The client can obtain the remote data from the server which could also convert acceleration data to HTML format.
6. Result and Analysis
The developed intelligent monitoring is tested with two types of data namely dummy and real data. The dummy data shown in Table 4 is the sample data obtained from the learning data that contains three outputs in IO, LS, and CP. The real data comes out from the sensors that represent the building acceleration either due to an earthquake or not.
Table 4. The Sample Data for Testing
Sensor1Y Sensor1X Sensor2Y Sensor2X Sensor3Y Sensor3X Sensor4Y Sensor4X
1 0 0 0 0 0 0 0 0 IO
2 0.01148 -8.72E-04 -0.01188 0.00279 -0.01366 0.01593 -0.00344 -0.000256 IO 3 -0.00765 -0.00103 -0.04705 0.00698 -0.04765 0.01439 -0.04063 0.00371 IO 4 0.01188 0.00444 -0.02647 0.00827 -0.02671 0.00662 -0.02942 0.01012 IO 5 0.02149 0.01325 0.0083 0.00915 0.00882 -0.00628 -0.0128 0.02237 IO 6 -0.02672 0.09348 -0.06525 0.067 -0.06415 -0.01046 -0.17997 0.13314 LS 7 -1.01455 0.08722 -1.18172 0.07919 -1.17324 0.07389 -1.15905 0.07398 LS 8 0.08491 0.02406 0.0834 0.00776 0.08358 -0.01051 0.05932 0.0228 IO 9 0.01975 0.01608 0.00171 0.01555 0.00197 0.00176 -0.01733 0.02644 IO 10 0.06786 0.01352 0.02359 0.01741 0.02291 0.01858 0.02491 0.01705 IO 11 0.14809 -0.0617 0.12603 -0.37281 0.11007 -0.39279 0.20461 -0.46633 CP 12 0.21406 -0.03131 0.37959 -0.40252 0.45846 -0.31759 0.37243 -0.25186 CP
Data Sensors / Inputs Output
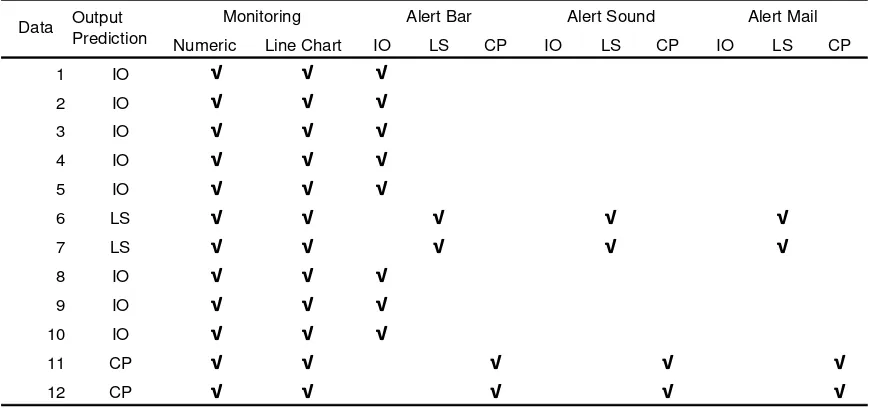
Table 5. The Check List Result
Numeric Line Chart IO LS CP IO LS CP IO LS CP
1 IO
√
√
√
2 IO
√
√
√
3 IO
√
√
√
4 IO
√
√
√
5 IO
√
√
√
6 LS
√
√
√
√
√
7 LS
√
√
√
√
√
8 IO
√
√
√
9 IO
√
√
√
10 IO
√
√
√
11 CP
√
√
√
√
√
12 CP
√
√
√
√
√
Alert Bar Alert Sound Alert Mail Data Output
Prediction
Monitoring
The test carried out using dummy data indicates that the developed intelligent monitoring could perform its functionalities including monitoring, predicting, and alerting. To validate the testing result in order to deal with the functionalities, the check list method is used that describes the value of inputs and the behaviour of the software. Table 5 shows the testing result of its functionalities.
Based on the result shown in Table 5, the monitoring has successfully displayed all of the input data in numeric value and line chart. The alert system has triggered the alert bar, sound and mail if the output prediction goes to LS and CP. The results indicate that the functionalities of the intelligent monitoring have met system requirements. The real data have been tested too, but the output prediction always goes to IO/safe since there is no earthquake event occurrence when the testing was done.
7. Conclusion
This paper has described the intelligent monitoring to predict the building damage index using artificial neural network. The work has been done involving designing the ANN architecture including its learning and testing, designing and developing the intelligent monitoring software in two versions; local and remote monitoring, and testing and validating. According to the result, the developed software could predict the acceleration data and trigger the alert system if the output indicates to moderate safe (LS) and total damage (CP). Applying the system will help the user to determine the building status whenever an earth quake occurred.
Acknowledgment
The authors would like to thank to Politeknik Negeri Semarang, Universitas Riau and Structural Earthquake Engineering Research (SEER) Faculty of Civil Engineering Universiti Teknologi Malaysia for the support given throughout this study.
References
[1] FEMA356 (2000). Prestandard and Commentary for The Seismic Rehabilitation of Buildings. Federal Emergency Management Agency. FEMA 356.
[2] Chen-wen Y, Jian Y. Application of ANN for the Prediction of Building Energy Consumption at Different Climate Zones with HDD and CDD. 2nd International Conference on Future Computer and Communication (ICFCC). Wuhan China. 2010; 3: i-xxiii.
[3] Tugce K, Murat G, Selcen B. Artificial Neural Network to Predict Daylight Illuminance in Office Building. Building and Environment. 2009; 44(8): 1751-1757.
[4] Jun-Jie W, Hui-Ying G, Ming-Qiong L. Seismic Damage Prediction of Multistory Building Using GIS and Artificial Neural Network. Sixth International Conference on Natural Computation (ICNC). Shandong China. 2010; 8: 1821-1824.
[5] Sriram N, Suresh S, Sundararajan N. Direct Adaptive Neural Controller for Earthquake Excited Nonlinear BaseIsolated Buildings. 22nd IEEE International Symposium on Intelligent Control. Singapore. 2007: 138-143.
[6] Jing C, Qingjie Z, Youpo S. Predictive Model of Artificial Neural Network for Disaster Prevention. 2nd IEEE International Conference on Information Management and Engineering (ICIME). Chengdu, China. 2010: 365-369.
[7] Chen Y, Liu T, Liu W. Predictive Model of Artificial Neural Network for Earthquake Influence Analysis
International Forum on Information Technology and Application (IFITA). Chengdu, China. 2009; 1: 20-23.
[8] Wang J, Gao H, Xin J. Application of Artificial Neural Network and GIS in Urban Earthquake Disaster Mitigation. International Conference on Intelligent Computation Technology and Automation (ICICTA). Changsha, Hunan, China. 2010; 1: 726-729.
[9] Lei S, Jin W. Application of Artificial Neural Network to Predict the Hourly Cooling Load of an Office Building. International Joint Conference on Computational Science and Optimization. Sanya, Hainan, China. 2009; 1: 528-530.
[11] Ju H, Li JW. Application of Artificial Neural Network Approach for Intelligent Building in China. Fourth International Conference on Computer Sciences and Convergence Information Technology. Seoul, Korea. 2009; 1: 1320-1324.
[12] Li Q, Xiaoying D. Research on Selection of Tall Building Structures Based on Artificial Neural Network. Sixth International Conference on Natural Computation (ICNC). Shandong China. 2010; 8: 1808-1811.
[13] Yan CW, Yao J. Research on the Optimization of Building Energy Efficient Measures Based on Incremental Costs. 2nd International Conference on Computer Engineering and Technology (ICCET). Chengdu China. 2010; 6: 184-187.
[14] Chen XJ, Gao ZF, Wang W. Application of BP Artificial Neural Network in Structure Damage Identification. International Conference on Intelligent Computation Technology and Automation (ICICTA). Changsha, Hunan, China. 2010; 1: 733-737.
[15] Jones TM. AI Application Programming. Massachusetts: Charles River Media, INC. 2003: 94-100. [16] Mardiyono, Suryanita R. Prediction of Building Condition after Earthquake Using Artificial Neural