Serum folate levels among healthy infants aged 6–8 months: relation to infants’
nutritional status indicators and maternal knowledge-attitude-practice
Tutik Ernawati,1 Saptawati Bardosono,1 Rini Sekartini2
1 Departemen Nutrition, Faculty of Medicine, University of Indonesia, Jakarta, Indonesia 2 Departemen Child Health, Faculty of Medicine, University of Indonesia, Jakarta, Indonesia
Abstrak
Latar belakang: Defi siensi vitamin B12dan asam folat dapat menyebabkan anemia yang selanjutnya dapat mempengaruhi tumbuh kembang anak. Penelitian ini bertujuan untuk mengetahui kadar folat serum bayi usia 6–8 tahun dan korelasinya terhadap indikator status gizi bayi dan pengetahuan-sikap-perilaku ibu tentang pola makan bayi.
Metode: Rancangan penelitian potong lintang dilakukan pada 55 bayi usia 6–8 bulan yang memenuhi kriteria penelitian dan ibunya sebagai responden. Data yang dikumpulkan meliputi usia, jenis kelamin, panjang badan, berat badan, asupan kalori, protein dan folat (menggunakan metoda food frequency questionnaire semi–kuantitatif dan recall 24 jam), sedangkan pada responden meliputi usia, tingkat pendidikan, penghasilan keluarga, status bekerja dan pengetahuan– sikap–perilaku terkait pemberian makan bayi (ASI dan MPASI).
Hasil: Penelitian ini mendapatkan median kadar folat serum adalah 43,05 nmol/L dengan kadar terendah 19,92 nmol/L dan kadar tertinggi 104,24 nmol/L. Diantara faktor–faktor terkait yang diteliti, didapatkan korelasi positif bermakna antara kadar folat serum dengan asupan protein dan asupan folat.
Kesimpulan: Disarankan agar bayi sejak usia 6 bulan mendapatkan makanan pendamping ASI yang kaya akan protein folat sehingga diharapkan dapat mempertahankan kadar normal folat serum. (Med J Indones 2011; 20:138-42)
Abstract
Background: Vitamin B12 and folate defi ciency can cause anemia which may lead growth and development impairments. This study was aimed to determine serum folate levels among infants aged 6–8 months and the relation to infants’ nutritional indicators and maternal knowledge-attitude-practice about infant feeding.
Methods: A cross–sectional design was implemented in infants aged 6–8 months and their mothers as respondents who met the study criteria. Data collected among the infants included sex, age, length, weight, intake of energy, protein and folate (based on a one–month semi–quantitative FFQ and a 24–hour food recall), serum folate and hemoglobin levels. Data collected among the mothers included age, education level, income based on average minimum monthly wage, knowledge, attitude and behavior concerning infant’s feeding, i.e. breast milk and complementary feeding practices. Results: This study found that the median of serum folate levels was 43.05 nmol/L with values ranging from 19.92 nmol/L to 104.24 nmol/L. Serum folate level had a strong positive correlation with its related factors, protein and folate intake. Conclusions: Protein-folate–rich complementay food should be provided to infants aged 6 months and over to maintain serum folate level. (Med J Indones 2011; 20:138-42)
Key words: Folate, infants, nutrient intake, nutritional status
Correspondence email to: [email protected]
The issue of nutrition for infants is multidimensional and infl uenced by a number of factors such as social, economic, biological, environmental, which have impact on nutritional adequacy, nurture, and the health of infants. Low hemoglobin (anemia) has been a primary problem in Indonesia, in addition to defi ciencies in calories, protein, vitamin A, and iodine.1 Anemia among infants
and toddlers of three years or younger will affect their growth and development as well as their intelligence, and may increase susceptibility to diseases due to low immunity.2 In addition to iron defi ciency, anemia can
be caused by vitamin B12 and folate defi ciencies and other factors.3 In the case of anemia induced by folate
defi ciency, the critical time is during infancy, since newborn children have an adequate supply of folate for three to six months. Afterwards, the supply gradually decreases as the infant grows since breastfeeding alone
does not suffi ciently meet the need of folate.4 During this
period of age from 6 to 12 months successful nutritional intervention by providing complementary food (CF) is highly infl uential. Therefore, CF should be in good quality and quantity (containing energy, protein, iron, vitamin A, folate as well as other vitamins and minerals).5
A study conducted in 6 locations in Indonesia showed that macro- and micronutrition indicators of CF given to infants were lower than the Nutritional Adequacy Level for Indonesia (RDA).6 Another study categorized 82%
of CF given to infants as poor.7 The correlation between
education and knowledge of mothers was very signifi cant since poor education and knowledge will leads to poor nurture.8 The objective of this study is to determine serum
METHODS
Subjects
The subjects were infants aged 6–8 months recruited from several selected Community health center in Kampung Melayu Jakarta during November 2009 to February 2010 who met the study criteria: 1) male and female infants aged 6–8 months, 2) having normal gestational age and birth weight, 3) apparently healthy and permitted by the mothers as the respondent to participate in this study.
Study design
The study used a cross–sectional design to determine the correlation between serum folate level and infant’s nutritional status indicators (i.e. energy, protein and folate intake, weight–for–age Z–score, height–for–age Z–score, weight–for–height Z–score and hemoglobin level) and maternal knowledge, attitude and practice about infant feeding.
Methods for data collection
Interviews with the respondents were conducted to obtain data concerning the characteristics of subjects and respondents, to fi nd out the infants’ intake from breast feeding and complementary feeding using the 24–hour food recall and a one month semiquantitative FFQ to assess the adequacy of energy, protein and folate intake among the research subjects.9 In addition to interview,
the respondents were also asked to fi ll out a questionnaire on their knowledge, attitude and behavior towards breast feeding and complementary feeding.
Energy, protein, and folate intake obtained from a 24– hour basis food recall and a semiquantitative FFQ of a month was converted into grams and analyzed by using the 2007 Nutrisurvey Program.9,10
Each subject´s weight and height were measured twice to obtain the average measure. Nutritional status indicators were analyzed using WHO Anthro 2005 Program.11
The laboratory examinations performed include the assessment of hemoglobin and serum folate levels. The sample of venous blood (1.5 mL) was drawn from the cubiti region after disinfection with alcohol 70%. The hemoglobin level was assessed using HemoCue method by placing two drops of blood into the microcuvette. After the microcuvette was completely fi lled, it was placed in the HemoCue photometer. After several seconds, fi gures indicating hemoglobin level would appear to be recorded.12 The remaining blood was
placed in a vacutainer and sent to Prodia Laboratory to assess the serum folate level using a method of competitive immunoassay by using Immulite 2000 Folic Acid automated analyzer.13,14
Statistical analysis
All statistical analyses were performed using SPSS for windows version 11.5. Data were expressed as mean ± SD for normally distributed data and median (minimum–maximum) for the non–normally distributed data. Normality of the data distribution was checked using Kolmogorov–Smirnov test before they underwent further analysis. Correlation between serum folate and infants’ nutritional status indicators and maternal knowledge-attitude-practice about infant feeding were performed using Pearson or Spearman–rank test. Power of the study was 0.90 based on assumption to be able to have suffi cient strength of correlation (r = 0.4) to its related factors and probability for type I error α=0.05.15
RESULTS
Subjects and respondents of the study
There were 55 subjects and respondents recruited into the study. Interviews were done to collect data on characteristics of the subjects for sex, age, birth weight and length, and of the respondents including age, educational level, family income, working status, knowledge, attitude and practice. Anthropometric measures to determine nutritional status indicators of the subjects included weight, height and Z-scores for weight-for-age, height-for-age and weight-for-height. Blood samples were used to determine infants’ serum folate and hemoglobin levels.
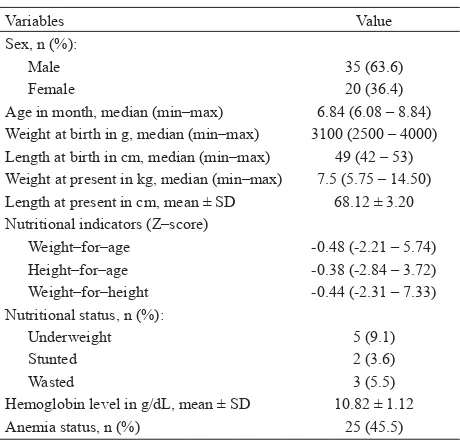
Subjects consisted of 35 male and 20 female infants with median age of 6.84 months. The median weight was 7.5 kg and the average of length was 68.12 ± 3.20 cm. Among the subjects, 9.1% were underweight, 3.6% were stunted, 5.5% were wasted, and 45.5% were anemic, as shown in Table 1.
Variables Value
Sex, n (%):
Male 35 (63.6)
Female 20 (36.4)
Age in month, median (min–max) 6.84 (6.08 – 8.84) Weight at birth in g, median (min–max) 3100 (2500 – 4000) Length at birth in cm, median (min–max) 49 (42 – 53) Weight at present in kg, median (min–max) 7.5 (5.75 – 14.50) Length at present in cm, mean ± SD 68.12 ± 3.20 Nutritional indicators (Z–score)
Weight–for–age -0.48 (-2.21 – 5.74) Height–for–age -0.38 (-2.84 – 3.72) Weight–for–height -0.44 (-2.31 – 7.33) Nutritional status, n (%):
Underweight 5 (9.1)
Stunted 2 (3.6)
Wasted 3 (5.5)
The average age of the respondents was 29.56 ± 4.98 years, and 14.5% of them were 35 years and over. More than 50% of them had low educational level and had low family income, and only 18.2% of them were working, as shown in Table 2. Furthermore, in relation to infant feeding, table 3 shows that only 18.2% of the respondents had good knowledge and attitude, and only 23.6% of them had good practice.
Nutrient intakes
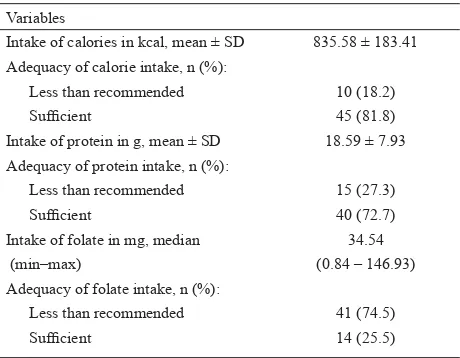
In relation to infant–feeding practice, although the average intake of calories and protein were in accordance to the RDA (recommended dietary allowance) for Indonesia, 18.2 % of the infants had insuffi cient calorie intake and 27.3% of them had suffi cient protein intake. Furthermore, the median of folate intake was far below its RDA, and accordingly, 74.5% of the infants had insuffi cient folate intake, as shown in table 4.
Serum folate level
Table 5 shows that the average of serum folate level was 48.97 nmol/L and there was no infant with serum folate defi ciency. Among the variables associated to the serum folate level, table 6 shows that daily protein and folate intake were signifi cantly correlated with the serum folate level. Variables
Family income category, n (%):
Below UMR 30 (54.5)
In accordance with UMR 25 (45.5) Working status, n (%)
Working 10 (18.2)
Not working 45 (81.8)
Table 2. Characteristics of respondents (n = 55)
UMR, upah minimal regional for Jakarta (minimal regional payment)
Variables
Intake of calories in kcal, mean ± SD 835.58 ± 183.41 Adequacy of calorie intake, n (%):
Less than recommended 10 (18.2)
Suffi cient 45 (81.8)
Intake of protein in g, mean ± SD 18.59 ± 7.93 Adequacy of protein intake, n (%):
Less than recommended 15 (27.3)
Suffi cient 40 (72.7)
Intake of folate in mg, median (min–max)
34.54 (0.84 – 146.93) Adequacy of folate intake, n (%):
Less than recommended 41 (74.5)
Suffi cient 14 (25.5)
Table 4. Intake of calorie, protein and folate of the subjects (n = 55)
Variables
Level of knowledge, n (%):
Low 26 (47.3)
Suffi cient 19 (34.5)
Good 10 (18.2)
Level of attitude, n (%):
Low 15 (27.3)
Suffi cient 30 (54.5)
Good 10 (18.2)
Level of practice, n (%):
Low 25 (45.5)
Suffi cient 17 (30.9)
Good 13 (23.6)
Table 3. Knowledge, attitude and practice of respondents about infant feeding (n = 5)
Serum folate level, in nmol/L Value
Mean 48.97
± SD 18.72
Distribution:
Minimum 19.92
5th percentile 27.19 10th percentile 31.72 25th percentile 35.58
Median 43.05
75th percentile 53.93 90th percentile 80.17 95th percentile 89.01
Maximum 104.24
Variables Coeffi cient of correlation (r) p–value * KAP score:
Knowledge 0.213 0.118
Attitude 0.157 0.253
Practice 0.142 0.303
Nutritional status indicators:
Daily calorie intake -0.152 0.269 Daily protein intake 0.438 0.001 Daily folate intake 0.438 <0.001 Weight–for–age Z–score 0.071 0.609 Table 5. Serum folate level of subjects (n = 55)
Table 6. Relationship between folate serum level and its related factors
DISCUSSION
Based on the fi ndings of infants’ nutritional status, it can be concluded that the infants under the study were at low severity for chronic macronutrients defi ciencies because the proportion of underweight was less than 10%, and the proportion of stunted was less than 20%. However, the proportion of wasted infants between 5% and 9% shows that infants under the study were at risk of acute macronutrient defi ciencies that need immediate intervention. Furthermore, the proportion of anemia found in this study that was more than 40% which should be of high public health concern about micronutrient defi ciencies, especially dietary iron.16 In relation to cognitive development score, accompanied study on haemoglobin level and its relation to cognitive development score in infants aged 6–8 months revealed that the CAT (cognitive adaptive test) score was signifi cantly lower among subjects with hemoglobin value less than 11 mg/dL (p = 0.026).17
As the main concern in this study, serum folate level of infants aged 6–8 months was in a normal range and there were no subjects found in a defi cient state. This cross–sectional study also shows a signifi cant positive strong correlation between serum folate level and the intake of protein and folate. However, there was no signifi cant correlation between serum folate intake and nutritional status indicators, hemoglobin level, and knowledge–attitude–practice of mothers.
The normal folate status of infants aged 6-8 months is at a median level of 7.7 ng/mL ranging from 3.5 ng/mL to 16 ng/mL.16 In this study, the median serum folate
level was 19 ng/mL and ranged from 8.79 ng/mL to 46 ng/mL. This shows that serum folate level of the subjects was signifi cantly higher than the normal level. Theoretically, serum folate level is affected by several factors, i.e. dietary intake, increased requirement in infancy, folate malabsorption, and other pathological conditions. The adequate intake of folate for Indonesian infants of 7–12 months is 80 mg/day. In this study, the folate intake of the apparently healthy subjects ranged from 0.84 mg/day to 146.93 mg/day with the median of 34.54 mg/day, and it revealed that 41 from 55 subjects (74.5%) had folate intake less than 80% of its adequate intake (64 mg/day). The low folate intake found in this study was not in accordance with the fact that serum folate level was higher than normal. Furthermore, breast milk feeding alone normally provides approximately 50 mg/L, more than the median intake in our study. One reason for these discrepancies is certainly that the mean age of our infants was still under 7 months and the decrease of serum folate level due to low folate intake starts later, although at this age breast milk feeding already may be reduced and adequate CF not yet provided. Thus, the study should
be repeated with infants of 10-12 months of age to see whether serum folate levels are still high enough or rather declined under similar conditions, as we would expect.
Beside of the normal average of nutritional status indicators, in general, it is also evident that infants in our study have adequate supply from their mothers during fetal life that seems to maintain high serum levels still up to more than 6 months of age.
In spite of the above fi ndings, correlation between serum folate level and protein and folate intake was found signifi cant in this study, which also shows that protein intake was strongly correlated to the folate intake (Pearson–test: r = 0.761 and p<0.001). Theoretically, most of folate in the blood is in the form of 5–methyltetrahydrofolic acid and is transported in free form or loosely associated with serum proteins. Furthermore, a specifi c folate binding protein has been found in plasma. Folate-protein binding could explain that folate defi ciency may accompany protein defi ciency, which in turn can lead to kwashiorkor and chronic infection.18
Other factors, in particular, knowledge, attitude and practice of mothers on infant feeding neither correlated with serum folate levels nor with intake of protein and folate. However, this study revealed that total score of knowledge was signifi cantly correlated to the total score of attitude (Spearman–rank test: r = 0.421 and p=0.001), and also signifi cantly correlated to the total score of practice (Spearman–rank test: r = 0.750, and p<0.001). This fi nding could be benefi cial to plan for nutrition promotion to improve infants’ feeding practice to mothers, such as for choosing protein-and/or folate rich infant complementary food.
It can be concluded that, although the mean folate intake was lower than normal, serum folate levels among infants aged 6–8 months were in a normal range and had a signifi cant positive strong correlation with daily dietary protein and folate intake. In spite of these fi ndings, it is suggested that infants at the age of 6-8 months should be provided with protein–and/or folate– rich complementary food to have serum folate levels maintained when infants grow older.
REFERENCES
1. Permono B, Ugrasena IDG, Ratwita MA, editors. Anemia defi siensi besi. [monograph in the internet]. Copyright © OpenUrika 2006 Inc. [cited 2009 Aug 25]. Available from: http://www.pediatrik.com.htm/.
walking but not crawling in poorly nourished Zanzibari infants. J. Nutr. 2005;135: 814–9.
3. Han YH, Yon M, Han HS, Kim KY, Tamura T, Hyun TH. Folate content in human milk and casein–based formula and folate status in Korean infants. British J Nutr. 2009;101:1769–74.
4. Hay G, Johnston C, Whitelaw A, Trygg K, Refsum H. Folate and cobalamin status in relation to breastfeeding and weaning in healthy infants. Am J Clin Nutr 2008;88:105–14. 5. Siregar A, editor. Pemberian ASI eksklusif dan faktor–
faktor yang mempengaruhinya. [monograph in the internet]. Digitized by USU digital library; 2004. [cited 2009 Sept 8]. Available from: http://repository.usu.ac.id/ bitstream/123456789/3726/1/fkm-arifi n4.pdf/.
6. Strategi Nasional PP–ASI. Accessed from http ://www.gizi. net. October 17, 2009.
7. Sunardi D. Hubungan antara pola pemberian ASI dan MP ASI dengan stunting pada bayi usia 6–12 bulan di Tangerang. Jakarta [thesis]. Magister Sains Ilmu Gizi Klinik Fakultas Kedokteran Universitas Indonesia Program Pasca Sarjana, Program Studi ilmu Gizi Klinik; Universitas Indonesia; 2008.
8. Liaqat P, Rizvi MA, Qayyum A, Ahmed H and Ishtiaq N. Maternal education and complementary feeding. Pakistan J Nutr. 2006; 5 (6): 563-8.
9. Gibson, RS. Assessment of nutrient intakes from food consumption data. In: Gibson, RS. Principle of nutritional assessment (2nd ed). Oxford University Press: 2005. p258–45.
10. Oey KN. Daftar analisis bahan makanan. Balai Penerbit Fakultas Kedokteran Universitas Indonesia : 1992. p50–1. 11. World Health Organization. WHO child growth or length/
height for age, weight for age, weight for length, weight for height and body mass index for age: methods and development. Report of WHO Expert Committee. WHO 2006. Geneva. 12. HemCue B–Hemoglobin Photometer operating manual, 4th
Edition, June 1991.
13. Arcot J, Shrestha A. Folate: methods of analysis–a review. Trends in food science & technology. 2005;16:253–66. 14. Gibson, RS. Assessment of folate and vitamin B12 status.
In: Gibson, RS. Principle of nutritional assessment (2nd ed). Oxford University Press: 2005. p597–640.
15. Madiyono B, Moeslichan MzS, Sastroasmoro S, Budiman I, Purwanto SH. Perkiraan besar sampel. In: Sastroasmoro S, and Ismail S. Dasar-dasar metodologi penelitian klinis (2nd ed). Sagung Seto Jakarta ; 2002. p259-87.
16. World Health Organization. Physical status: The Use and Interpretation of Anthropometry. Report of WHO Expert Committee. WHO. Geneva ;1995. p161–225.
17. Kusumadewi D, Bardosono S, Sekartini R. Dietary iron intale, serum ferritin and haemoglobin levels, and cognitive development scores of infants aged 6-8 months. MJI; 2011.46-9.