RAINFALL INTERCEPTION BY NATURAL MONTANE FOREST
IN SUKABUMI, WEST JAVA
RACHMAT BINTORO
DEPARTMENT OF GEOPHYSICS AND METEOROLOGY
FACULTY OF MATHEMATICS AND NATURAL SCIENCES
RAINFALL INTERCEPTION BY NATURAL MONTANE FOREST
IN SUKABUMI, WEST JAVA
RACHMAT BINTORO
Final Assignment
To fulfill the requirements for a degree of Bachelor of Science
at the Department of Geophysics and Meteorology
Faculty of Mathematics and Natural Sciences
DEPARTMENT OF GEOPHYSICS AND METEOROLOGY
FACULTY OF MATHEMATICS AND NATURAL SCIENCES
FINAL ASSIGNMENT
Title
: Rainfall Interception by Natural Montane Forest in
Sukabumi, West Java
Name
:
Rachmat Bintoro
Student ID
:
G24102030
Approved by
1
stSupervisor
2
ndSupervisor
Prof. Dr. Ir. Daniel Murdiyarso
Ir. Bregas Budianto, Ass Dpl
NIP 130 804 892
NIP 132 089 516
Dean of
The Faculty of Mathematics and Natural Sciences
Bogor Agricultural University
Dr. drh. Hasim, DEA
NIP 131 578 806
BIOGRAPHY
ACKNOWLEDGEMENTS
Praise and thanks to Allah SWT for His blessing so that I can finish this final assignment entitle “Rainfall Interception by Natural Montane Forest in Sukabumi, West Java”. This assignment is required to fulfill the requirement in the Bachelor of Science degree program at the Department of Geophysics and Meteorology, Bogor Agricultural University.
I would like express my gratitude to those people who gave their help, morally and materially, during this final assignment. To Bapak and Mama ku for every prayer and support they provide. To Prof. Daniel Murdiyarso and Ir. Bregas Budianto as the supervisors, for their hospitality, patience, guidance, discussions, and comments through this final assignment. To CIFOR for the research funding. To my research-mate, who almost be my “secret lover”, Eko Laillatul Heryansah for all we’ve shared. To Mas Taufik at Laboratory of Hydrometeorology, Pak Bambang Dwi Dasanto, and Pak Hengky Sumisto for their comments, discussions, and advises. Instrumentation workshop’s crew (Pak Khaerun, Joko, Mian, Rokhmad, Hesti, Wiranto, and Idu), and Staff of Wanawisata Cangkuang Sukabumi (Pak Bahrudin, Pak Ujang, Pak Aos, Pak Yadi, A Dedi, and especially Pak Tua) for every help, knowledge sharing, and discussion. To Ahmad Rasyid Fadlilah Putera Ariyat and Agus Suprianto for statistics tutorial and advice. To Yulian Vendhy Firmansyah for his valuable advices and comments. To Pak Budi Kartiwa from BALITKLIMAT for the AWS data.
Bogor, March 2008
SUMMARY
Rachmat Bintoro. Rainfall interception by natural montane forest in Sukabumi, West Java. Supervised by Prof. Dr. Ir. Daniel Murdiyarso and Ir. Bregas Budianto, Ass. Dpl.
Interception is part of the rainfall that is intercepted by a vegetated canopy. Rain water intercepted would be stored temporarily on the canopy surface and later evaporated back to the atmosphere or falls down to the ground surface. Interception can not be measured directly, it is calculated as the difference between gross rainfall (measured above the canopy or in an open space) and net rainfall (measured beneath the canopy). Interception by a vegetated area reduces water yield of the area but existence of a vegetated area help reducing surface runoff and increasing the water infiltrated to the soil layer. Interception was variable from one forest stand to another (up to 50% of gross rainfall). Knowledge about interception of a watershed is important to better understanding the hydrological cycle of the watershed and further it would be one of the factors that should be taken into consideration when managing the watershed.
In this study, interception on the natural montane forest in Sukabumi, West Java was assessed. Three sampling plots were chosen in the forest margin to measure the net rainfall while gross rainfall data was obtained from the AWS located near the sampling plots. Net rainfall was partitioned into throughfall (part of rainwater that reaches the ground surface through the canopy gaps) and stemflow (part of rainwater that reaches the ground surface by flowing on the tree trunk) and measured using specialize developed instrument. At each plot, five troughs were placed on radial basis beneath the canopy to measure throughfall. Stemflow was measured on the main tree by a half-section of plastic tube which was nailed to the tree trunk in a circumference order. Those five troughs were connected to a tipping bucket for throughfall (TBT) while the nailed plastic tube was connected to a tipping bucket for stemflow (TBS). Each TBT and TBS was equipped with a magnetic censor that send signal to a PDA-based data logger and record at every tipping occurrence. The data was in the text format that can be read using MS Office Excel for further processing. As gross rainfall data used was in a 6-min interval, both throughfall and stemflow data were also grouped into 6-min order.
From 22 rain days’ measurement, typical distribution of gross and net rainfall could be seen. At every storm even, there would always be a time lag between gross and net rainfall. Gross rainfall was always measured earlier than the net rainfall because it would takes some times for saturating the canopy before rainfall could reach the ground surface. The quantity of water required for saturating the forest canopy referred as canopy capacity, it is 0.8 mm for the studied forest. But the time lag between gross and net rainfall could be short as the influence of free throughfall, it is part of the rainwater that reach the ground surface without ever touching the canopy. This could be possible because of the gaps or open space existence within the forest. The proportion of open space among forest canopy referred as canopy porosity, small value of it indicates that the forest canopy was dense. The studied forest has canopy porosity of 0.7 which show 70% of the forest canopy allows for free throughfall occurrence.
TABLE OF CONTENTS
TABLE OF CONTENTS ...vii
LIST OF FIGURES...viii
LIST OF TABLES ...viii
LIST OF APPENDICES ...viii
I. INTRODUCTION 1. 1. Background ...1
1. 2. Objectives ...1
II. LITERATURE REVIEW 2. 1. Spatial variability of gross rainfall ...1
2. 2. The role of canopy characteristics in controlling the net rainfall ...1
2. 3. Influence of canopy charateristics on interception loss...3
III. METHODS 3. 1. Study site...4
3. 2. Initial investigation ...4
3. 2. 1. Tipping bucket calibration ...4
3. 2. 2. Dynamic calibration result ...5
3. 3. Measurement principles ...6
3. 3. 1. Gross rainfall ...7
3. 3. 2. Net rainfall...7
3. 3. 2. 1. Throughfall...8
3. 3. 2. 2. Stemflow ...8
3. 3. Interception and canopy parameters estimations...8
IV. RESULTS AND DISCUSSION 4. 1. Typical distribution of gross and net rainfall ...9
4. 2. Throughfall ...9
4. 4. Stemflow ...13
4. 5. Interception loss ...14
V. CONCLUSION AND SUGGESTS 5. 1. Conclusion ...16
5. 2. Suggests ...16
LIST OF FIGURES
1. TBT (the big ones) and TBS (the small ones)...4
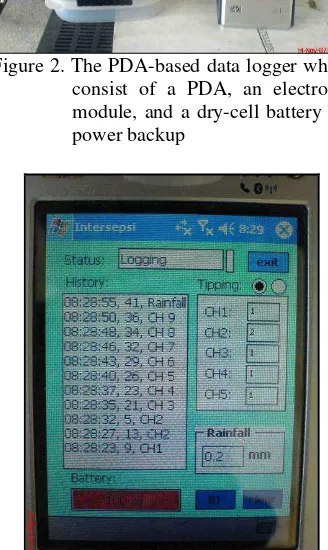
2. PDA-based data logger (consist of a PDA, an electronic module, and A dry-cell battery for power backup ...7
3. Data logger interface...7
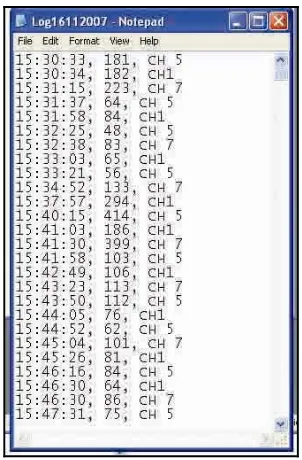
4. Generated file by data logger ...8
5. Plastic tube to collect stemflow...8
6. Typical gross and net ranfall distribution of the heavy-rainfall ...10
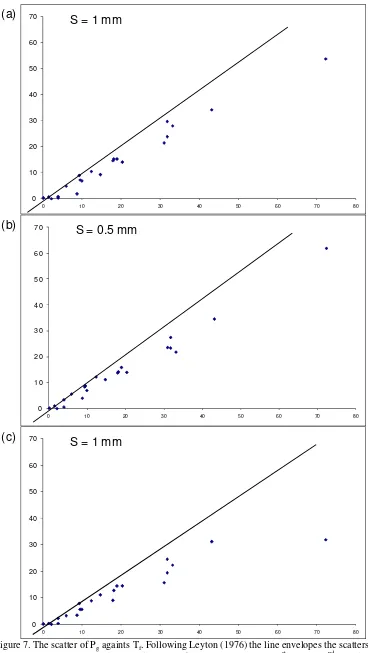
7. The scatter of Pg and Tf. Following Leyton (1967) the line envelopes the scatters and intercept y-axis indicating the value of canopy capacity, S at 1st plot (a), 2nd plot (b), and 3rd plot (c)...11
8. Relationship between Pg and Tf showing the slopes that indicates canopy porosity, p at 1st plot (a), 2nd plot (b), and 3rd plot (c)...12
9. Cumulative gross rainfall (402.0 mm) and net rainfall (286.6 mm) during measurement period showing a 29% of rainfall interception ...14
10. The scatter of Pg and interception showing a smaller portion of interception as total gross rainfall increases at 1st plot (a), 2nd plot (b), and 3rd plot (c)...15
LIST OF TABLES
1. Comparative results from other interception studies ...32. Canopy capacity and canopy porosity from others interception study ...4
3. Dynamic calibration equation of the tipping buckets...5
4. Depth per tip of TBT resulted from the dynamic calibration equation for a given T range values...6
5. Depth per tip of TBs resulted from the dynamic calibration equation for a given T range values...6
6. Rainfall classification...7
LIST OF APPENDICES
1. Interception components from each sampling plot ...182. Typical gross and net rainfall distribution at very-light-rainfall class...19
3. Typical gross and net rainfall distribution at light-rainfall class ...20
4. Typical gross and net rainfall distribution at normal-rainfall class ...21
5a. Measuring instruments at 1st sampling plot...22
5b. Measuring instruments at 2nd sampling plot...22
5c. Measuring instruments at 3rd sampling plot ...23
I. INTRODUCTION
1.1. Background
Interception is a process where a part of rain water retained on a vegetated canopy surface and later evaporated back to the atmosphere. Interception plays an important role on rainfall redistribution both spatially and temporally. During rainfall event, the canopy acts like a sponge for the rain water, after rain water fills the storage capacity then additional rain water could drip to the ground surface. This storage capacity is the function of canopy and rainfall characteristics. For a similar depth of gross rainfall that hit a canopy, a low intensity of rainfall would be higher intercepted than a high intensity of rainfall. More rain water would also be intercepted in an intermittent rainfall than in a continuous rainfall. This is because the rain water reaches to the canopy in a longer period, providing more time for the evaporation process.
Interception is calculated for a vegetated area and expressed as the proportion of gross rainfall. Other studies show a variable result of interception; Jackson (2000) found 10% of rainfall interception at Agroforestry system in Kenya while Schellekens et al. (1999) found 50% of rainfall interception in a lowland tropical rainforest at northeastern Puerto Rico.
In a watershed, existence of vegetated area is of importance to extent water availability for the ecosystem and to prevent flood. Knowledge of interception would leads to a better understanding of hydrology cycle in this area where interception is one of the processes that reduce the water input. Neglecting interception loss would result in an overestimation of water input in a catchments area. By taking into account the interception loss would result in more precise information when assessing a catchment water balance and later could lead to a better watershed management.
Previous study to assess the biophysical indicators of Cicatih watershed has been initiated by Pawitan et al. (2006), while this study focuses on assessing the hydrological function of the watershed which is about forest canopy ability to intercept rainfall.
1.2. Objectives
The objective of this study is to identify the potency of natural montane forest in rainfall interception.
II. LITERATURE REVIEW
2.1. Spatial variability of gross rainfall
Gross rainfall distribution varies spatially, but it could be assumed similar for a relatively small area. To anticipate the variability, researchers installed several rain gauges in their study site (such as Jackson 2000 and Chappell et al. 2001) while Schellekens (1999) used only one rain gauge. Many rain gauges allow researchers to get a representative data of gross rainfall but required extra effort for the maintenance. Some researchers put the rain gauge above the forest canopy (such as Asdak et al. 1998a and Schellekens 1999) to avoid forest edge effect.
Asdak et al. (1998a) put rain gauge 15 m above ground surface when they investigated the intercepton on tropical rainforest in Central Kalimantan so that the angle between the rain gauges and the top of nearest trees was greater than 45o to ensure no surrounding environment affect the measurement. Jackson (2000) used several rain gauges to measure gross rainfall during his interception study on agroforestry system in Kenya. The rain gauges were placed above the forest canopy and in an open space near the sampling area, and mean value from the rain gauges then used as the area’s gross rainfall. Schellekens (1999) used a single rain gauge placed above the canopy at 26 m on a scaffolding tower to obtain the gross rainfall, while Chappell et al. (2001) were using a network of 34 rain gauges located within 10 km2 to investigate the spatial structure of above-canopy rainfall.
Ford and Dean (1978) found that in a calm weather there was no difference between gross rainfall measured above tree within 20 m of the sampling area and those 300 m away (at 3 m lower and 5 m higher than surface level of the sampling area). But during windy weather, rain gauge place in the sampling area (above tree) measured less rainfall than those at 300 m away.
2.2. The role of canopy characteristics in controlling the net rainfall
canopy drip, often throughfall was higher than rainfall in the open space. In contras, Ford and Deans (1978) found largest amount of throughfall in small area close to the tree stem (case study of young Sitka Spruce Plantation). These show that throughfall variability was large caused by different canopy characteristics. This canopy variability should be taken into consideration when determining the troughs and/or gauges placement in the sampling plot so that the value could represent as much variability as existed in the forest stand.
From other interception studies (Table 1), throughfall could vary from 50 – 90 % of gross rainfall, which was obviously caused by the canopy variability. A conical canopy would have less throughfall than the broadleaved one because the thickness of a conical canopy would make rainfall that hit the top leaves to be dripped to the lower leaves. More water then required to saturate the whole canopy before the drops could reach ground surface. In contras, a broadleaved canopy was thin that would require less water to saturate its canopy and also makes water hit the top canopy surface could reach the ground surface in a shorter time as drip.
The quantity of water required to saturate a dry canopy referred as canopy capacity. During storm event, some raindrops hit the canopy, retained temporarily on its surface, then evaporated back to the atmosphere or flow down as canopy drip. The canopy would retain variably quantity of water on its surface depends on its structure (such as leaf size, surface character, and the nature of branching). Water would falls from the canopy as drip after the canopy get saturated, but some wind or turbulence might interference the retained water causing the canopy to retain less water and reduce the canopy capacity. Hall (2003) mentioned that for coniferous trees which have large leaf area index (LAI) but small canopy size, the wetting of the canopy determined by drip from upper leaves while for broadleaved trees with small LAI but large canopy size, raindrop size significantly influence the canopy capacity.
Canopy capacity did not have a certain interval of values because it was depend on the canopy characteristics. As shown in Table 2, canopy capacity from forest stands could vary between 1 – 3.5 mm but there was a possibility that in other canopy this
value could be less or more. Some forests which were dominated by broadleaved trees might have lower canopy capacity than the conical one and a single layer canopy would also have lower canopy capacity than the multi-storey one. It because in a broadleaved and single layer canopy, more canopy cover was exposed to the rainfall area so that less rainfall was required to saturate the whole canopy while in a conical and a multi-storey canopy, the same quantity of rainfall might only saturate the top leaves of the canopy but not the lower ones.
Jarvis (2000) found that epiphytes existence did add the total interception on a forest stand, but he could not mention the proportion of interception contributed by those epiphytes.
Despite raindrops that hit the canopy surface, other raindrops could reach the ground surface directly without ever touching the canopy, identified as free throughfall. The proportion of canopy gaps that allow rain water to reach ground surface without hitting the canopy first identified as canopy porosity. Its value varies between 0 -1. High canopy porosity would indicate large gaps existence in the forest canopy that allows large quantity of rain water falls as free throughfall. Hall (2003) mentioned that free throughfall contributes to the net rainfall that occurred in a short time lag with the gross rainfall. This means that when a forest has larger canopy porosity then the time lag between gross and net rainfall at the beginning of a rainfall event would be shorter because of the free throughfall contribution.
crown area, not dominated by their neighbors, and with the smoothest bark, collect the largest volume of stemflow (case study of laurel forest).
However, stemflow contributes a relatively small portion to the net rainfall (Table 2). Asdak et al (1998a) found stemflow 0.3 % of gross rainfall in the logged forest of Central Kalimantan. In this case, throughfall was controlling the net rainfall.
The sum of throughfall and stemflow measured identified as the net rainfall, the actual rainfall that reach the ground surface, and mentioned as the proportion to the gross rainfall. Obviously, canopy characteristics (leaf shape, size, surface character, and the nature of branching) did have great influence on the net rainfall, besides the rainfall distribution itself.
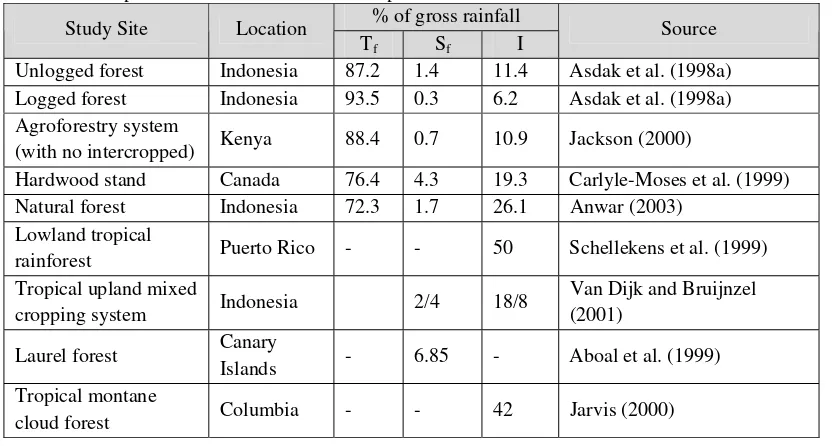
Table 1. Comparative result from other interception studies % of gross rainfall Study Site Location
Tf Sf I
Source
Unlogged forest Indonesia 87.2 1.4 11.4 Asdak et al. (1998a) Logged forest Indonesia 93.5 0.3 6.2 Asdak et al. (1998a) Agroforestry system
(with no intercropped) Kenya 88.4 0.7 10.9 Jackson (2000) Hardwood stand Canada 76.4 4.3 19.3 Carlyle-Moses et al. (1999) Natural forest Indonesia 72.3 1.7 26.1 Anwar (2003)
Lowland tropical
rainforest Puerto Rico - - 50 Schellekens et al. (1999) Tropical upland mixed
cropping system Indonesia 2/4 18/8
Van Dijk and Bruijnzel (2001)
Laurel forest Canary
Islands - 6.85 - Aboal et al. (1999) Tropical montane
cloud forest Columbia - - 42 Jarvis (2000)
2.3. Influence of canopy characteristics on Interception
Interception calculated as the difference between gross and net rainfall, it was influenced by both climatic and canopy factors. Rainfall depth, intensity and distribution (both temporally and spatially) were dominant climatic factors in interception. High portion of interception would be resulted from low small rainfall. This can be understood as in small rainfall, most of the water was used for saturating the canopy, causing only small portion or even none of the rainfall could reach the ground surface as net rainfall.
Hall (2003) mentioned that interception loss was relatively insensitive to the raindrops size which means that for different storm intensity, interception loss would not much differ from one to another. This might fit for the multi layer forest stands where large portion of throughfall contributed by canopy drip from upper layer canopy. This can be understood because kinetic energy
from high storm intensity would force water on the top canopy surface to splash out and dripped to the lower canopy layer. The same thing happens when low storm intensity occurred for a long rain period or as an intermittent event because it would allows for longer evaporation process from the canopy surface.
Gross rainfall in an interception study usually was a single value (whether obtained from a single rain gauge measurement or as average from several distributed rain gauges) for the whole study area to make canopy variability as the only cause for different net rainfall measured.
Table 2. Canopy capacity and canopy porosity from others interception study
Study Site Location Canopy Capacity, S (mm)
Canopy
Porosity, p Source Unlogged forest Indonesia 1.3 0.1 Asdak et al. (1998b)
Logged forest Indonesia 1 0.3 Asdak et al. (1998b)
Hardwood stand Canada 1 – 1.1 0.61 – 0.85 Carlyle-Moses et al. (1999) Natural forest Indonesia 1.3 0.7 Anwar (2003) Lowland coastal
rainforest Australia 3.5 0.035 Wallace et al. (2006) Lowland tropical
rainforest Puerto Rico 1.15 -
Schellekens et al. (1999) Lower montane
forest Ecuador 1.91 – 2.46 0.42 – 0.63
Fleischbein et al. (2005)
III. METHODS
3.1. Study site
Cibojong micro-watershed is a 1392 ha forested catchment in southern slope of mount Salak, part of upper Cicatih watershed with 50% of the land use was forest, 28.71% rice fields, 7.53% settlement, 6.87% shrubs, 5.79% mixture gardens, 0.94% farm land, and 0.24% grass (Pawitan et al. 2006).
The sampling plots were located at the margin area of the natural forest, near the camping ground and Guest House area of Wanawisata Cangkuang Sukabumi which belongs to Perum Perhutani. We choose three sampling plots with different canopy cover. The 1st sampling plot was an Agathis tree which has a conical canopy and small tree diameter. Canopy gaps were exist between the Agathis tree and the surrounding trees which were broadleaved canopy. The 2nd sampling plot was a broadleaved canopy which has a small canopy size and large portion of open space between its canopy and the surrounding trees. The tree diameter was larger and has a coarser surface than the Agathis. Some epiphytes did grow on the tree canopy but it was difficult to differentiate between the tree leaves and the epiphyte. The 3rd sampling plot was also a broadleaved canopy which has larger canopy size than the tree at 2nd sampling plot. It was a multi-storey canopy where the surrounding canopies were occupied the upper and lower position of the main tree canopy.
3.2. Initial investigation
This study used sets of instrument developed by Instrumentation workshop of Department Goephysics and Meteorology, Bogor Agricultural University for measuring the net rainfall. The instruments used were new, so we need to conduct an initial investigation to know its performance. The conducted initial investigation was about dynamic calibration of the tipping buckets used. This investigation aimed to identify the tipping buckets capability when measuring different flowrate of water.
3.2.1. Tipping bucket calibration
We used two different capacities of tipping buckets, named as tipping bucket for throughfall (TBT) which was used to measure throughfall and tipping bucket for stemflow (TBS) which was used to measure stemflow (Figure 2).
Figure 1. TBT (the big ones) and TBS (the small ones)
was beneath the inlet stream of water. It causes an underestimation between water measured by the tipping bucket and the actual water flowed. To avoid this underestimation, Calder and Kidd (1978) were suggesting that each of the tipping buckets should be calibrated dynamically.
We carried out the dynamic calibration according to the concept introduced by Calder and Kidd (1978) by pouring five different flowrate (Q) to every tipping bucket. A small water pump was used to produce a constant water flow to the tipping bucket. For TBT, each flowrate was carried out for approximately 50 tips while for TBS
were 100 tips. From the tips then we get the mean time between successive tips for each tipping bucket.
From each tipping bucket, five different flowrate values which were given then plotted against its mean time. After that we got the relationship between inverse of flowrate (1/Q) at the x-axis and its mean time (T) at y-axis in the form of linear regression equation (Table 3). Later, the equation would be used to determine the volume for each bucket tip during field measurement based on the time between two successive tips.
Table 3. Dynamic calibration equation of the tipping buckets
Sampling plot Bucket ID Dynamic Calibration Equation R2
TBS 9 T = 44.439(1/Q) + 0.3203 0.980 1st
TBT 10 T = 269.41(1/Q) + 1.1012 0.998 TBS 7 T = 44.439(1/Q) + 0.3202 0.980 2nd
TBT 6 T = 262.26(1/Q) + 1.5297 0.978 TBS 8 T = 44.439(1/Q) + 0.3202 0.980 3rd
TBT 9 T = 279.24(1/Q) + 1.6207 0.998
As the equation’s output volume was in milliliter (ml) unit while throughfall and/or stemflow value should be in millimeter (mm) unit, then the volume need to be divided by troughs size (for throughfall) or canopy size (for stemflow).
According to Calder and Kidd (1978), the equation resulted from dynamic calibration was as follow:
y = ax + b
Where: y = time between successive tipping bucket tips (sec) a = volume (ml)
x = 1/Q (s/ml)
b = intercept (sec), represents time required for the tipping bucket to tips when a minimum flowrate is given
To get volume of a bucket for each tip in a certain time interval:
Q b) (y Q 1 b y (a)
volume = − → − ×
While conversion from volume to depth-equivalent: ) 2 (cm size nopy troughs/ca 10 (ml) volume (mm)
depth = ×
Trough size = (200 × 15) cm2 = 3.000 cm2
Total of 5 troughs size = 3000 cm2 × 5 units = 15.000 cm2
3.2.2. Dynamic calibration result
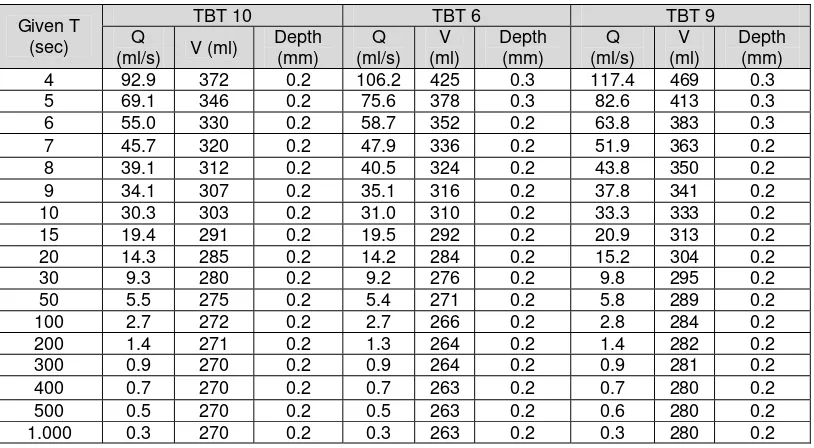
Table 4. Depth per tip of TBT resulted from the dynamic calibration equation for a given T range values
TBT 10 TBT 6 TBT 9
Given T (sec) Q
(ml/s) V (ml)
Depth (mm) Q (ml/s) V (ml) Depth (mm) Q (ml/s) V (ml) Depth (mm) 4 92.9 372 0.2 106.2 425 0.3 117.4 469 0.3 5 69.1 346 0.2 75.6 378 0.3 82.6 413 0.3 6 55.0 330 0.2 58.7 352 0.2 63.8 383 0.3 7 45.7 320 0.2 47.9 336 0.2 51.9 363 0.2 8 39.1 312 0.2 40.5 324 0.2 43.8 350 0.2 9 34.1 307 0.2 35.1 316 0.2 37.8 341 0.2 10 30.3 303 0.2 31.0 310 0.2 33.3 333 0.2 15 19.4 291 0.2 19.5 292 0.2 20.9 313 0.2 20 14.3 285 0.2 14.2 284 0.2 15.2 304 0.2 30 9.3 280 0.2 9.2 276 0.2 9.8 295 0.2 50 5.5 275 0.2 5.4 271 0.2 5.8 289 0.2 100 2.7 272 0.2 2.7 266 0.2 2.8 284 0.2 200 1.4 271 0.2 1.3 264 0.2 1.4 282 0.2 300 0.9 270 0.2 0.9 264 0.2 0.9 281 0.2 400 0.7 270 0.2 0.7 263 0.2 0.7 280 0.2 500 0.5 270 0.2 0.5 263 0.2 0.6 280 0.2 1.000 0.3 270 0.2 0.3 263 0.2 0.3 280 0.2
Table 5. Depth per tip of TBS resulted from the dynamic calibration equation for a given T range values
TBS 9 TBS 7 TBS 8
Given T (sec) Q
(ml/s) V (ml)
Depth (mm) Q (ml/s) V (ml) Depth (mm) Q (ml/s) V (ml) Depth (mm) 2 26.5 53 0.006 26.5 53 0.001 26.5 53 0.001 3 16.6 50 0.005 16.6 50 0.001 16.6 50 0.001 4 12.1 48 0.005 12.1 48 0.001 12.1 48 0.001 5 9.5 47 0.005 9.5 47 0.001 9.5 47 0.001 6 7.8 47 0.005 7.8 47 0.001 7.8 47 0.001 7 6.7 47 0.005 6.7 47 0.001 6.7 47 0.001 8 5.8 46 0.005 5.8 46 0.001 5.8 46 0.001 9 5.1 46 0.005 5.1 46 0.001 5.1 46 0.001 10 4.6 46 0.005 4.6 46 0.001 4.6 46 0.001 15 3.0 45 0.005 3.0 45 0.001 3.0 45 0.001 20 2.3 45 0.005 2.3 45 0.001 2.3 45 0.001 30 1.5 45 0.005 1.5 45 0.001 1.5 45 0.001 100 0.4 45 0.005 0.4 45 0.001 0.4 45 0.001 300 0.1 44 0.005 0.1 44 0.001 0.1 44 0.001 500 0.1 44 0.005 0.1 44 0.001 0.1 44 0.001 1.000 0.0 44 0.005 0.0 44 0.001 0.0 44 0.001
For the TBS, when the volumes were calculated into depth unit, tree with the smallest canopy size would have the largest depth (0.005 mm per tip) while for other trees even though its have different canopy size but have the same depth (0.001 mm per tip). On the other side, all TBT were having a similar value (0.2 mm per tip). Several tipping buckets (both TBS and TBT) did have higher depth value at its top flow range. This was in the same agreement as mentioned by Calder and Kidd (1978) that dynamic calibration was only significant at the top of flow range.
From the result, even though the tipping buckets did have different volume capacity at each side, it could produce an equal depth value for it’s both sides and were able to measure a very low throughfall and stemflow.
3.3. Measurement principles
3.3.1. Gross Rainfall
The gross rainfall data was gathered from the Automatic Weather Station (AWS) located nearby the sampling plots. It was available in several time formats (daily, hourly, and 6-minutes intervals) but for higher temporal resolution, the 6-min interval was used for further data processing. In this study, gross rainfall at the sampling plots and the AWS was assumed to be similar, so the difference occurred in the net rainfall measurement was expected only from the canopy variability.
Table 6. Rainfall classification
Class Depth (mm) Occurrence Date of
0.2 21-Nov-07 1.6 17-Nov-07 2.2 20-Nov-07 4.0 07-Nov-07 Very-light
4.0 14-Nov-07 6.0 29-Nov-07 8.8 31-Oct-07 9.4 06-Dec-07 9.6 09-Dec-07 10.0 02-Dec-07 12.4 29-Oct-07 18.0 27-Nov-07 Light
19.0 28-Oct-07 20.4 30-Oct-07 31.0 28-Nov-07 31.8 10-Nov-07 31.8 30-Nov-07 33.0 3&4-Dec-07 33.2 11-Nov-07 Normal
43.2 16-Nov-07 Heavy 72.4 11-Dec-07
Total 402 22 days
Presented in Table 6, gross rainfall is classified into four classes (very light, light, normal, and heavy) based on rainfall classification by Sosrodarsono and Takeda (2003). The values vary between 0.2 mm – 72.4 mm with total gross rainfall 402 mm. It is dominated by very-light and light classes which indicate that rainfall within the measurement period was relatively low; only one rain day is the heavy rainfall. According to it, 38% of gross rainfall occurred during measurement period was light rainfall, followed by 33% of normal rainfall, 24% of very light storm, and 5% of heavy rainfall.
3.3.2. Net rainfall
Net rainfall measurement was partitioned into throughfall and stemflow. Throughfall
and stemflow were measured using different instruments, but for the recording system, we used a single PDA-based data logger. This was possibly because every tipping bucket (both TBS and TBS) was equipped with a magnetic censor that would transmit a signal to the data logger through the wire medium at every tipping occurrence. The signal then recorded in a text file format (*.txt) that records information about the date of every tipping occurred and group it in a daily order.
Figure 2. The PDA-based data logger which consist of a PDA, an electronic module, and a dry-cell battery for power backup
Figure 4. Generated file by data logger
3.3.2.1. Throughfall
Throughfall at each sampling plot was measured using five troughs made of PVC pipe with the dimension of (200 x 15 cm) and placed randomly beneath the canopy in a radial base. The troughs were installed in parallel or near to flat angle to the ground surface in order to keep its catchments area approximately 200 cm x 15 cm using stanchion of bamboo. Each of the troughs was then connected to a TBT by a 0.5 inch plastic tube.
At 1st sampling plot, the main tree was an Agathis with its conical canopy, surrounded by other higher canopy. Some gaps between those canopies were exist that would allow large portion of free throughfall. Canopy drip at the main tree would be long enough after the gross rainfall begun as the canopy was thick.
At 2nd sampling plot, the main tree was the top canopy with large gaps from surrounding trees. Smaller and lower trees were exists but the main tree canopy was the largest. It was a thin canopy so large amount of drip might flow to the ground surface. Large portion of free throughfall was also possible because other canopies were smaller and lower that did not have large canopy size.
Densest canopy with some multi-storey existence was at 3rd sampling plot. Almost no rainfall could reach the ground surface without striking the canopy first; canopy drip was seemed contribute to most of throughfall measured.
3.3.2.2. Stemflow
For stemflow measurement, a part of the tree trunk near to breast height was chosen at each sampling plot. First, the trunk’s surface was slivered in a circumference order, and then a half-section of 1 inch plastic tube was nailed following the sliver pattern to trap water flow on the trunk surface. Water trapped by this plastic tube then channeled down to a TBS by a 0.5 inch plastic tube.
Figure 5. Plastic tube to collect stemflow
3.4. Interception and canopy parameters estimations
IV. RESULTS AND
DISCUSSIONS
4.1. Typical distribution of gross and net
rainfall
Even though gross rainfall at the AWS and the sampling plots were assumed to be in the same rainfall regime, 12 rain days of total measurement period seems to have some differences. The data logger was record net rainfall earlier than the AWS which indicates that the sampling plots receive gross rainfall earlier and possibly different quantity than the AWS.
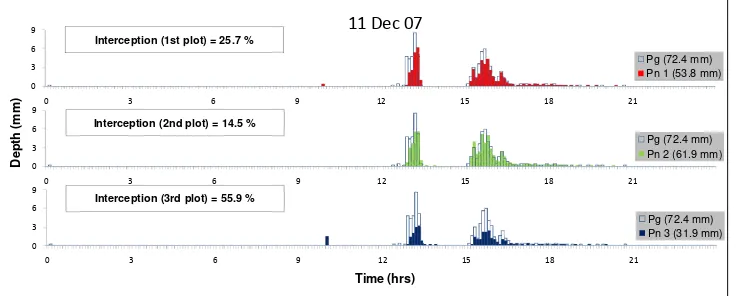
Figure 7 shows a typical distribution of gross and net rainfall in the heavy rainfall class. There is a time lag between gross and net rainfall where net rainfall occur approximately after 18 minutes of intermittent gross rainfall. It means that for the rainfall at 11 December, 18 minutes was required to saturate the forest canopy before net rainfall occurs. The net rainfall from each sampling plot occurs within the same time interval with similar quantity but as rainfall intensity increases, the three plots received different quantity of net rainfall. After the first rainfall stops, small quantity of net rainfall still occurs which indicates a canopy drainage process was in progress. In the 2
The measured Throughfall in this study is 71% of gross rainfall (286.6 mm) with variability found among sampling plots (61% - 78 % of gross rainfall). By the troughs arrangement which were placed on radial base and random beneath the canopy at each sampling plot it was hard to identify whether throughfall was large near the tree stem (such as found by Ford and Deans 1978) or large as distance increase from the tree stem (such as found by Leyton and Carlisle 1959) because throughfall measured would be an average from those troughs. As mentioned by Jarvis (2000), some epiphytes did also exist within the forest canopy but it was difficult to differentiate between the actual trees leaves and the epiphytes, so we can not estimate its proportion and its contribution to the throughfall.
nd
rainfall event at 11 December, the three sampling plots require 6 minutes to saturate the canopy and after that net rainfall occurred with different quantity. The 2nd plot received the largest quantity of net rainfall which possibly because the canopy has the largest portion of open space compared to the other plots while the 3rd plot receives the least which possibly because it has a multi-storey canopy so that rain water is distributed through the canopies.
As net rainfall assumed to occur after the canopy gets saturated, it indicates that canopy was in potential evaporation state at the moment where the canopy was able to evaporate water retained on its surface at the maximum degree, influenced only by the weather factor at the moment. The potential evaporation condition would continue until the gross rainfall stops, and then any net rainfall occurred after that was assumed as canopy drainage process.
Sometimes net rainfall was higher than the rainfall occurred in the open space within the same time intervals, this could be caused by the water stored in canopy surface from previous rainfall that was flow down to the ground surface together with current
rainfall drip. High wind speed or turbulence within the canopy gaps might be the source for this condition. Another possibility for a higher net rainfall measured was because actually a higher gross rainfall occurs at that sampling plot. This was in the same agreement with Ford and Dean (1978) who mentioned that in some condition, different gross rainfall might be measured between two adjacent places. This difference for the studied area might be caused by some wind occurred during rainfall event or the topography factor where the sampling plots are in a higher altitude than the AWS.
Presented in appendices 2 – 4, net rainfall at every rainfall classes occur in various time lag with the gross rainfall, depends on the intensity at the beginning of the rainfall. Small rainfall intensity and an intermittent rainfall would make net rainfall occur in a high time lag with the gross rainfall while high intensity of rainfall would reduce the time lag between gross and net rainfall.
4.2. Throughfall
11
Dec
07
0 3 6 9
0 3 6 9 12 15 18 21
Pg (72.4 mm) Pn 3 (31.9 mm) 0
3 6 9
0 3 6 9 12 15 18 21
Pg (72.4 mm) Pn 2 (61.9 mm) 0
3 6 9
0 3 6 9 12 15 18 21
Pg (72.4 mm) Pn 1 (53.8 m
Time (hrs)
m) Interception (1st plot) = 25.7 %
Interception (3rd plot) = 55.9 % Interception (2nd plot) = 14.5 %
Figure 6. Typical gross and net ranfall distribution of the heavy-rainfall showing a various proportion of net rainfall at each sampling plot in a 6-min time interval
D
e
0 10 20 30 40 50 60 70
0 10 20 30 40 50 60 70 80
S = 1 mm
(a)
0 10 20 30 40 50 60 70
0 10 20 30 40 50 60 70 80
S = 0.5 mm
(b)
0 10 20 30 40 50 60 70
0 10 20 30 40 50 60 70 80
S = 1 mm
(c)
RAINFALL INTERCEPTION BY NATURAL MONTANE FOREST
IN SUKABUMI, WEST JAVA
RACHMAT BINTORO
DEPARTMENT OF GEOPHYSICS AND METEOROLOGY
FACULTY OF MATHEMATICS AND NATURAL SCIENCES
RAINFALL INTERCEPTION BY NATURAL MONTANE FOREST
IN SUKABUMI, WEST JAVA
RACHMAT BINTORO
Final Assignment
To fulfill the requirements for a degree of Bachelor of Science
at the Department of Geophysics and Meteorology
Faculty of Mathematics and Natural Sciences
DEPARTMENT OF GEOPHYSICS AND METEOROLOGY
FACULTY OF MATHEMATICS AND NATURAL SCIENCES
FINAL ASSIGNMENT
Title
: Rainfall Interception by Natural Montane Forest in
Sukabumi, West Java
Name
:
Rachmat Bintoro
Student ID
:
G24102030
Approved by
1
stSupervisor
2
ndSupervisor
Prof. Dr. Ir. Daniel Murdiyarso
Ir. Bregas Budianto, Ass Dpl
NIP 130 804 892
NIP 132 089 516
Dean of
The Faculty of Mathematics and Natural Sciences
Bogor Agricultural University
Dr. drh. Hasim, DEA
NIP 131 578 806
BIOGRAPHY
ACKNOWLEDGEMENTS
Praise and thanks to Allah SWT for His blessing so that I can finish this final assignment entitle “Rainfall Interception by Natural Montane Forest in Sukabumi, West Java”. This assignment is required to fulfill the requirement in the Bachelor of Science degree program at the Department of Geophysics and Meteorology, Bogor Agricultural University.
I would like express my gratitude to those people who gave their help, morally and materially, during this final assignment. To Bapak and Mama ku for every prayer and support they provide. To Prof. Daniel Murdiyarso and Ir. Bregas Budianto as the supervisors, for their hospitality, patience, guidance, discussions, and comments through this final assignment. To CIFOR for the research funding. To my research-mate, who almost be my “secret lover”, Eko Laillatul Heryansah for all we’ve shared. To Mas Taufik at Laboratory of Hydrometeorology, Pak Bambang Dwi Dasanto, and Pak Hengky Sumisto for their comments, discussions, and advises. Instrumentation workshop’s crew (Pak Khaerun, Joko, Mian, Rokhmad, Hesti, Wiranto, and Idu), and Staff of Wanawisata Cangkuang Sukabumi (Pak Bahrudin, Pak Ujang, Pak Aos, Pak Yadi, A Dedi, and especially Pak Tua) for every help, knowledge sharing, and discussion. To Ahmad Rasyid Fadlilah Putera Ariyat and Agus Suprianto for statistics tutorial and advice. To Yulian Vendhy Firmansyah for his valuable advices and comments. To Pak Budi Kartiwa from BALITKLIMAT for the AWS data.
Bogor, March 2008
SUMMARY
Rachmat Bintoro. Rainfall interception by natural montane forest in Sukabumi, West Java. Supervised by Prof. Dr. Ir. Daniel Murdiyarso and Ir. Bregas Budianto, Ass. Dpl.
Interception is part of the rainfall that is intercepted by a vegetated canopy. Rain water intercepted would be stored temporarily on the canopy surface and later evaporated back to the atmosphere or falls down to the ground surface. Interception can not be measured directly, it is calculated as the difference between gross rainfall (measured above the canopy or in an open space) and net rainfall (measured beneath the canopy). Interception by a vegetated area reduces water yield of the area but existence of a vegetated area help reducing surface runoff and increasing the water infiltrated to the soil layer. Interception was variable from one forest stand to another (up to 50% of gross rainfall). Knowledge about interception of a watershed is important to better understanding the hydrological cycle of the watershed and further it would be one of the factors that should be taken into consideration when managing the watershed.
In this study, interception on the natural montane forest in Sukabumi, West Java was assessed. Three sampling plots were chosen in the forest margin to measure the net rainfall while gross rainfall data was obtained from the AWS located near the sampling plots. Net rainfall was partitioned into throughfall (part of rainwater that reaches the ground surface through the canopy gaps) and stemflow (part of rainwater that reaches the ground surface by flowing on the tree trunk) and measured using specialize developed instrument. At each plot, five troughs were placed on radial basis beneath the canopy to measure throughfall. Stemflow was measured on the main tree by a half-section of plastic tube which was nailed to the tree trunk in a circumference order. Those five troughs were connected to a tipping bucket for throughfall (TBT) while the nailed plastic tube was connected to a tipping bucket for stemflow (TBS). Each TBT and TBS was equipped with a magnetic censor that send signal to a PDA-based data logger and record at every tipping occurrence. The data was in the text format that can be read using MS Office Excel for further processing. As gross rainfall data used was in a 6-min interval, both throughfall and stemflow data were also grouped into 6-min order.
From 22 rain days’ measurement, typical distribution of gross and net rainfall could be seen. At every storm even, there would always be a time lag between gross and net rainfall. Gross rainfall was always measured earlier than the net rainfall because it would takes some times for saturating the canopy before rainfall could reach the ground surface. The quantity of water required for saturating the forest canopy referred as canopy capacity, it is 0.8 mm for the studied forest. But the time lag between gross and net rainfall could be short as the influence of free throughfall, it is part of the rainwater that reach the ground surface without ever touching the canopy. This could be possible because of the gaps or open space existence within the forest. The proportion of open space among forest canopy referred as canopy porosity, small value of it indicates that the forest canopy was dense. The studied forest has canopy porosity of 0.7 which show 70% of the forest canopy allows for free throughfall occurrence.
TABLE OF CONTENTS
TABLE OF CONTENTS ...vii LIST OF FIGURES...viii LIST OF TABLES ...viii LIST OF APPENDICES ...viii
I. INTRODUCTION
1. 1. Background ...1 1. 2. Objectives ...1
II. LITERATURE REVIEW
2. 1. Spatial variability of gross rainfall ...1 2. 2. The role of canopy characteristics in controlling the net rainfall ...1 2. 3. Influence of canopy charateristics on interception loss...3
III. METHODS
3. 1. Study site...4 3. 2. Initial investigation ...4 3. 2. 1. Tipping bucket calibration ...4 3. 2. 2. Dynamic calibration result ...5 3. 3. Measurement principles ...6 3. 3. 1. Gross rainfall ...7 3. 3. 2. Net rainfall...7 3. 3. 2. 1. Throughfall...8 3. 3. 2. 2. Stemflow ...8 3. 3. Interception and canopy parameters estimations...8
IV. RESULTS AND DISCUSSION
4. 1. Typical distribution of gross and net rainfall ...9 4. 2. Throughfall ...9 4. 4. Stemflow ...13
4. 5. Interception loss ...14
V. CONCLUSION AND SUGGESTS
5. 1. Conclusion ...16 5. 2. Suggests ...16
LIST OF FIGURES
1. TBT (the big ones) and TBS (the small ones)...4 2. PDA-based data logger (consist of a PDA, an electronic module, and
A dry-cell battery for power backup ...7 3. Data logger interface...7 4. Generated file by data logger ...8 5. Plastic tube to collect stemflow...8 6. Typical gross and net ranfall distribution of the heavy-rainfall ...10 7. The scatter of Pg and Tf. Following Leyton (1967) the line envelopes
the scatters and intercept y-axis indicating the value of canopy capacity, S
at 1st plot (a), 2nd plot (b), and 3rd plot (c)...11 8. Relationship between Pg and Tf showing the slopes that indicates canopy
porosity, p at 1st plot (a), 2nd plot (b), and 3rd plot (c)...12 9. Cumulative gross rainfall (402.0 mm) and net rainfall (286.6 mm) during
measurement period showing a 29% of rainfall interception ...14 10. The scatter of Pg and interception showing a smaller portion of
interception as total gross rainfall increases at 1st plot (a), 2nd plot (b),
and 3rd plot (c)...15
LIST OF TABLES
1. Comparative results from other interception studies ...3 2. Canopy capacity and canopy porosity from others interception study ...4 3. Dynamic calibration equation of the tipping buckets...5 4. Depth per tip of TBT resulted from the dynamic calibration equation for
a given T range values...6 5. Depth per tip of TBs resulted from the dynamic calibration equation for
a given T range values...6 6. Rainfall classification...7
LIST OF APPENDICES
I. INTRODUCTION
1.1. Background
Interception is a process where a part of rain water retained on a vegetated canopy surface and later evaporated back to the atmosphere. Interception plays an important role on rainfall redistribution both spatially and temporally. During rainfall event, the canopy acts like a sponge for the rain water, after rain water fills the storage capacity then additional rain water could drip to the ground surface. This storage capacity is the function of canopy and rainfall characteristics. For a similar depth of gross rainfall that hit a canopy, a low intensity of rainfall would be higher intercepted than a high intensity of rainfall. More rain water would also be intercepted in an intermittent rainfall than in a continuous rainfall. This is because the rain water reaches to the canopy in a longer period, providing more time for the evaporation process.
Interception is calculated for a vegetated area and expressed as the proportion of gross rainfall. Other studies show a variable result of interception; Jackson (2000) found 10% of rainfall interception at Agroforestry system in Kenya while Schellekens et al. (1999) found 50% of rainfall interception in a lowland tropical rainforest at northeastern Puerto Rico.
In a watershed, existence of vegetated area is of importance to extent water availability for the ecosystem and to prevent flood. Knowledge of interception would leads to a better understanding of hydrology cycle in this area where interception is one of the processes that reduce the water input. Neglecting interception loss would result in an overestimation of water input in a catchments area. By taking into account the interception loss would result in more precise information when assessing a catchment water balance and later could lead to a better watershed management.
Previous study to assess the biophysical indicators of Cicatih watershed has been initiated by Pawitan et al. (2006), while this study focuses on assessing the hydrological function of the watershed which is about forest canopy ability to intercept rainfall.
1.2. Objectives
The objective of this study is to identify the potency of natural montane forest in rainfall interception.
II. LITERATURE REVIEW
2.1. Spatial variability of gross rainfall
Gross rainfall distribution varies spatially, but it could be assumed similar for a relatively small area. To anticipate the variability, researchers installed several rain gauges in their study site (such as Jackson 2000 and Chappell et al. 2001) while Schellekens (1999) used only one rain gauge. Many rain gauges allow researchers to get a representative data of gross rainfall but required extra effort for the maintenance. Some researchers put the rain gauge above the forest canopy (such as Asdak et al. 1998a and Schellekens 1999) to avoid forest edge effect.
Asdak et al. (1998a) put rain gauge 15 m above ground surface when they investigated the intercepton on tropical rainforest in Central Kalimantan so that the angle between the rain gauges and the top of nearest trees was greater than 45o to ensure no surrounding environment affect the measurement. Jackson (2000) used several rain gauges to measure gross rainfall during his interception study on agroforestry system in Kenya. The rain gauges were placed above the forest canopy and in an open space near the sampling area, and mean value from the rain gauges then used as the area’s gross rainfall. Schellekens (1999) used a single rain gauge placed above the canopy at 26 m on a scaffolding tower to obtain the gross rainfall, while Chappell et al. (2001) were using a network of 34 rain gauges located within 10 km2 to investigate the spatial structure of above-canopy rainfall.
Ford and Dean (1978) found that in a calm weather there was no difference between gross rainfall measured above tree within 20 m of the sampling area and those 300 m away (at 3 m lower and 5 m higher than surface level of the sampling area). But during windy weather, rain gauge place in the sampling area (above tree) measured less rainfall than those at 300 m away.
2.2. The role of canopy characteristics in controlling the net rainfall
canopy drip, often throughfall was higher than rainfall in the open space. In contras, Ford and Deans (1978) found largest amount of throughfall in small area close to the tree stem (case study of young Sitka Spruce Plantation). These show that throughfall variability was large caused by different canopy characteristics. This canopy variability should be taken into consideration when determining the troughs and/or gauges placement in the sampling plot so that the value could represent as much variability as existed in the forest stand.
From other interception studies (Table 1), throughfall could vary from 50 – 90 % of gross rainfall, which was obviously caused by the canopy variability. A conical canopy would have less throughfall than the broadleaved one because the thickness of a conical canopy would make rainfall that hit the top leaves to be dripped to the lower leaves. More water then required to saturate the whole canopy before the drops could reach ground surface. In contras, a broadleaved canopy was thin that would require less water to saturate its canopy and also makes water hit the top canopy surface could reach the ground surface in a shorter time as drip.
The quantity of water required to saturate a dry canopy referred as canopy capacity. During storm event, some raindrops hit the canopy, retained temporarily on its surface, then evaporated back to the atmosphere or flow down as canopy drip. The canopy would retain variably quantity of water on its surface depends on its structure (such as leaf size, surface character, and the nature of branching). Water would falls from the canopy as drip after the canopy get saturated, but some wind or turbulence might interference the retained water causing the canopy to retain less water and reduce the canopy capacity. Hall (2003) mentioned that for coniferous trees which have large leaf area index (LAI) but small canopy size, the wetting of the canopy determined by drip from upper leaves while for broadleaved trees with small LAI but large canopy size, raindrop size significantly influence the canopy capacity.
Canopy capacity did not have a certain interval of values because it was depend on the canopy characteristics. As shown in Table 2, canopy capacity from forest stands could vary between 1 – 3.5 mm but there was a possibility that in other canopy this
value could be less or more. Some forests which were dominated by broadleaved trees might have lower canopy capacity than the conical one and a single layer canopy would also have lower canopy capacity than the multi-storey one. It because in a broadleaved and single layer canopy, more canopy cover was exposed to the rainfall area so that less rainfall was required to saturate the whole canopy while in a conical and a multi-storey canopy, the same quantity of rainfall might only saturate the top leaves of the canopy but not the lower ones.
Jarvis (2000) found that epiphytes existence did add the total interception on a forest stand, but he could not mention the proportion of interception contributed by those epiphytes.
Despite raindrops that hit the canopy surface, other raindrops could reach the ground surface directly without ever touching the canopy, identified as free throughfall. The proportion of canopy gaps that allow rain water to reach ground surface without hitting the canopy first identified as canopy porosity. Its value varies between 0 -1. High canopy porosity would indicate large gaps existence in the forest canopy that allows large quantity of rain water falls as free throughfall. Hall (2003) mentioned that free throughfall contributes to the net rainfall that occurred in a short time lag with the gross rainfall. This means that when a forest has larger canopy porosity then the time lag between gross and net rainfall at the beginning of a rainfall event would be shorter because of the free throughfall contribution.
RAINFALL INTERCEPTION BY NATURAL MONTANE FOREST
IN SUKABUMI, WEST JAVA
RACHMAT BINTORO
DEPARTMENT OF GEOPHYSICS AND METEOROLOGY
FACULTY OF MATHEMATICS AND NATURAL SCIENCES
RAINFALL INTERCEPTION BY NATURAL MONTANE FOREST
IN SUKABUMI, WEST JAVA
RACHMAT BINTORO
Final Assignment
To fulfill the requirements for a degree of Bachelor of Science
at the Department of Geophysics and Meteorology
Faculty of Mathematics and Natural Sciences
DEPARTMENT OF GEOPHYSICS AND METEOROLOGY
FACULTY OF MATHEMATICS AND NATURAL SCIENCES
FINAL ASSIGNMENT
Title
: Rainfall Interception by Natural Montane Forest in
Sukabumi, West Java
Name
:
Rachmat Bintoro
Student ID
:
G24102030
Approved by
1
stSupervisor
2
ndSupervisor
Prof. Dr. Ir. Daniel Murdiyarso
Ir. Bregas Budianto, Ass Dpl
NIP 130 804 892
NIP 132 089 516
Dean of
The Faculty of Mathematics and Natural Sciences
Bogor Agricultural University
Dr. drh. Hasim, DEA
NIP 131 578 806
I. INTRODUCTION
1.1. Background
Interception is a process where a part of rain water retained on a vegetated canopy surface and later evaporated back to the atmosphere. Interception plays an important role on rainfall redistribution both spatially and temporally. During rainfall event, the canopy acts like a sponge for the rain water, after rain water fills the storage capacity then additional rain water could drip to the ground surface. This storage capacity is the function of canopy and rainfall characteristics. For a similar depth of gross rainfall that hit a canopy, a low intensity of rainfall would be higher intercepted than a high intensity of rainfall. More rain water would also be intercepted in an intermittent rainfall than in a continuous rainfall. This is because the rain water reaches to the canopy in a longer period, providing more time for the evaporation process.
Interception is calculated for a vegetated area and expressed as the proportion of gross rainfall. Other studies show a variable result of interception; Jackson (2000) found 10% of rainfall interception at Agroforestry system in Kenya while Schellekens et al. (1999) found 50% of rainfall interception in a lowland tropical rainforest at northeastern Puerto Rico.
In a watershed, existence of vegetated area is of importance to extent water availability for the ecosystem and to prevent flood. Knowledge of interception would leads to a better understanding of hydrology cycle in this area where interception is one of the processes that reduce the water input. Neglecting interception loss would result in an overestimation of water input in a catchments area. By taking into account the interception loss would result in more precise information when assessing a catchment water balance and later could lead to a better watershed management.
Previous study to assess the biophysical indicators of Cicatih watershed has been initiated by Pawitan et al. (2006), while this study focuses on assessing the hydrological function of the watershed which is about forest canopy ability to intercept rainfall.
1.2. Objectives
The objective of this study is to identify the potency of natural montane forest in rainfall interception.
II. LITERATURE REVIEW
2.1. Spatial variability of gross rainfall
Gross rainfall distribution varies spatially, but it could be assumed similar for a relatively small area. To anticipate the variability, researchers installed several rain gauges in their study site (such as Jackson 2000 and Chappell et al. 2001) while Schellekens (1999) used only one rain gauge. Many rain gauges allow researchers to get a representative data of gross rainfall but required extra effort for the maintenance. Some researchers put the rain gauge above the forest canopy (such as Asdak et al. 1998a and Schellekens 1999) to avoid forest edge effect.
Asdak et al. (1998a) put rain gauge 15 m above ground surface when they investigated the intercepton on tropical rainforest in Central Kalimantan so that the angle between the rain gauges and the top of nearest trees was greater than 45o to ensure no surrounding environment affect the measurement. Jackson (2000) used several rain gauges to measure gross rainfall during his interception study on agroforestry system in Kenya. The rain gauges were placed above the forest canopy and in an open space near the sampling area, and mean value from the rain gauges then used as the area’s gross rainfall. Schellekens (1999) used a single rain gauge placed above the canopy at 26 m on a scaffolding tower to obtain the gross rainfall, while Chappell et al. (2001) were using a network of 34 rain gauges located within 10 km2 to investigate the spatial structure of above-canopy rainfall.
Ford and Dean (1978) found that in a calm weather there was no difference between gross rainfall measured above tree within 20 m of the sampling area and those 300 m away (at 3 m lower and 5 m higher than surface level of the sampling area). But during windy weather, rain gauge place in the sampling area (above tree) measured less rainfall than those at 300 m away.
2.2. The role of canopy characteristics in controlling the net rainfall
canopy drip, often throughfall was higher than rainfall in the open space. In contras, Ford and Deans (1978) found largest amount of throughfall in small area close to the tree stem (case study of young Sitka Spruce Plantation). These show that throughfall variability was large caused by different canopy characteristics. This canopy variability should be taken into consideration when determining the troughs and/or gauges placement in the sampling plot so that the value could represent as much variability as existed in the forest stand.
From other interception studies (Table 1), throughfall could vary from 50 – 90 % of gross rainfall, which was obviously caused by the canopy variability. A conical canopy would have less throughfall than the broadleaved one because the thickness of a conical canopy would make rainfall that hit the top leaves to be dripped to the lower leaves. More water then required to saturate the whole canopy before the drops could reach ground surface. In contras, a broadleaved canopy was thin that would require less water to saturate its canopy and also makes water hit the top canopy surface could reach the ground surface in a shorter time as drip.
The quantity of water required to saturate a dry canopy referred as canopy capacity. During storm event, some raindrops hit the canopy, retained temporarily on its surface, then evaporated back to the atmosphere or flow down as canopy drip. The canopy would retain variably quantity of water on its surface depends on its structure (such as leaf size, surface character, and the nature of branching). Water would falls from the canopy as drip after the canopy get saturated, but some wind or turbulence might interference the retained water causing the canopy to retain less water and reduce the canopy capacity. Hall (2003) mentioned that for coniferous trees which have large leaf area index (LAI) but small canopy size, the wetting of the canopy determined by drip from upper leaves while for broadleaved trees with small LAI but large canopy size, raindrop size significantly influence the canopy capacity.
Canopy capacity did not have a certain interval of values because it was depend on the canopy characteristics. As shown in Table 2, canopy capacity from forest stands could vary between 1 – 3.5 mm but there was a possibility that in other canopy this
value could be less or more. Some forests which were dominated by broadleaved trees might have lower canopy capacity than the conical one and a single layer canopy would also have lower canopy capacity than the multi-storey one. It because in a broadleaved and single layer canopy, more canopy cover was exposed to the rainfall area so that less rainfall was required to saturate the whole canopy while in a conical and a multi-storey canopy, the same quantity of rainfall might only saturate the top leaves of the canopy but not the lower ones.
Jarvis (2000) found that epiphytes existence did add the total interception on a forest stand, but he could not mention the proportion of interception contributed by those epiphytes.
Despite raindrops that hit the canopy surface, other raindrops could reach the ground surface directly without ever touching the canopy, identified as free throughfall. The proportion of canopy gaps that allow rain water to reach ground surface without hitting the canopy first identified as canopy porosity. Its value varies between 0 -1. High canopy porosity would indicate large gaps existence in the forest canopy that allows large quantity of rain water falls as free throughfall. Hall (2003) mentioned that free throughfall contributes to the net rainfall that occurred in a short time lag with the gross rainfall. This means that when a forest has larger canopy porosity then the time lag between gross and net rainfall at the beginning of a rainfall event would be shorter because of the free throughfall contribution.
crown area, not dominated by their neighbors, and with the smoothest bark, collect the largest volume of stemflow (case study of laurel forest).
However, stemflow contributes a relatively small portion to the net rainfall (Table 2). Asdak et al (1998a) found stemflow 0.3 % of gross rainfall in the logged forest of Central Kalimantan. In this case, throughfall was controlling the net rainfall.
[image:36.595.106.523.233.456.2]The sum of throughfall and stemflow measured identified as the net rainfall, the actual rainfall that reach the ground surface, and mentioned as the proportion to the gross rainfall. Obviously, canopy characteristics (leaf shape, size, surface character, and the nature of branching) did have great influence on the net rainfall, besides the rainfall distribution itself.
Table 1. Comparative result from other interception studies % of gross rainfall Study Site Location
Tf Sf I
Source
Unlogged forest Indonesia 87.2 1.4 11.4 Asdak et al. (1998a) Logged forest Indonesia 93.5 0.3 6.2 Asdak et al. (1998a) Agroforestry system
(with no intercropped) Kenya 88.4 0.7 10.9 Jackson (2000) Hardwood stand Canada 76.4 4.3 19.3 Carlyle-Moses et al. (1999) Natural forest Indonesia 72.3 1.7 26.1 Anwar (2003)
Lowland tropical
rainforest Puerto Rico - - 50 Schellekens et al. (1999) Tropical upland mixed
cropping system Indonesia 2/4 18/8
Van Dijk and Bruijnzel (2001)
Laurel forest Canary
Islands - 6.85 - Aboal et al. (1999) Tropical montane
cloud forest Columbia - - 42 Jarvis (2000)
2.3. Influence of canopy characteristics on Interception
Interception calculated as the difference between gross and net rainfall, it was influenced by both climatic and canopy factors. Rainfall depth, intensity and distribution (both temporally and spatially) were dominant climatic factors in interception. High portion of interception would be resulted from low small rainfall. This can be understood as in small rainfall, most of the water was used for saturating the canopy, causing only small portion or even none of the rainfall could reach the ground surface as net rainfall.
Hall (2003) mentioned that interception loss was relatively insensitive to the raindrops size which means that for different storm intensity, interception loss would not much differ from one to another. This might fit for the multi layer forest stands where large portion of throughfall contributed by canopy drip from upper layer canopy. This can be understood because kinetic energy
from high storm intensity would force water on the top canopy surface to splash out and dripped to the lower canopy layer. The same thing happens when low storm intensity occurred for a long rain period or as an intermittent event because it would allows for longer evaporation process from the canopy surface.
Gross rainfall in an interception study usually was a single value (whether obtained from a single rain gauge measurement or as average from several distributed rain gauges) for the whole study area to make canopy variability as the only cause for different net rainfall measured.
Table 2. Canopy capacity and canopy porosity from others interception study
Study Site Location Canopy Capacity, S (mm)
Canopy
Porosity, p Source Unlogged forest Indonesia 1.3 0.1 Asdak et al. (1998b)
Logged forest Indonesia 1 0.3 Asdak et al. (1998b)
Hardwood stand Canada 1 – 1.1 0.61 – 0.85 Carlyle-Moses et al. (1999) Natural forest Indonesia 1.3 0.7 Anwar (2003) Lowland coastal
rainforest Australia 3.5 0.035 Wallace et al. (2006) Lowland tropical
rainforest Puerto Rico 1.15 -
Schell