HIKARI Ltd, www.m-hikari.com http://dx.doi.org/10.12988/ams.2014.311619
Multitemporal Cloud Detection and Masking
Using MODIS Data
Asmala Ahmad
Department of Industrial Computing
Faculty of Information and Communication Technology Universiti Teknikal Malaysia Melaka
Hang Tuah Jaya, 76100 Durian Tunggal, Melaka, Malaysia
Shaun Quegan
Department of Applied Mathematics School of Mathematics and Statistics
University of Sheffield Sheffield, United Kingdom
Copyright © 2014 Asmala Ahmad and Shaun Quegan. This is an open access article distributed under the Creative Commons Attribution License, which permits unrestricted use, distribution, and reproduction in any medium, provided the original work is properly cited.
Abstract
The aims of this study are to investigate the spectral properties of cloud and to carry out cloud detection and masking using MODIS (Moderate-resolution Imaging Spectroradiometer) data. To do this we make use of the spectrally rich satellite data provided by MODIS sensor, which is equipped with 36 bands ranging from visible to thermal wavelengths. Cloud detection and masking were first carried out individually using single date of MODIS data. Multitemporal cloud analysis was later carried out using MODIS data from 24 different dates from 2004 to 2005. The eastern parts of Malaysia were found to have more cloudy days than the western parts, in which consistence with the meteorological observations made by the Malaysian Meteorological Services.
1 Introduction
Retrieval of surface information using remote sensing satellite is commonly affected by cloud, which, if thick, can completely obscure the surface within the satellite field of view or, if thin, attenuate solar radiation both on the incident path and after reflection and scattering at the surface [2], [4]. This is particularly important over tropical regions where cloud is persistent. If not dealt properly, this could affect the accuracy of further common processing task such as land cover classification [1], [3], [5]. Generally, cloud detection tests can be categorised into four categories, i.e. brightness temperature test and brightness temperature difference test.
Brightness Temperature Test
The tests commonly performed using brightness temperature measurements are from 11 μm and 14 μm wavelengths. 11 μm measurement was initially used for partial coherence test [7]. The idea is that the absolute value of BT should be lower than surface area and the variability of brightness temperature for cloudy pixels should be higher than clear-sky pixels. This can be carried out by making use the standard deviation value of an array of pixels. Cloud pixels are indicated with standard deviation less than 0.4 K for equatorial regions. CO2 absorption bands (near 14 m) can be used to distinguish transparent clouds from opaque clouds and clear-sky. This test is effective for detecting thin cirrus clouds that are often missed by infrared and visible tests [12].
Brightness Temperature Difference Test
The frequently used brightness temperature difference tests are BT(11) – BT(12) and BT(11) – BT(3.9). BT(11) – BT(12) test can be used to detect thin cloud (i.e. cirrus) because they are larger than that of clear-sky and thick cloud conditions [10]. BT(11) – BT(3.9) test can be used to differentiate between cloud over land and water; its value over land is different from over water. For cloudy pixels over land, the long-wave minus shortwave brightness temperature (i.e. BT(11) – BT(3.9) ) has a large negative value during the day for thick clouds. This is because much of the energy sensed by the satellite comes from the Earth’s surface and atmosphere below the cloud, and the 3.9- m channel’s response to warm pixel temperatures is greater than it is at 11 m, resulting in negative difference values during the day.
Reflectance Test
2 Materials and Methods
The MODIS instrument is the primary payload attached to two satellites, Terra and Aqua. Terra was launched on December 18, 1999, and Aqua on May 4, 2002. The main advantage of MODIS data is that it offers a wide range of spectral bands. There are 36 spectral bands covering the visible, near infrared and thermal infrared ranges of the electromagnetic spectrum. The primary use and the corresponding spectral information for all bands are summarised in Table 1.
Table 1: Primary use and spectral information for MODIS bands [9].
Primary Use Band Band Range1 Bandwidth2 Spectral
Radiance3
Bandwidth values are in nm
3
Spectral radiance values are in Wm-2 µm-1 sr-1
4
In this study, the MODIS Terra data in MOD021KM format is used. These datasets were downloaded from the Level 1 and Atmosphere Archive and Distribution System (LAADS) website [9]. MOD021KM contains data in three forms: (1) Radiance (W m-2μm-1sr-1) for the reflective bands (2) Radiance (W m-2
μm-1sr-1) for the emissive bands; and (3) Reflectance (dimensionless) for the reflective bands. The relationship between the TOA reflectance, ρ and TOA radiance (Wm-2μm-1sr-1), L at the isotropic surface can be expressed as [4]: angle. The MODIS Level 1B also contains thermal data, which are recorded as TOA radiance, and can be converted to brightness temperature using the Planck function. Brightness temperature is defined as the temperature for an ideal black body with the observed radiance; it is the temperature a blackbody needs to have to emit radiation of the observed intensity at a given wavelength. From Planck’s Law, the observed radiance is expressed as
2 5 (μm) and T is the brightness temperature (K). By inverting this formula, we can solve for brightness temperature, T:
The study area is Peninsular Malaysia, located within latitude 6o47’ N, longitude 88o25’ E (upper left), and latitude 1o21’ N, longitude 106o20’ E (lower right) that covers an area of about 140000 km2.
3 Results and Discussion
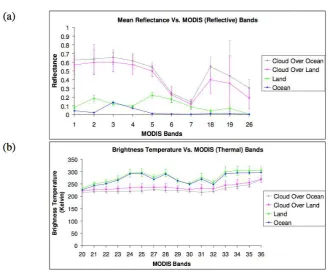
Fig. 1. (a) Reflectance of cloud over the ocean and cloud over the land relative to non-cloud features. Vertical bars indicate standard deviations; (b) Same as (a) but
for brightness temperature.
Table 2: Cloud test, its function and the threshold used in the MODIS cloud mask for day-time detection over land.
Cloud criteria
Test (Subscript refers to MODIS
band number)
Description Threshold
Thick high
clouds BT35
CO2 slicing. Values smaller than threshold indicate ice cloud at middle and upper atmosphere
226 K Thin high
clouds BT31 – BT32
Values smaller than threshold indicate high
cloud or cirrus cloud 2 K
Thick low
clouds BT31 – BT22
Values smaller than threshold indicate low level
water clouds -11.0 K
Low clouds R1
Reflectance gross cloud test with vegetated land background. Values larger than threshold indicate cloud.
0.14 Thin high
clouds R26
Values larger than threshold indicate thin cirrus
Cloud trend within this period can be observed by plotting graph of area against the date of the datasets. Figure 3 shows cloud area against the date of the data from January 2004 to December 2005. It is noticeable that the 2005 datasets have more cloud than 2004 due to the effects of La Nina and El Nino respectively [8].
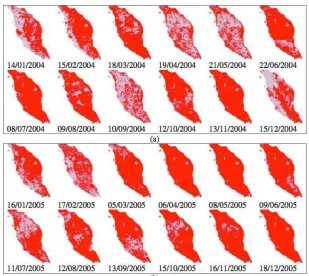
Fig. 2. Cloud masking for selected dates in (a) 2004, and (b) 2005; cloud pixels are masked red, while cloud-free and water body pixels are masked grey and
white respectively.
Fig. 3. Cloudy area versus different MODIS acquisition date from January 2004 to December 2005.
the cloud masks in Figure 2 and then assigning colours to cloud pixels, based on the frequency of occurrence, for the year 2004 and 2005. Figure 4 shows the cloud area classified based on overlapping cloud pixels from the selected dates within 2004 and 2005; The colours are associated with the number of overlapping dates; non-cloud and water are masked grey and white respectively. The eastern parts of Malaysia seems to have more cloudy days than the western parts, in which consistence with the fact that the former is having more amount of annual rain than the later. It is also clear that the year 2005 is cloudier than 2004, in which is consistent with Figure 3, due to La Nina and En Nino respectively [8].
Fig. 4. Cloud area classified based on frequency of cloud occurrence from selected dates for (a) 2004 and (b) 2005. The colours are associated with the number of overlapping dates; non-cloud and water are masked grey and white
respectively.
4 Conclusion
In this study, we investigated the spectral properties of cloud and carried out cloud detection and masking using spectral methods. Cloud was analysed based on measurements made from 36 MODIS bands ranging from visible to thermal wavelengths. Cloud detection and masking were first carried out individually using single date and then multi-dates of MODIS data. Multitemporal cloud analysis indicated that more cloudy days occured in the eastern parts of Malaysia, in which was consistence with the fact that more rain occured in the eastern than western parts of Malaysia.
References
[2] A. Ahmad and M. Hashim, Determination of Haze Using NOAA-14 Satellite Data. Proceedings on The 23rd Asian Conference on Remote Sensing 2002 (ACRS 2002), (2012), in cd.
[3] A. Ahmad and S. Quegan, Analysis of maximum likelihood classification on multispectral data. Applied Mathematical Sciences, 6 (2012), 6425 – 6436.
[4] A. Ahmad and S. Quegan, Cloud masking for remotely sensed data using spectral and principal components analysis, Engineering, Technology & Applied Science Research (ETASR), 2 (2012), 221 – 225.
[5] A. Ahmad and S. Quegan, Comparative analysis of supervised and unsupervised classification on multispectral data. Applied Mathematical Sciences, 7(74) (2013), 3681 – 3694.
[6] B.-C. Gao, K.B. Heidebrecht and A. F. H. Goetz, Derivation of scaled surface reflectances from AVIRIS data. Remote Sensing of Environment, 44 (1993), 165 – 178.
[7] G.B. Franca and A.P. Cracknell, A simple cloud masking approach using NOAA AVHRR daytime data for tropical areas. International Journal of Remote Sensing, 9 (1995), 1697 – 1705.
[8] L. Wong, R. Venneker, S. Uhlenbrook, A. B. M. Jamil and Y. Zhou, Variability of rainfall in Peninsular Malaysia. Hydrology and Earth System Sciences Discussions, 6 (2009), 5471–5503.
[9] MODIS, 2007. Components of MODIS. Available at:
http://modis.gsfc.nasa.gov/about/specifications.php [Accessed: 31 August 2013].
[10] R.W. Saunders and K.T. Kriebel, An improved method for detecting clear sky and cloudy radiances from AVHRR data. International Journal of Remote Sensing, 9 (1988), 123 –150.
[11] S. Ackerman, R. Frey, K. Strabala, Y. Liu, L. Gumley, B. Baum and P. Menzel, Discriminating clear-sky from cloud with MODIS - Algorithm theoretical basis document. Products: MOD35. ATBD Version 6.1, Madison: MODIS Cloud Mask Team, 2010.
[12] Wylie, W. P. Menzel and K.I. Strabala, Four years of global cirrus cloud statistics using HIRS. Journal of Climate, 7 (1994), 1972 – 1986.
![Table 1: Primary use and spectral information for MODIS bands [9]. Spectral](https://thumb-ap.123doks.com/thumbv2/123dok/511820.58153/3.595.91.539.273.711/table-primary-use-spectral-information-modis-bands-spectral.webp)