PARTICLE SIZE EFFECT IN MODEL RETAINING WALL ON
PASSIVE MODE WITH GRANULAR MATERIAL
ABSTRACT
This paper presented a particle size
on
retaining
comparing the experimental and finite
analysis.
experiments were conducted with air-drietl'
sand and
sand in plane strain condition, both
are
sand in Japan.
The wall was moved horizontally into
The heights of sand mass
in these experiments were
5 cm,
10and 15
The finite element
analysis employed a constitutive
in
strain
the
ofshear bund
from
the results
both experimental
and
results, there was evident of particle size
due to
shear banding.
Keywords: retaining wall, progressive failure, particle size effect, model test, finite elenzent analysis, passive earth pressure, shear band, plane strain
INTRODUCTION
Earth pressure problems are of great interest in
engineering and closed-form solutions are widely used for the evaluation of earth pressure coefficients in the design of retaining
various theoretical approaches were based on a rigid plastic theory
etc.) to be
accepted ones. But theories cannot explain a failure in sand mass. Nakai (1985).
and Wroth (1972) evaluated retaining wall by using finite
analysis. and Mori (1997) evaluated the progressive failure of retaining wall in passive mode by comparing the experimental result with the finite element. Davis
980) on retaining
I
Vol. 14, No. 2, 2000
mechanism of deformation and
failure in sand: that of the relative importance of shearing and dilatancy for different wall sizes. The scale effect is an important problem in soil
mechanics because it causes trouble in transformation of the model test results to prototype. The scale effect on footing and anchor problems has
been under taken by some
investigators (Ovesen (1979) and
et al. Tatsuoka et
and Sakai and
( 1998)).
Stone and Wood (1992)
reported that the scale effect was caused by the progressive failure due to shear banding. Sakai et al. (1998)
evaluated the difference in scale
effect anchor problem with dense
sand having different particle size.
and that it is necessary to
consider the particle size effect when evaluating the scale effect due to progressive failure. Until now, the
conducted in
retaining wall problems have not
been to the scale
effect and particle size effect. this paper, we attempt to explain the difference of the particle
size effect and scale effect due to
progressive failure on retaining wall (horizontal translation) on passive
mode by the experimental
results the finite element
analysis. sand used for the tests
were Toyoura sand and Soma sand, and only for finite element analysis, data for Leighton-Buzzard sand
was also evaluated. All tests were
conducted in normal gravity
condition.
TESTING APPARATUS AND ANALYTICAL METHOD
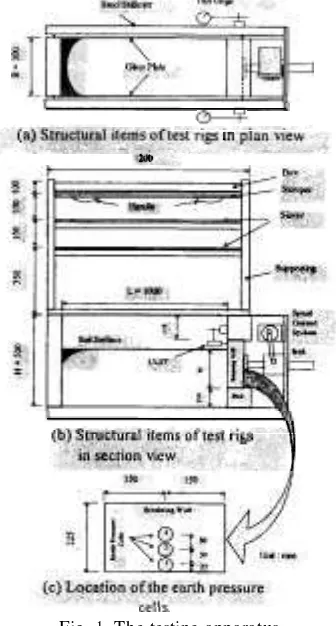
A testing apparatus consisted of
soil bin, movable retaining wall and
driving system. soil bin was
fabricated of steel (in Figure 1). Both sidewalls of soil bin were made of 10 mm thick glass plates. The movable retaining wall was made of aluminum. Three earth pressure cells were attached on the model retaining wall to measure the distribution of earth pressure on the wall (in Figure In all tests, the wall was
relative densities were
approximately 95 for both sands.
The heights of sand mass ( h )
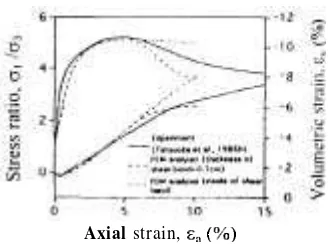
softening elasto-plastic material was introduced, and shear band thickness could be introduced as characteristic length into a constitutive equation. The finite element mesh used for the analysis is shown in Figure 2. The input data for the analysis was based on the data obtained from the test by using air-pluviated dense Toyoura
sand et 1986). The
dry density residual friction
angle poisson's ratio and
finite element method using
element (2 4 were carried
out employing the material
properties with and without shear band. The calculated stress-strain- volume change relationship under
= 98 is shown in Figure 3.
above were 5 cm, 10 and Axial strain,
15 cm. In order to observe the
shear band development in sand Figure 3. Simulated stress-strain
volume of triaxial test mass, thin vertical colored sand
layers were placed adjacent to the glass wall.
The finite element analysis has been carried out by
(1997). The constitutive model for
Vol. 14, No. 2, Agustus 2000
EXPERIMENTAL AND ANALYTICAL RESULTS
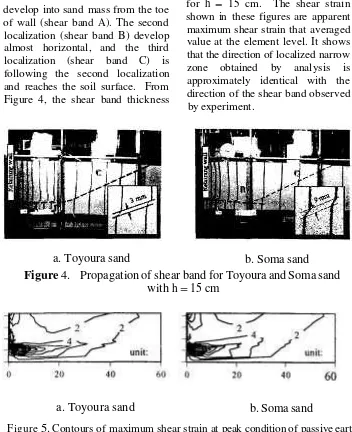
Figure 4 gives a photographic representation of the shear band propagation with Toyoura sand and
Soma sand for h = 15 cm at
displacement of 20 mm. The
developments of localization are almost similar. Initial localization develop into sand mass from the toe of wall (shear band A). The second
localization (shear band B) develop
almost horizontal, and the third localization (shear band C) is following the second localization and reaches the soil surface. From Figure 4, the shear band thickness
(w) is 3 for Toyoura sand and 9
mm for Soma sand. This result
indicates that the thickness of shear band is known to be 20 times the mean particle diameter.
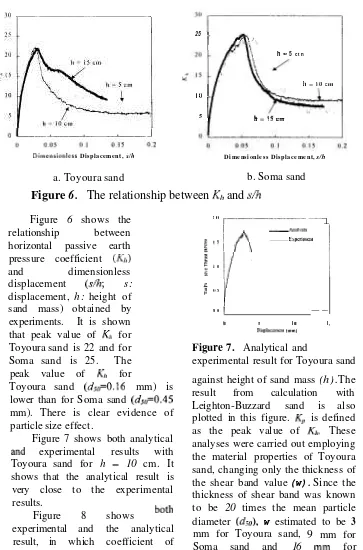
Figure 5 shows the contour of
the maximum shear strain at peak condition for Toyoura sand and
Soma sand obtained analysis
for h = 15 cm. The shear strain
shown in these figures are apparent maximum shear strain that averaged value at the element level. It shows that the direction of localized narrow
zone obtained by analysis is
approximately identical with the direction of the shear band observed by experiment.
a. Toyoura sand
b. Soma sand
Figure
4. Propagation of shear band for Toyoura and Soma sand
with h
=15 cm
a. Toyoura sand
b. Soma sand
Figure 5. Contours of maximum shear strain at peak condition of passive earth
2 5
h 5 c t n
=
5 h =
Displacement, Dimensionless Displacement,
a. Toyoura sand b. Soma sand
Figure
6 .
The relationship between
and
Figure 6 shows the 1
relationship between
horizontal passive earth pressure coefficient
experimental results with
Toyoura sand for h = 10 cm. It
shows that the analytical result is very close to the experimental
against height of sand mass (h). The
result from calculation with
Leighton-Buzzard sand is also
plotted in this figure. is defined
as the peak value of These
analyses were carried out employing the material properties of Toyoura sand, changing only the thickness of
the shear band value (w). Since the
14, No. 2, Agustus 2000
, ...
. .
Leighton-Buzzard sand. It is
showed that the particle size effect could be evaluated by finite element analysis.
Furthermore, the scale effect is
not clearly seen up to h = 15 cm
obtained by experiment and analysis.
But it is clearly evident in the h
range from until
obtained by analysis.
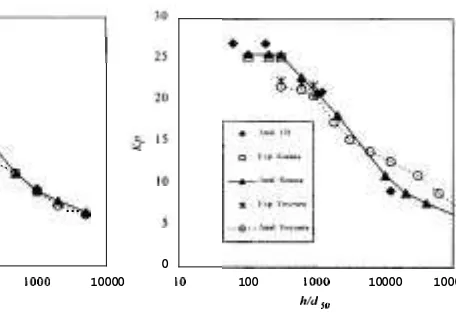
evaluation of evidence of particle size effect due to shear banding by using the parameter
(h= height of sand mass; mean
particle diameter) is important. Figure 9 shows the experimental and
analytical results, which is
plotted against For the
retaining wall (horizontal
translation) on passive mode by the experimental results with the finite element analysis. The conclusions from the results can be summarized as:
1 . The finite element analysis
showed gocd agreement with the results.
2. From both experimental and
analytical results, there was clear evidence of particle size effect,
where the value of for
Toyoura sand 16 mm) was
lower than for Soma sand
3. Although the scale effect was not
clearly seen for range of h up to
1000. there was clear evidence of
REFERENCES
Davis, A.G. "The use of
physical models in design",
Design parameters
.
London, Vol 4, pp.358-359. Kimura, T., Kusakabe, 0. and
K. (1 "Geotechnical model
tests of bearing capacity
problems in a centrifuge".
Geotechnique Vol. 35, pp. 33-45.
Nakai, T. "Finite element
computations for active and passive earth pressure problems
of Soils anchor problem with granular
materials", Proc. 4'"
on Meth. in Eng., Udine, pp. 19 1-200.
Sakai, T. and Tanaka, T. (1998).
"Scale effect of shallow circular
anchor in dense sand", Soils
sand", The Proceeding
European on Soil
Mechanics and
Engineering Madrid, pp.
85-93.
Stone, K.J.L. and Wood, D.M.
( "Effect of Dilatancy and
particle size observed in
on sand", Soils
pp. 43-57. T. and Mori, H. "Three-dimensional
plastic finite element analysis of short pile and retaining wall",
deformation characteristics of
sand in plane strain
compression at extremely low
pressures", Soils and
Vol. pp.
Tatsuoka, F., et
"Progressive failure particle
size effect in capacity
pressure testing machine",
Engineering
109, 13. pp. 365-769.
I., Graf, B.
Gudehus, G. ( I 98
problem with dry sand: a statical approach based upon
test kinematics",
Methods