COMMUNITY SUCCESSION OF METHANOTROPHIC
BACTERIA BASED ON
pmo
A GENE IN RICE FIELDS
HENDRI SUTANTO
GRADUATE SCHOOL
BOGOR AGRICULTURAL UNIVERSITY BOGOR
THE THESIS STATEMENT AND SOURCES OF
INFORMATION ALONG COPYRIGHT DEVOLUTION
I hereby declare that the thesis entitled “Community succession of methanotrophic bacteria based on pmoA gene in rice fields” is true of my research under the guidance of the supervisor committee and has not been submitted in any form to any college. Sources of information derived or citated from published and unpublished works from other writers have been mentioned in the text and listed in the references in the end of this thesis.
I hereby assign the copyright of my thesis to Bogor Agricultural University.
Bogor, August 2014
RINGKASAN
HENDRI SUTANTO. Suksesi Komunitas Bakteri Metanotrof Berdasarkan Gen pmoA di Lahan Sawah. Dibimbing oleh IMAN RUSMANA dan NISA RACHMANIA MUBARIK.
Bakteri metanotrof memainkan peranan penting dalam oksidasi gas metan di lahan sawah. Keragaman komunitas bakteri metanotrof di lahan sawah erat kaitannya dengan emisi metan yang akhirnya dilepas ke atmosfer setelah diproduksi oleh arkea metanogen. Isolat bakteri metanotrof BGM 1, BGM 5, BGM 9, dan SKM 14 diketahui mampu mengoksidasi gas metan di lahan sawah. Suksesi komunitas bakteri metanotrof di lahan sawah seiring bertambahnya waktu selama masa tanam padi di lahan sawah dan penggunaan piranti lunak DNDC 9.5 untuk mengestimasi emisi gas metan dari lahan sawah masih jarang dilakukan. Oleh karena itu penelitian ini bertujuan mempelajari suksesi komunitas bakteri metanotrof berdasarkan gen pmoA di lahan sawah serta melakukan perbandingan pengukuran aktivitas emisi gas metan secara aktual dan estimasi menggunakan piranti lunak DNDC 9.5.
Isolat bakteri metanotrof BGM 1, BGM 5, BGM 9, dan SKM 14 digunakan sebagai kultur pupuk hayati di sawah. Perlakuan yang digunakan ialah kontrol, celup, dan tidak celup. Pupuk NPK diberikan pada perlakuan kontrol. Pada perlakuan celup diberikan pupuk NPK dengan dosis yang lebih rendah serta kultur bakteri metanotrof yang digunakan untuk merendam rumpun padi sebelum ditanam di sawah. Pupuk NPK dengan dosis yang sama dengan perlakuan celup serta kultur bakteri metanotrof yang disebar langsung ke tanah sawah dilakukan pada perlakuan tidak celup.
DNA genom dari sampel tanah sawah pada setiap perlakuan yang diambil setiap 30 hari setelah tanam diisolasi menggunakan PowerSoilTM Soil DNA Isolation Kit, selanjutnya gen pmoA diamplifikasi menggunakan PCR. Analisis suksesi komunitas bakteri metanotrof dilakukan menggunakan teknik metagenom DGGE (Denaturant Gradient Gel Electrophoresis). Pita yang dipotong dari gel DGGE diamplifikasi kembali dengan PCR kemudian disekuen dan dianalisis menggunakan piranti lunak MEGA 5 untuk mengkonstruksi pohon filogenetik. Analisis perbandingan emisi gas metan pada setiap perlakuan dilakukan dengan melakukan pengukuran aktual di lahan sawah setiap 30 hari setelah tanam serta pengukuran estimasi menggunakan piranti lunak DNDC 9.5.
SUMMARY
HENDRI SUTANTO. Microbial Community Succession of Methanotrophic Bacteria Based on pmoA Gene in Rice Fields. Supervised by IMAN RUSMANA and NISA RACHMANIA MUBARIK.
Methanotrophic bacteria play a role in methane oxidation in rice fields. Methanotrophic bacterial diversity in rice fields was closely related to methane emission whom released into the atmosphere after being produced by methanogen archaea. Methanotrophic bacterial isolates of BGM 1, BGM 5, BGM 9, and SKM 14 were known as methane oxidizer in rice fields. Microbial community succession of methanotrophic bacteria due to the time change during planting season and the methane emission measurement comparison of actual and estimation data in rice fields are still rare. Therefore, this research were aimed to study the microbial community succession of methanotrophic bacteria based on pmoA gene and to compare actual and estimation measurement of methane emission in rice fields using DNDC 9.5 software.
Methanotrophic bacterial isolates of BGM 1, BGM 5, BGM 9, and 14 SKM were used as biofertilizer. The treatments used were control, soaking, and spread treatment. NPK fertilizer was given in the control treatment. The less dose of NPK fertilizer and methanotrophic bacterial isolates which used to soak the rice clumps before transferred to the patch were conducted at soaking treatment. NPK fertilizer with the same dose to soaking treatment and methanotrophic bacterial isolates which spread directly to the patch were conducted at spread treatment.
DNA genome of rice field soil samples which taken at each treatment every 30 days after planting were isolated using PowerSoilTM Soil DNA Isolation Kit, furthermore pmoA gene was amplified using PCR. Analysis of microbial community succession methanotrophic bacteria was performed using DGGE (Denaturant Gradient Gel Electrophoresis). The bands which extracted from DGGE gel were amplified by PCR then were sequenced and analyzed using MEGA 5 software to construct the phylogenetic tree. Methane emission in each treatment was analyzed by comparing the actual and estimation emission using DNDC 9.5 software.
Based on DGGE analysis of pmoA gene, there was succession of methane-oxidizing bacterial community on both vegetative and generative phase. Three bands were amplified successfully using PCR and showed similarity to uncultured bacterium clone pmoA gene 18f_9H (99% of maximum identity), uncultured bacterium clone pmoA gene 16-2000yo-B (98% of maximum identity), and uncultured bacterium clone pmoA gene 32-2000yo-B (96% of maximum identity). Based on phylogenetic tree construction, one band was clustered to Methylocystis sp. strain H9a while the other two bands were clustered to Methylococcus capsulatus strain BL4. The methane gas emission analysis showed the lowest emission was obtained at soaking treatment followed by spread and control treatment respectively. Comparison of actual and estimation measurement of methane emission showed the similar pattern which methane emission was obtained decreased from the vegetative phase to the generative phase.
©
Copyright of IPB, 2014
Copyright Reserved
Prohibited for quoting part or all of this thesis without including or citing the sources. Citation is only for educational purposes, research, scientific writing, report writing, criticism writing, or review of an issue; and citations are not detrimental on behalf to IPB.
COMMUNITY SUCCESSION OF METHANOTROPHIC
BACTERIA BASED ON
pmo
A GENE IN RICE FIELDS
HENDRI SUTANTO
Thesis
as one of the requirements to obtain the degree Master of Science
on
Microbiology Major
GRADUATE SCHOOL
BOGOR AGRICULTURAL UNIVERSITY BOGOR
Thesis Title : Community Succession of Methanotrophic Bacteria Based on pmoA Gene in Rice Fields
Name : Hendri Sutanto NIM : G351130356
Approved by Supervisor Commission
Dr Ir Iman Rusmana MSi Head
Dr Nisa Rachmania Mubarik MSi Member
Discovered by
Head of Microbiology Major
Prof Dr Anja Meryandini, MS
Dean of Graduate School
Dr Ir Dahrul Syah, MScAgr
FOREWORD
Praise and gratitude to God for all His gifts so this thesis has been completed successfully. The theme chosen in this research was microbial diversity succession. The title of this thesis research is
“Community Succession of Methanotrophic Bacteria Based on pmoA Gene in Rice Fields”. The author thanks to Dr.Ir.Iman Rusmana, M.Si and Dr Nisa Rachmania Mubarik M.Si as supervisor commission in this thesis research and great thanks to Dr Sulistijorini MSi as examiner beyond commission on thesis examination. The author also thanks the staff of the Laboratory of Microbiology and Intergrated Laboratory, Department of Biology IPB.
During the college and research, the author thanks to the author family, Alrhena, Kenny, Biology Batch 46, the first batch of fast-track student, and all of friends on Microbiology Major Batch 2012-Graduate School of IPB who have helped the author during this research. The author wished this research can be beneficial for the knowledge development based on environmental microbiology and also the environment quality improvement around the world.
Bogor, August 2014
LIST OF TABLE
1 Characteristic of type I, II, and X of methanotroph 5
2 DNA template concentration 10
3 Comparison of estimation and actual result of CH4 emission 14
LIST OF FIGURE
1 Pathways for the oxidation of methane and assimilation of formaldehyde 4
2 Research framework 7
3 PCR amplification of the pmoA gene 11
4 DGGE band profile 12
5 The phylogenetic tree constructed with pmoA gene sequences 12
6 Flux rate of CH4 13
LIST OF APPENDIX
1 Sequencing result of all bands excised from DGGE gel 23
2 Soil texture classification by USDA 32
3 BLAST result of all bands 32
INTRODUCTION
Environmental Protection Agency's for Greenhouse Gas Report in 2010, Indonesia is the seventh largest contributor of methane gas emission from rice fields in the world. Setyanto (2004) reported that flooding activity in rice fields and other wetlands are one of the sources of the emergence of CH4 emission.
Flooded soil conditions caused reductive condition in the soil then the growth of methanogens increased. Along with the increase in rice production, CH4 emission
will also be increased if the management is not accompanied by efforts to reduce the emission. The utilization of methanotrophic bacteria can be used to reduce the emission.
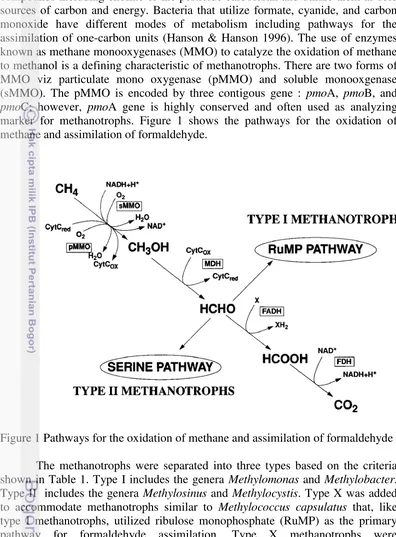
Methanotrophs are unique bacteria which can use methane as their sole source of carbon and energy. The ability of methanotrophs to oxidize methane is due to the activity of the enzyme methane monooxygenase. There are two distinct forms of this enzyme viz the cytoplasmic soluble methane monooxygenase (sMMO) and the membrane-bound particulate methane monooxygenase (pMMO) (Murrell et al. 2000). The pMMO is commonly found in all methanotrophs rather than sMMO. The pMMO is coded by three contiguous genes viz pmoA, pmoB, and pmoC. The pmoA gene is highly conserved and often used as a functional marker for analyzing methanotrophs in the environment (Hakemian and Rosenzwelg 2007). Based on their cell morphology, ultrastructure, phylogeny, and metabolic pathways, methanotrophs can be divided into three taxonomic groups: type I, type II, and type X. Type I methanotrophs include the genera Methylobacter, Methylomicrobium, Methylomonas, Methylocaldum, Methylosphaera, Methylothermus, Methylosarcina, Methylohalobius, Methylosoma, and Methylococcus, which belong to the gamma subdivision of the Proteobacteria. The type II methanotrophs include the genera Methylocystis, Methylosinus, Methylocella, and Methylocapsa are in the alpha subdivision of the Proteobacteria (Hanson and Hanson 1996). Methylococcus capsulatus is the species of type X methanotrophs.
The CH4 oxidation activity in rice fields is closely related to the their
2
sequence differences and allows large numbers of samples to be analyzed simultaneously. Eventhough this technique is ideally suited for monitoring the dynamics of microbial communities influenced by environmental changes escpecially in rice fields but the microbial community succesion of
1. Methanotrophic bacteria can be used as methane oxidizer agent in rice fields. 2. There is community succession of methanotrophic bacteria in rice fields due to
the time change during crop season.
3. There is change of methane emission from vegetative to generative phase. 4. DNDC 9.5 software can be used to estimate the methane emission in rice
fields.
Aim of Research
The aims of this research were to study community succession of methanotrophic bacteria based on pmoA gene using DGGE technique and also to measure the CH4 emission in rice fields.
Benefit of Research
3
LITERATURE REVIEW
Atmospheric Methane
Methane gas is the second most important anthropogenic greenhouse gas in the atmosphere and responsible for 20–30% of total greenhouse gas radiative forcing since the industrial revolution (IPCC 2007). Methane is currently about 200 times less concentrated in the atmosphere than carbon dioxide, but each molecule of methane is 25 times more potent in terms of heat-holding capacity (Lelieveld et al. 1998). Due to changes in human activity and land use in the world, both carbon dioxide and methane began to increase around 150 years ago, as the industrial phase began. Maxfield et al. 2006 and Degelmann et al. 2010 stated since that beginning, atmospheric methane concentrations have increased approximately 150% from a pre-industrial mixing ratio of about 0.7 ppm to 1.8 ppm. Methane sources are various but their number and magnitude appear to be on the rise, while methane sinks are more uncertain. The largest global methane sources are natural and constructed wetlands, which contribute around 33% of annual emissions (IPCC 2007). Anthropogenic sources including rice fields, domesticated animals, landfills, fossil fuel acquisition and burning, as well as biomass use for energy and agriculture, total at least 307 Tg methane yr−1, which could be over 60% of total emissions (Wang et al. 2004). There may be more sources than have been accounted for, as methane has also been found to be produced aerobically in the ocean (Karl et al. 2008).
Methanotrophic Bacteria
Exchange of methane within the soil and atmosphere is regulated by two groups of microorganisms which known as methanogen and methanotrophs. The disparate environmental requirements of these two groups, particularly oxygen concentration, temperature, water content, and nutrient availability, determine the net methane flux of a given ecosystem. Methanogenic archaea as methane producer active mainly in anaerobic conditions, produce methane as a metabolic byproduct and are the main biological source of methane in natural systems, landfills, and agriculture. Methanotrophic bacteria as methane oxidizer are active mainly in aerobic conditions and derive energy and carbon from the oxidation of methane (Hanson & Hanson 1996).
4
compounds including choline or the pesticide carbofuran and utilize them as sole sources of carbon and energy. Bacteria that utilize formate, cyanide, and carbon monoxide have different modes of metabolism including pathways for the assimilation of one-carbon units (Hanson & Hanson 1996). The use of enzymes known as methane monooxygenases (MMO) to catalyze the oxidation of methane to methanol is a defining characteristic of methanotrophs. There are two forms of MMO viz particulate mono oxygenase (pMMO) and soluble monooxgenase (sMMO). The pMMO is encoded by three contigous gene : pmoA, pmoB, and pmoC; however, pmoA gene is highly conserved and often used as analyzing marker for methanotrophs. Figure 1 shows the pathways for the oxidation of methane and assimilation of formaldehyde.
5
Table 1 Characteristics of Type I, II, and X of Methanotrophs
6
This amplicon can be used for various purposes in molecular analysis (Hapwood et al. 1985 ; Sivakumar 2001).
Denaturing gradient gel electrophoresis (DGGE) is a commonly used technique in molecular biology and has become a staple of environmental microbiology for characterization of population structure and dynamics. DGGE analyses are employed for the separation of double-stranded DNA fragments that are identical in length, but differ in sequence (Muyzer and Smalla 1998). In practice, this refers to the separation of DNA fragments produced via PCR amplification. The technique exploits (among other factors) the difference in stability of G-C pairing (three hydrogen bonds per pairing) as opposed to A-T pairing (two hydrogen bonds). A mixture of DNA fragments of different sequence are electrophoresed in an acrylamide gel containing a gradient of increasing DNA denaturants. In general, DNA fragments richer in GC will be more stable and remain double-stranded until reaching higher denaturant concentrations. Double-stranded DNA fragments migrate better in the acrylamide gel, while denatured DNA molecules become effectively larger and slow down or stop in the gel. In this manner, DNA fragments of differing sequence can be separated in an acrylamide gel.
DNDC Model
The Denitrification-Decomposition (DNDC) model is a process-oriented computer simulation model of carbon and nitrogen biogeochemistry in agroecosystems. This model was introduced by Institute for the Study of Earth, Oceans and Space, University of New Hampshire. The model consists of two components. The first component, consisting of the soil climate, crop growth and decomposition sub-models, predicts soil temperature, moisture, pH, redox potential (Eh) and substrate concentration profiles driven by ecological drivers (e.g., climate, soil, vegetation and anthropogenic activity). The second component, consisting of the nitrification, denitrification and fermentation sub-models, predicts emissions of carbon dioxide (CO2), methane (CH4), ammonia
(NH3), nitric oxide (NO), nitrous oxide (N2O) and dinitrogen (N2) from the
plant-soil systems. Classical laws of physics, chemistry and biology, as well as empirical equations generated from laboratory studies, have been incorporated in the model to parameterize each specific geochemical or biochemical reaction. Cai et al. (2003) stated that the use of DNDC can be valuable to simulate the methane emission based on the farming management practice used in the rice fields.
METHOD
Research Framework
7 and comparison of methane emission based on actual data from the rice fields and simulated data which analyzed by DNDC 9.5 software.
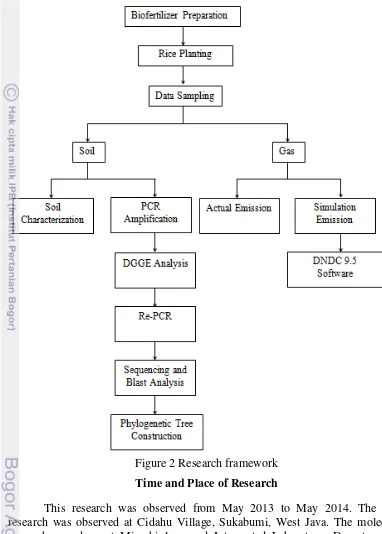
Figure 2 Research framework
Time and Place of Research
This research was observed from May 2013 to May 2014. The field research was observed at Cidahu Village, Sukabumi, West Java. The molecular research was done at Microbiology and Intergrated Laboratory, Department of Biology, Faculty of Mathematics and Natural Science, Bogor Agricultural University.
Bacterial Isolates Preparation
8 plot measured approximately 150 m2 with 2020 cm of planting distance. Control treatment used a patch while soaking and spread treatments respectively used four patch. The rice clump then planted in rice fields. In the control treatment, the patch was given by 300 kg ha-1 of NPK fertilizer. In the soaking and spread treatment, the patch was given by 200 kg ha-1 of NPK fertilizer and biofertilizer but in the soaking treatment the clumps were soaked with biofertilizer liquid for 15 minutes before being transferred to the patch.
Soil Characteristic Analysis
One kilogram of soil samples were taken from each plot then sent to the Soil Laboratory at Center for Agricultural Land Resources, Soil Research Institute, Bogor to be analyzed its soil type and characteristic (Appendix 2).
DNA Extraction and Quantification
Soil samples which taken at 30, 60, and 90 days after planting (DAP) from each treatment were extracted to get the DNA template using PowerSoilTM Soil DNA Isolation Kit, MO BIO Laboratories, USA. DNA template was quantificated using Nanodrop.
PCR Amplification
PCR amplification reactions were performed in 25 µL (total volume) reaction mixtures in 0.2 ml PCR tubes using ESCO DNA thermal cycler. All PCR amplification of the pmoA gene used the GC-A189f (5’- CCC-CCC-CCC-CCC- CGC-CCC-CCG-CCC-CCC-GCC-CCC-GCC-GCC-CGG-NGA-CTG-GGA-CTT-CTGG-3’) and A682r primer (5’-GAA-SGC-NGA-GAA-GAA-SGC-3’) (Henckel et al. 1999). Individual reagents and their concentrations of amounts were as follows : 12.5 µL of Taq DNA polymerase (supplied by KAPA 2G Robust Hot-Start, KAPA Biosystems USA), 1.25 µL of each primer (20 pmol), 3 µL of DNA template (~100 ng µL-1), and 7 µL of ddH2O. The PCR steps were
optimized and consisted as follows : 95 oC for 1 min, followed by 30 cycles of 95
o
9
DGGE Analysis of the pmoA Gene
PCR products amplified with GC-A189f and A682r primer set were separated on a gradient of 35-80% (Henckel et al. 1999) using a DCodeTM Universal Mutation Detection System (BIO-RAD, USA) on 1-mm-thick polyacrylamide gels (6% [wt/vol]) acrylamide-bisacrylamide [37.5:1]) (BIO-RAD, USA). The gel was electrophoresed in 1XTAE at 60 oC and 150 V for 6 hours. The gel then stained using SYBR Safe for 60 min and scanned by Gel Doc 1000 (BIO-RAD, USA).
DGGE Bands Extraction and Re-PCR
Samples of individual DGGE bands were excised from ployacrylamide gel using sterile scalpel then inserted to a microtube consisted of 50 µL of sterile biquadest. The microtube was incubated at 4 oC overnight and 60 oC for 2 hours (Coelho et al. 2009; Perez et al. 2014). A 10 µL (~30 ng µL-1) of template was Nucleotide sequences were blasted in www.ncbi.nlm.nih.gov and analyzed to get the phylogenetic tree using the neighbour joining program in MEGA 5 software.
Methane Gas Emission Measurement
Gas sampling was taken by closing the sample plots in the fields with the lid box. A box was placed in each treatment. Gas samples then taken from the inside the box using a 100 ml syringe then stored in vacuum glass bottle. Gas sampling was conducted on vegetative and generative phase. At 30, 60, and 90 DAP (Days After Planting), the gas was taken then sent to Greenhouse Gas Laboratory, Environmental Research Institute of Agriculture, Jakenan Pati, Central Java to be analyzed the CH4 concentration. The CH4 concentration results
converted to obtain the flux rate of gas change emission during the cropping time. The CH4 emission was also simulated by DNDC 9.5 software to obtain the flux
rate of the gas concentration through the year of cropping.
10
RESULT AND DISCUSSION
Result Soil Characteristic
Soil characteristic plays an important role on biogeochemical systems in nature. Based on the United States of Department of Agriculture soil criteria, the analysis result showed that the composition of the soil with 16% of sand, 33% of silt and 51% of clay then categorized as clay loam soil. Soil contained 1.81% of C. Based on the result obtained, it can be seen that the carbon content in soil was classified as low category. In addition to the soil organic content, the pH value also played an important role in influencing the development of microorganisms. Soil pH value obtained was 5.2 and categorized as acidic soil pH.
DNA Concentration and PCR Amplification
Quantification results obtained from the DNA template extraction process indicated that the DNA concentration of all samples were not much different. The result showed that the concentration ranged from 24.4 to 28 ng µL-1 (Table 2).
Table 2 DNA template concentration
11
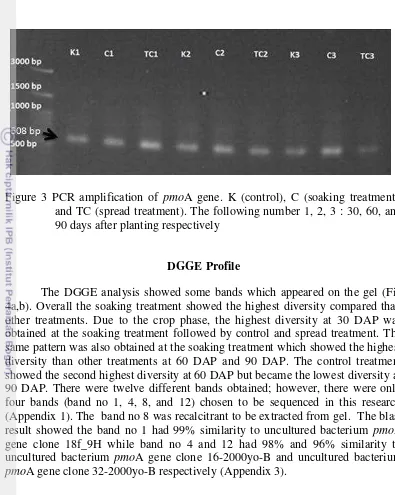
Figure 3 PCR amplification of pmoA gene. K (control), C (soaking treatment), and TC (spread treatment). The following number 1, 2, 3 : 30, 60, and 90 days after planting respectively
DGGE Profile
The DGGE analysis showed some bands which appeared on the gel (Fig 4a,b). Overall the soaking treatment showed the highest diversity compared than other treatments. Due to the crop phase, the highest diversity at 30 DAP was obtained at the soaking treatment followed by control and spread treatment. The same pattern was also obtained at the soaking treatment which showed the highest diversity than other treatments at 60 DAP and 90 DAP. The control treatment showed the second highest diversity at 60 DAP but became the lowest diversity at 90 DAP. There were twelve different bands obtained; however, there were only four bands (band no 1, 4, 8, and 12) chosen to be sequenced in this research (Appendix 1). The band no 8 was recalcitrant to be extracted from gel. The blast result showed the band no 1 had 99% similarity to uncultured bacterium pmoA gene clone 18f_9H while band no 4 and 12 had 98% and 96% similarity to uncultured bacterium pmoA gene clone 16-2000yo-B and uncultured bacterium pmoA gene clone 32-2000yo-B respectively (Appendix 3).
The Phylogenetic Tree
12
(a)
(a)
(b)
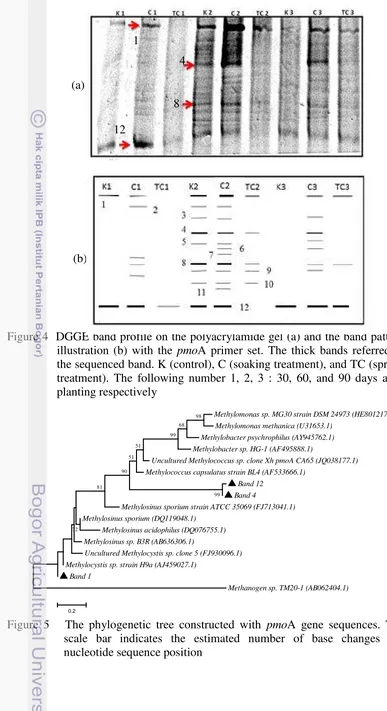
Figure 4 DGGE band profile on the polyacrylamide gel (a) and the band pattern illustration (b) with the pmoA primer set. The thick bands referred to the sequenced band. K (control), C (soaking treatment), and TC (spread treatment). The following number 1, 2, 3 : 30, 60, and 90 days after planting respectively
Figure 5 The phylogenetic tree constructed with pmoA gene sequences. The scale bar indicates the estimated number of base changes per nucleotide sequence position
Methylomonas sp. MG30 strain DSM 24973 (HE801217.1) Methylomonas methanica (U31653.1)
Methylobacter psychrophilus (AY945762.1)
Methylobacter sp. HG-1 (AF495888.1)
13
Methane Gas Emission
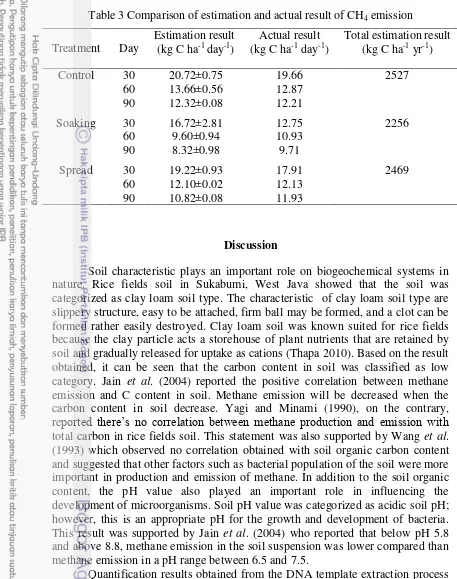
The lowest methane gas emission in the generative phase was obtained at the soaking then followed by the spread and control treatment respectively (Fig 6). The estimation gas emission rate was increased at the early day of planting phase then decreased significantly. The rate was showed to increase again till around 35 days after planting then decreased slightly till the generative phase. The soaking treatment showed 12.29% lower emission of methane while the spread treatment only showed 2.29% lower emission of methane compared than control treatment (Table 3).
Figure 6 Flux rate of CH4. Symbols: ( ) the estimation result of the control
treatment; ( ) the estimation result of the soaking treatment; ( ) the estimation result of the spread treatment; ( ) the actual result of the control treatment; ( ) the actual result of the soaking treatment; ( ) the actual result of the spread treatment
14
Table 3 Comparison of estimation and actual result of CH4 emission
Treatment Day
Soil characteristic plays an important role on biogeochemical systems in nature. Rice fields soil in Sukabumi, West Java showed that the soil was categorized as clay loam soil type. The characteristic of clay loam soil type are slippery structure, easy to be attached, firm ball may be formed, and a clot can be formed rather easily destroyed. Clay loam soil was known suited for rice fields because the clay particle acts a storehouse of plant nutrients that are retained by soil and gradually released for uptake as cations (Thapa 2010). Based on the result obtained, it can be seen that the carbon content in soil was classified as low category. Jain et al. (2004) reported the positive correlation between methane emission and C content in soil. Methane emission will be decreased when the carbon content in soil decrease. Yagi and Minami (1990), on the contrary, reported there’s no correlation between methane production and emission with total carbon in rice fields soil. This statement was also supported by Wang et al. (1993) which observed no correlation obtained with soil organic carbon content and suggested that other factors such as bacterial population of the soil were more important in production and emission of methane. In addition to the soil organic content, the pH value also played an important role in influencing the development of microorganisms. Soil pH value was categorized as acidic soil pH; however, this is an appropriate pH for the growth and development of bacteria. This result was supported by Jain et al. (2004) who reported that below pH 5.8 and above 8.8, methane emission in the soil suspension was lower compared than methane emission in a pH range between 6.5 and 7.5.
15 McDonald et al. (2008) who stated that the PCR amplification which targeted pmoA gene using A189f and A682r primer sets will generate amplicon with the size of 525 bp.
The diversity of microbial communities related to the methane oxidation based on pmoA functional gene was able to be represented using DGGE technique. The result showed there were different patterns of microbial community diversity when all of them compared due to the crop phase and treatment used. Due to the crop phase, the highest diversity at 30 DAP was obtained at the soaking treatment followed by control and spread treatment. It showed the correlation to the lower methane emission obtained at the soaking treatment than control and spread treatment. The same pattern was also obtained at the soaking treatment which showed the highest diversity than other treatments at 60 DAP and 90 DAP. The control treatment showed the second highest diversity at 60 DAP but became the lowest diversity at 90 DAP. This result was related to the not-flooded condition on top soil at 60 DAP then the soil condition was still aerobic enough and supported the growth of indogenous methanotrophic bacteria. The uncultured bacterium pmoA gene clone 18f_9H and uncultured bacterium pmoA gene clone 32-2000yo-B were appeared almost constant from 30 DAP to 90 DAP while uncultured bacterium pmoA gene clone 16-2000yo-B appeared clearly at 60 DAP. It can be seen that the diversity was increased from vegetative phase to early of generative phase. It was consistent with Das and Adhya (2012) who stated that the methanogenic archaea population will decline during the vegetative to generative phase then the methanotrophic bacterial population will be increased. The increased methanotrophic bacterial population was also due to the wetland drainage activities in the generative phase so the wetland conditions become more aerobic and unsuitable habitat for methanogenic archaea growth.
The blast result of band no 1, 4, and 12 showed the consistency for both forward and reverse sequence which analyzed in www.ncbi.nlm.nih.gov. The phylogenetic tree showed the clustering view of samples analyzed and methanotrophic bacteria. The band no 1 was closely related into type II methanotroph in genera of Methylocystis while the band no 4 and 12 were closely related to the type I methanotroph in genera of Methylococcus. These results were correlated to Hoffman et al. (2002) ; Mohanty et al. (2007) ; Zheng et al. (2008) who reported that the dominance of Methylobacter, Methylomicrobium, Methylococcus, Methylocaldium, Methylocystis, and Methylosinus in the rice fields soil. Horz et al. (2001) also stated the different pattern of methanotroph bacteria diversity between rice field soil and rice plant roots. Genera of Methylomonas, Methylobacter, Methylococcus were found in the rice plant roots while genera of Methylocystis and Methylosinus can be found in both rice fields soil and rice plant roots. Different diversity of methanotrophic bacteria between flooded rice fields and drained rice fields also reported by Mayumi et al. (2010) that flooded rice fields were dominated by Methylocystis and Methylosinus while drained rice fields were dominated by Methylomonas, Methylosarcina, and Methylomicrobium.
16
methane gas emission increased in the vegetative phase and decrease towards the generative phase. The soil which begins to dry in the generative phase decreases the population of methanogenic archaea. This effect will cause the rate of methane production and emissions go down. Setyanto and Susilawati (2007) also reported the high methane was produced during the vegetative phase, especially at maximum tiller, and tended to go down in the generative phase. The decrease was caused by use of plant photosynthate at the process leading to formation of flowers womb and also root exudates in soil were low in the generative phase. The lower content of root exudates was the higher inhibition of methanogenesis process so that flux of methane was down. Root exudates are organic compounds consisting of sugars, amino acids, and organic acids as constituent materials immediately available for methanogenic archaea. In the flooded condition, methane emission was higher than that in dry condition (Kimura et al. 1991; Wihardjaka 2005).
17 gas emission reduction. Pingak et al. (2014) also reported that the application of methanotrophic bacterial isolates in rice fields were known to decrease the rate of gas emission compared with soil which only given by the inorganic fertilizer. Methane gas emission can be reduced by methanotrophic bacterial isolates because the combination of these bacteria (BGM 1, BGM 5, BGM 9, and SKM 14) were confirmed to have the methane monooxygenase (MMO) enzyme acitivity which play roles in the methane gas oxidation (Maharani 2011). MMO is an enzyme that plays role in the oxidation of methane to methanol (Hanson and Hanson 1996). The control treatment was the highest among others because the use of inorganic fertilizer with excessive dosing while the lowest emission obtained at the soaking treatment result can be related to the better methane oxidation activity performed by methanotrophic bacteria isolates of BGM 1, BGM 5, BGM 9, and SKM 14 which soaked to the rice clumps at the soaking treatment compared to other treatments.
CONCLUSION AND RECOMMENDATION
Conclusion
The DGGE showed methane-oxidizing microbial community succession during the vegetative phase to generative phase. The treatment which rice clumps was soaked by biofertilizer showed both the highest diversity and the lowest emission than the control treatment as well as the treatment which only spread by biofertilizer. The blast result of DGGE bands were closely related to uncultured bacterium pmoA gene clone 18f_9H, uncultured bacterium pmoA gene clone 16-2000yo-B, and uncultured bacterium pmoA gene clone 32-2000yo-B. The actual result of methane gas emission measurement in this study had similar trend to the estimation result analyzed by DNDC 9.5 software. Methane gas emission rate was decreased from the vegetative phase to the generative phase.
Recommendation
19
REFERENCES
Cai Z, Sawamoto T, Li C, Kang G, Boonjawat J, Mosier A, Wassmann R, Tsuruta H. 2003. Field validation of the DNDC model for greenhouse gas emissions in East Asian cropping systems. Glob Biogeochem Cycles. : 17(4) : 1107-1118. doi:10.1029/2003GB002046.
Campbell NA, Reece JB, Mitchell LG. 2002. Biologi. Edisi Kelima. Lestari R, translator. Jakarta (ID): Erlangga. Translated from : Biology. Fifth Edition. Coelho MRR, Marriel IE, Jenkins SN, Langon CV, Seldin L, O’Donnell AG.
2009. Molecular detection and quantification of nifH gene sequences in the rhizosphere of sorghum (Sorghum bicolor) sown with two levels of nitrogen fertilizer. Appl Soil Ecol. 42 : 48-53.
D’Onofrio A. 2010. Siderophores from neighboring organism promote the growth of uncultured bacteria. Chem Biol. 17 : 254-264.
Das S, Adhya TK. 2012. Dynamics of methanogenesis and methanotrophy in tropical paddy soils as influenced by elevated CO2 and temperature
interaction. Soil Biol Biochem. 47: 36-45.
Degelmann DM, Borken W, Drake HL, Kolb S. 2010. Different Atmospheric Methane-Oxidizing Communities in European Beech and Norway Spruce Soils. Appl Environ Microbiol. 76: 3228–3235.doi : 10.1128/AEM.02730-09. Hakemian AS, Rosenzwelg AC. 2007. The biochemistry of methane oxidation.
Annu Rev Biochem. 76 : 223-241.
Hanson RS, Hanson T. 1996. Methanotrophic bacteria. Microbiol Rev. 60: 439- 471.
Hapsari W. 2008. Isolasi dan karakterisasi bakteri metanotrof asal sawah di Bogor dan Sukabumi [undergraduate thesis]. Bogor (ID): Institut Pertanian Bogor. Hapwood DA et al. 1985. Genetic Manipulation of Streptomycetes: A Laboratory
Manual. Norwich (GB) : John Innes Foundation.
Henckel T, Friedrich M, Conrad R. 1999. Molecular analyses of the methane-oxidizing microbial community in rice field soil by targeting the genes of the 16S rRNA, particulate methane monooxygenase, and methanol dehydrogenase. Appl Environ Microbiol. 65:1980–1990.
Hoffman T, Horz HP, Kemnitz D, Conrad R. 2002. Diversity of the particulate methane monooxygenase gene in methanotrophic samples from different rice field soils in china and the philippines. System Appl Microbiol. 25 : 267-274. Holmes AJ, Roslev P, McDonald IR, Iversen N, Henriksen K, Murrell JC. 1999.
Characterization of methanotrophic bacterial populations in soils showing atmospheric methane uptake. Appl Environ Microbiol. 65 (8) : 3312–3318. Horz HP, Yimga MT, Liesack W. 2001. Detection of methanotroph diversity on
roots of submerged rice plants by molecular retrieval of pmoA, mmoX, mxaF, and 16S rRNA and ribosomal DNA, including pmoA-based terminal restriction fragment length polymorphism profiling. Appl Environ Microbiol. 67 (9) : 4177-4185. doi : 10.1128/AEM.67.9.4117-4185.2001.
[IPCC] International Panel on Climate Change. 2007. Climate Change 2007: Mitigation of Climate Change. Cambridge (GB) : Cambridge Univ Pr.
20
Karl DM, Beversdorf L, Bjorkman KM, Church MJ, Martinez A, DeLong EF. 2008. Aerobic production of methane in the sea. Nat Geosci. 1: 473–478. doi: 10.1038/ngeo234.
Khalil MAK, Shearer MJ, Rasmussen RA, Changlin D, Lixin R. 2008. Production, oxidation, and emissions of methane from rice fields in China. J Geophys Res. 113 : 1-12. doi : 10.1029/2007JG000461.
Kimura M, Miura Y, Watanabe A, Katoh T, Haraguchi H. 1991. Methane emission from paddy field (Part 1). Effect of fertilization, growth stage and midsummer drainage: Pot experiment. Environ Sci. 4 : 265-271.
King GM, Nanba K. 2008. Distribution of atmospheric methane oxidation and methanotrophic communities on Hawaiian volcanic deposits and soils. Microb Environ. 23: 326–330. doi: 10.1264/jsme2.ME08529.
Lelieveld J, Crutzen PJ, Dentener FJ. 1998. Changing concentration, lifetime and climate forcing of atmospheric methane. Chem Phys Meteorol. 50: 128–150. Li C, Xiao X, Frolking S, Moore B, Qiu J, Zhang Y, Zhuang Y, Wang X, Dai Z,
Liu J, Qin X, Liao B, Sass R. 2003. Greenhouse gas emission from cropland of China. Quat Sci. 5:493-503.
Maharani R. 2011. Aktivitas oksidasi metan dan reduksi dinitrogen oksida (N2O)
kultur kombinasi bakteri metanotrof dan Ochrobactrum anthropi [undergraduate thesis]. Bogor (ID): Institut Pertanian Bogor.
Maxfield PJ, Hornibrook ERC, Evershed RP. 2006. Estimating high-affinity methanotrophic bacterial biomass, growth, and turnover in soil by phospholipid fatty acid C-13 labeling. Appl Environ Microbiol. 72 : 3901– 3907. doi: 10.1128/AEM.02779-05.
Mayumi D, Yoshimoto T, Uchiyama H, Nomura N, Nakajima KT. 2010. Seasonal change in methanotrophic diversity and populations in a rice field soil assessed by DNA-stable isotope probing and quantitative real-time PCR. J S Microb Environ. 25(3):156-163. doi: 10.1264/jsme2.ME10120.
McDonald IR, Bodrossy L, Chen Y, Murrel JC. 2008. Molecular ecology techniques for the study of aerobic methanotrophs. Appl Environ Microbiol. 74 (5) : 1305-1315. doi : 10.1128/AEM.02233-07.
Mohanty SR, Bodelier PLE, Conrad R. 2007. Effect of temperature on composition of the methanotrophic community in rice field and forest soil. FEMS Microbiol Ecol. 62 (1) : 24-31.
Murrell JC, Gilbert B, McDonald IR. 2000. Molecular biology and regulation of methane monooxygenase. Arch Microbiol. 173:325–332.
Muyzer G, Smalla K. 1998. Application of denaturing gradient gel electrophoresis and temperature gradient gel electrophoresis in microbial ecology. Antonie van Leeuvenhoeck 73:127-141.
Perez PG, Ye J, Wang S, Wang XL, Huang DF. 2014. Analysis of the occurence and activity of diazotrophic communities in organic and conventional horticultural soils. Appl Soil Ecol. 79 : 37-48.
Pingak GMF, Sutanto H, Akhdiya A, Rusmana I. 2014. Effectivity of methanotrophic bacteria and Ochrobactrum antropi as biofertilizer and emission reducer of CH4 and N2O in organic paddy fields. J Med Bioeng. 3 (3)
21 Qin D, Chen Z, Marquis M, Averyt KB, Tignor M, Miller H. 2007. Summary for Policymarkers. Contribution of Working Group I due to the Fourth Assessment Report of the Intergovernmental Panel on Climate Change. Cambridge (GB) : Cambridge Univ Pr.
Setyanto P. 2004. Mitigasi Gas Metan Dari Lahan Sawah. In Agus F, Adimihardja A, Hardjowigeno S, Fagi AM, Hartatik W, editor. Tanah Sawah dan Teknologi Pengelolaannya. Bogor (ID) : Pusat Penelitian dan Pengembangan Tanah dan Agroklimat.
Setyanto P, Susilawati HL. 2007. Emisi Gas Rumah Kaca dari Varietas Padi Pasang Surut. Seminar Nasional Pertanian Lahan Rawa. Banjarbaru (ID): Balai Penelitian Pertanian Lahan Rawa.
Sivakumar K. 2001. Actinomycetes. of an Indian mangrove (Pichavaram) environment: an inventory [thesis]. India (IN) : Annamalai Univ Pr.
Thapa M. 2010. Factors affecting fertilizer use efficiency in dry season paddy production in Makawanpur district, mid hill, Nepal. Agro J Nepal 1 : 123-133. Wang ZP, Laune RD, Masscheleyn PH, Patrick WH. 1993. Soil redox and pH
effects on methane production in a flooded rice field. Soil Sci Soc Am J. 57 : 382-285.
Wang JS, Logan JA, McElroy MB, Duncan BN, Megretskaia IA, Yantosca RM. 2004. A 3-D model analysis of the slowdown and interannual variability in the methane growth rate from 1988 to 1997. Global Biogeochem Cycles 18 :1-31. doi: GB3011 10.1029/2003GB002180.
Wihardjaka A. 2005. Fluks Metan pada Beberapa Komponen Teknologi Sawah Tadah Hujan di Kabupaten Pati. Prosiding Seminar Nasional Inovasi Teknologi Pengelolaan Sumberdaya Lahan Rawa dan Pengendalian Pencemaran Lingkungan. Banjarbaru (ID) : Puslitbangtan dan Agroklimat Badan Litbang Pertanian.
Yagi K, Minami K. 1990. Effects of organic matter application on methane emission from some Japanese paddy fields. Soil Sci Plant Nutr. 36 : 599-610. Zheng Y, Zhang LM, Zheng YM, Di H, He JZ. 2008. Abundance and community
22
23 Appendix 1 Sequencing result of all bands excised from DGGE gel
24
26
27
29
30
32
Appendix 2 Soil texture classification by USDA
33 Appendix 4 Notification of acceptance on “Advances in Environmental Biology”
Notification of Acceptance of the ICEBS 2014 September 26-27, 2014, Krabi, Thailand
www.ipncoference.org/icebs-2014.html
Author Name Hendri Sutanto
Paper ID 010-icebs
Paper Title Microbial community succession of methanotrophic bacteria based on pmoA gene in rice fields
Dear Author,
Congratulations !
The review processes for International Conference on Environmental and Biological Sciences (iCEBS 2014)have been completed. Based on the recommendations of the Technical Committees /reviewers and the acceptance from AEB Editorial Board, we are pleased to inform you that your paper identified above has been accepted for publication in the Advances in Environmental Biology (special issue International Conference on Environmental and Biological Sciences (iCEBS 2014). You are cordially invited to present the paper orally at ICEBS 2014 to be held on September 26-27, 2014, Krabi, Thailand
The ICEBS 2014 2014 is organized by International Postgraduate Network (IPN.org), IPN Malaysia and cosponsored by AENSI.
(Important) So in order to the register the conference and have your paper included in the special issue successfully, you must finish following SIX steps.
1. Revise your paper according to the Review Comments in the attachment carefully (if any).
2. Download and complete the Registration Form.
34
4.Send your final papers (both .doc and .pdf format), filled registration form (.doc format) and scanned paid screenshot (PDF format) to us at [email protected] (Before July 30, 2014).
If the above requirements are met by the set deadlines, all accepted papers of ICEBS 2014 will be published in Advances in Environmental Biology (ISSN: 1995-0756) (special issue International Conference on Environmental and Biological Sciences (iCEBS 2014))
Please strictly adhere to the format specified in the conference template while preparing your final paper. If you have any problem in preparing the final paper, please feel free to contact us via [email protected]. For the most updated information on the conference, please check the conference website at www.ipncoference.org/icebs-2014.html. The Conference Program will be available at the website in August, 2014.
Finally, we would like to further extend our congratulations to you and we are looking forward to meeting you in Krabi, Thailand
Yours sincerely,
ICEBS 2014 Organizing Committees
Krabi, Thailand
www.ipncoference.org/icebs-2014.html
35
BIOGRAPHY
The author was born in Jakarta as the second child from Mr. Sutanto and Mrs. Cecilia Lu. The author graduated from SMAN 78 Jakarta in 2009. In the same year, the author was accepted as a undergraduate student of Biology Major, Faculty of Mathematics and Natural Sciences, Bogor Agricultural University through The State University Entrance National Selection (SNMPTN) then graduated in 2013. The author was listed as the grantee of Academic Achievement Improvement Scholarship (PPA) from the Directorate of Higher Education, Ministry of Education and Culture RI from 2009-2013. The author was registered as fast-track student of Microbiology Major, Graduate School IPB in 2012-2014.
During became a graduate student of Microbiology Major, the author has participated on International Genetically Enginereed Machine (iGEM) 2012 at HongKong University of Science and Technology (HKUST), HongKong. The author is an author team member of a paper entitled
“Effectivity of Methanotrophic Bacteria and Ochrobactrum anthropi as Biofertilizer and Emission
Reducer of CH4 and N2O in Inorganic Paddy Fields” which has been published on Journal of
Medical and Bioengineering and presented on The Third International Conference om Environmental and BioScience (ICEBS) 2013, Phuket Thailand.
As one of the requirements to obtain the degree of Master of Science (M.Si), the author
conducted a research entitled "Community Succession of Methanotrophic Bacteria Based on pmoA