SPATIAL MULTI CRITERIA DECISION MAKING
FOR COASTAL LAND MANAGEMENT
(A Case Study in Maros, South Sulawesi)
FERRARI PINEM
GRADUATE SCHOOL
SPATIAL MULTI CRITERIA DECISION MAKING
FOR COASTAL LAND MANAGEMENT
(A Case Study in Maros, South Sulawesi)
FERRARI PINEM
This Thesis submitted for the degree of Master of Science Of Bogor Agricultural University
MASTER OF SCIENCE IN INFORMATION TECHNOLOGY
FOR NATURAL RESOURCES MANAGEMENT
GRADUATE SCHOOL
STATEMENT
I, Ferrari Pinem, here by stated that this thesis entitled:
Spatial Multi Criteria Decision Making For Coastal Land Management (Case Study in Maros, South Sulawesi)
Are results of my own work during the period of January until July 2006 and that it has not been published before. The content of this thesis has been examined by the advising committee and the external examiner.
Bogor, August 2006
ACKNOWLEDGEMENTS
First of all, I would like to express my gratitude to God, the Almighty for
His Mercy, Favor, blazing me to carry out this task with sound health.
I wish to express my Earnest thanks and sincere appreciation to the National
Coordinating Agency for Surveys and Mapping (Bakosurtanal), Indonesia for
giving me the opportunity to continue my studies at Master of Science in
Information Technology for Natural Resource management (MIT). Consequently,
I am greatly indebted to all responsible persons from the Bakosurtanal for
providing the financial support essential for overall expenses during the whole
study period in MIT study program under Bogor Agricultural University,
Indonesia. It was not possible for me to complete the research work without this
financial providing.
I would like to express my deepest gratitude to Dr. Tania June, who has
mainly supervised my research work during the whole period. I am also thanks to
my Co-supervisor Dr. Anton B. Wijanarto. He always encouraged me and kindly
provided me with invaluable advice. Moreover, I would like to express my
profound gratitude to the external examiner Dr. Gatot H. Pramono, Bakosurtanal,
who made my thesis acceptable with a lot of valuable discussions and comments
on the final presentation day.
My express, my gratitude to all of responsible person from the Marine
Natural Resources Center of Bakosurtanal for not only supporting necessary
spatial data and non spatial data of study area Maros, South Sulawesi, Indonesia
I am obliged to many persons who have given me immeasurable
encouragement and beneficial inspiration in realizing the completion of this work.
Among them, Mr. Yuni Hartanta, Meity, Atty Rahadiaty and Mr. Sein min are the
most supporting to give suggestions during my research time.
Most of all I would like to dedicate this thesis to my lovely mom in
heaven, Jesus always with u, and to my father who provided patient,
understanding, and encouragement during this course. Without their sincere
support I never could have completed this thesis.
My final appreciation should go to my brother and my sister. They always
encouraged me and gave me psychological support. Thank you very much indeed.
CURRICULUM VITAE
The author, Ferrari Pinem, was born on February 13th, 1978 in Kabanjahe, Karo Township, Indonesia. He is the oldest son of P.Pinem and N. Meliala. As his education background, he was studied his basic education in Markus Height School, Medan Township, Indonesia and passed his Basic Education High School in 1996. He was allowed to study in Gadjah Mada University and he received B.Sc degree in Geographic in 2002. In 2004, he was selected as a state scholar to study Master of Science in Information Technology for Natural Resource Management in Bogor, Indonesia and he received M.Sc in IT for NRM degree in 2006.
ABSTRACT
FERRARI PINEM (2006), Spatial Multi Criteria Decision Making For Coastal Land Management (A Case Study in Maros, South Sulawesi). Under the supervision of Dr. Tania June and Dr. Antonius B.Wijanarto.
Generally, master planning is created to determine areas that are suitable with its land characteristics and capability for specific uses. The process of land suitability classification is the evaluation and grouping of specific areas of land in terms of their suitability for a particular use. This is a complex process involving multiple decisions that may relate to biophysical, socio-economic and institutional/organizational aspects. Coastal management plan is created to achieve sustainable coastal resources uses, and coastal ecosystem protection from disturbance including pollution. It is not easy to maintain sustainable coastal resources, many problems were found to arrange it. One of coastal resources problems is conflict of space/land uses among stakeholders, population, and government in appropriate coastal development activities.
Integration of remote sensing, GIS and spatial multi criteria decision making were used to support coastal master planning for a sustainable coastal management. They are used for classify coastal zoning based on coastal land characteristics and spatial data building and focus to find particularly suitable area for some uses (aqua/ marine cultivation, fishing activities, and tourism in Maros), and identify conflicting area between land suitability and existing landuse and also to develop a coastal master planning using spatial multi criteria decision making for a sustainable coastal management.
Based on the result, Coastal zones in Maros were divided into 2 parts, they are buffer and uses zones, where each area have 343,07 km2 and 572,83 km2 respectively. It means that there is no conservation area, hence all areas is allowed for any uses by still considering environmental aspects. Mostly, fishpond exists in Maros coastal area, but based on land suitability analysis, this area can be converted into tourism area, where it was classified into 2 classes (suitable = 47.988 km2 and marginally suitable = 23.767 km2), especially in marine also showed that almost areas can support tourism activities, because characteristics of marine such as depth and brightness of water are supporting factors. In the land, there is conflict of interest between fishpond and resort tourism. Meanwhile conflict of interest among seaweed, kejapung, and fishing activities were found in marine area. Based on this conflict, analysis of policy scenario was needed.
Research Title : Spatial Multi Criteria Decision Making For Coastal Land Management (A Case Study in Maros, South Sulawesi)
Name : Ferrari Pinem
Student ID : G.051040151
Study Program : Master of Science in Information Technology for Natural Resources Management
Approved by,
Advisory Board
Dr. Ir. Tania June, M.Sc Dr. Antonius Bambang Wijanarto
Supervisor Co-supervisor
Endorsed by,
Program Coordinator Dean of the Graduate School
Dr. Ir. Tania June, M.Sc Dr. Ir. Khairil A. Notodiputro, M.S
TABLE OF CONTENTS
Pages
STATEMENT ……….. i
ACKNOWLEDGEMENT ……… ii
CURRICULUM VITAE ……….. iv
ABSTRACT ……….. v
TABLE OF CONTENTS ………. vi
LIST OF TABLES .…. ..……….. ix
LIST OF FIGURES .……….……….. …. x
LIST OF APPENDIX ……… xi
I. INTRODUCTION 1.1. Background ….. ………. 1
1.2. Problem Definition .………. 4
1.3. Objective ……….………. 5
1.4. Output ……….. 5
II. LITERATURE REVIEW 2.1. Definition and Scope of Coastal Ecosystem ………. 6
2.1.1. Mangrove Ecosystem ………. 7
2.1.2. Coral Reef Ecosystem ……… 7
2.1.3. Seagrass Ecosystem ……… 8
2.2. Coastal Region Master Zoning and Planning ………. 9
2.3. Development of Marine and Coastal Resources.……….. 11
2.3.1. Marine Cultivation (Fishpond, Seaweed and Keramba Jaring Apung) ……….. 12
2.3.2. Fishing Resources Potencies ……….……….. 14
2.3.3. Tourism Potencies ……….. 15
2.4. Remote Sensing …...…. ……….…………. 15
2.5. Geographic Information System ……….. 18
2.6. The Role of GIS and Remote Sensing for Coastal Management .…… 20
2.7. Land Suitability Analysis ..……… 22
2.8. Multi Criteria Decision Making (MCDM) ……….. 22
2.9. Framework of Decision Making and SMCDM ……… 24
III. METHODOLOGY 3.1. Time and Location ……… 26
3.2. Equipment And Data Requirement ……… 26
3.2.1. Data Collection ……….. 26
3.3. Framework of Research ……..……….. 28
3.3.1.Framework of Coastal Ecosystem Development Decision Making 28 3.3.2. Data Compilation ..……….. 28
3.3.3. Image Preprocessing ……….. 28
3.4. Field Checking ..………. 31
3.5. Data Analysis ……… 31
3.5.1. Physical and Chemical Variables ……….……… 31
3.5.2. Social, Economic and Ecology ……… 32
3.6. Determining Coastal Ecosystem Zones ……… 32
3.7. Coastal Ecosystem Development ..………. 34
3.7.1. Resort Tourism Area ……… 34
3.7.2. Marine or Aqua Cultivation ……… 34
3.7.3. Fishing Activities ………. 37
3.8. Land Suitability Analysis ……….. 37
3.9. Weighting and Scoring /Land Suitability Classes ………. 38
3.10. Framework of Coastal Development Decision Making ……….. 39
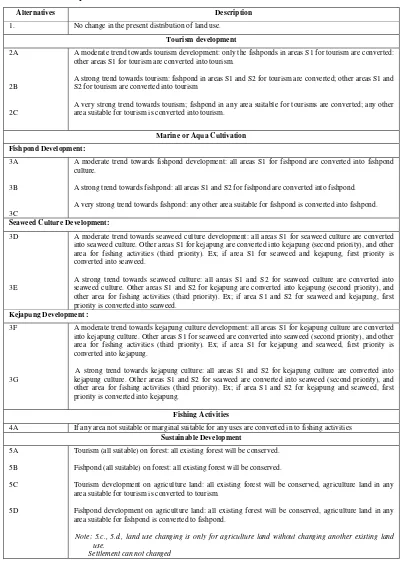
3.10.1. Landuse Priority Analysis ………. 39
3.10.2. Areas of Conflict ……….. 40
3.10.3. Formulation of Policy Alternatives .……… 40
3.10.4. Comparison of Alternatives ……….. 42
3.10.5. Selection of the Evaluation Criteria ………. 43
IV. RESULT AND DISCUSSION 4.1. Digital Image Processing ……….…………. 45
4.1.1. Radiometric Correction ……….. 45
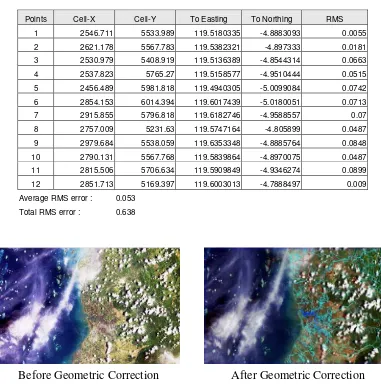
4.1.2. Geometric Correction ………. 45
4.2. Characteristic Of Coastal Region ……….. 47
4.2.1. Land Characteristic ………. 47
4.2.1.1. Topography ……… 47
4.2.1.2. Geology ……… 47
4.2.1.3. Landform ……….. 51
4.2.1.4. Soil ……… 51
2.2.1.7. Landuse ……… 52
4.2.2. Hydro-Oceanography Characteristic ……… 53
4.2.2.1. Physical Hydro-Oceanography ……… 53
4.2.2.2. Chemical Hydro-Oceanography ……….. 63
4.3. Coastal Ecosystem .………. 67
4.4. Potencies of Domestic Resources ……… 68
4.5. Coastal Ecosystem Zoning ……… 70
4.6. Land Suitability Analysis .……….. 72
4.6.1. Land Suitability for Tourism .………. 72
4.6.2. Land Suitability for Fishpond …….……….. 73
4.6.3. Land Suitability for Seaweed ……… 76
4.6.4. Land Suitability for Kejapung ……… 77
4.6.5. Land Suitability for Fishing Activities ……….. 80
4.7. Priority of Coastal Development …….……… 81
4.7.1. Land Conflict ………. 81
SPATIAL MULTI CRITERIA DECISION MAKING
FOR COASTAL LAND MANAGEMENT
(A Case Study in Maros, South Sulawesi)
FERRARI PINEM
GRADUATE SCHOOL
SPATIAL MULTI CRITERIA DECISION MAKING
FOR COASTAL LAND MANAGEMENT
(A Case Study in Maros, South Sulawesi)
FERRARI PINEM
This Thesis submitted for the degree of Master of Science Of Bogor Agricultural University
MASTER OF SCIENCE IN INFORMATION TECHNOLOGY
FOR NATURAL RESOURCES MANAGEMENT
GRADUATE SCHOOL
STATEMENT
I, Ferrari Pinem, here by stated that this thesis entitled:
Spatial Multi Criteria Decision Making For Coastal Land Management (Case Study in Maros, South Sulawesi)
Are results of my own work during the period of January until July 2006 and that it has not been published before. The content of this thesis has been examined by the advising committee and the external examiner.
Bogor, August 2006
ACKNOWLEDGEMENTS
First of all, I would like to express my gratitude to God, the Almighty for
His Mercy, Favor, blazing me to carry out this task with sound health.
I wish to express my Earnest thanks and sincere appreciation to the National
Coordinating Agency for Surveys and Mapping (Bakosurtanal), Indonesia for
giving me the opportunity to continue my studies at Master of Science in
Information Technology for Natural Resource management (MIT). Consequently,
I am greatly indebted to all responsible persons from the Bakosurtanal for
providing the financial support essential for overall expenses during the whole
study period in MIT study program under Bogor Agricultural University,
Indonesia. It was not possible for me to complete the research work without this
financial providing.
I would like to express my deepest gratitude to Dr. Tania June, who has
mainly supervised my research work during the whole period. I am also thanks to
my Co-supervisor Dr. Anton B. Wijanarto. He always encouraged me and kindly
provided me with invaluable advice. Moreover, I would like to express my
profound gratitude to the external examiner Dr. Gatot H. Pramono, Bakosurtanal,
who made my thesis acceptable with a lot of valuable discussions and comments
on the final presentation day.
My express, my gratitude to all of responsible person from the Marine
Natural Resources Center of Bakosurtanal for not only supporting necessary
spatial data and non spatial data of study area Maros, South Sulawesi, Indonesia
I am obliged to many persons who have given me immeasurable
encouragement and beneficial inspiration in realizing the completion of this work.
Among them, Mr. Yuni Hartanta, Meity, Atty Rahadiaty and Mr. Sein min are the
most supporting to give suggestions during my research time.
Most of all I would like to dedicate this thesis to my lovely mom in
heaven, Jesus always with u, and to my father who provided patient,
understanding, and encouragement during this course. Without their sincere
support I never could have completed this thesis.
My final appreciation should go to my brother and my sister. They always
encouraged me and gave me psychological support. Thank you very much indeed.
CURRICULUM VITAE
The author, Ferrari Pinem, was born on February 13th, 1978 in Kabanjahe, Karo Township, Indonesia. He is the oldest son of P.Pinem and N. Meliala. As his education background, he was studied his basic education in Markus Height School, Medan Township, Indonesia and passed his Basic Education High School in 1996. He was allowed to study in Gadjah Mada University and he received B.Sc degree in Geographic in 2002. In 2004, he was selected as a state scholar to study Master of Science in Information Technology for Natural Resource Management in Bogor, Indonesia and he received M.Sc in IT for NRM degree in 2006.
ABSTRACT
FERRARI PINEM (2006), Spatial Multi Criteria Decision Making For Coastal Land Management (A Case Study in Maros, South Sulawesi). Under the supervision of Dr. Tania June and Dr. Antonius B.Wijanarto.
Generally, master planning is created to determine areas that are suitable with its land characteristics and capability for specific uses. The process of land suitability classification is the evaluation and grouping of specific areas of land in terms of their suitability for a particular use. This is a complex process involving multiple decisions that may relate to biophysical, socio-economic and institutional/organizational aspects. Coastal management plan is created to achieve sustainable coastal resources uses, and coastal ecosystem protection from disturbance including pollution. It is not easy to maintain sustainable coastal resources, many problems were found to arrange it. One of coastal resources problems is conflict of space/land uses among stakeholders, population, and government in appropriate coastal development activities.
Integration of remote sensing, GIS and spatial multi criteria decision making were used to support coastal master planning for a sustainable coastal management. They are used for classify coastal zoning based on coastal land characteristics and spatial data building and focus to find particularly suitable area for some uses (aqua/ marine cultivation, fishing activities, and tourism in Maros), and identify conflicting area between land suitability and existing landuse and also to develop a coastal master planning using spatial multi criteria decision making for a sustainable coastal management.
Based on the result, Coastal zones in Maros were divided into 2 parts, they are buffer and uses zones, where each area have 343,07 km2 and 572,83 km2 respectively. It means that there is no conservation area, hence all areas is allowed for any uses by still considering environmental aspects. Mostly, fishpond exists in Maros coastal area, but based on land suitability analysis, this area can be converted into tourism area, where it was classified into 2 classes (suitable = 47.988 km2 and marginally suitable = 23.767 km2), especially in marine also showed that almost areas can support tourism activities, because characteristics of marine such as depth and brightness of water are supporting factors. In the land, there is conflict of interest between fishpond and resort tourism. Meanwhile conflict of interest among seaweed, kejapung, and fishing activities were found in marine area. Based on this conflict, analysis of policy scenario was needed.
Research Title : Spatial Multi Criteria Decision Making For Coastal Land Management (A Case Study in Maros, South Sulawesi)
Name : Ferrari Pinem
Student ID : G.051040151
Study Program : Master of Science in Information Technology for Natural Resources Management
Approved by,
Advisory Board
Dr. Ir. Tania June, M.Sc Dr. Antonius Bambang Wijanarto
Supervisor Co-supervisor
Endorsed by,
Program Coordinator Dean of the Graduate School
Dr. Ir. Tania June, M.Sc Dr. Ir. Khairil A. Notodiputro, M.S
TABLE OF CONTENTS
Pages
STATEMENT ……….. i
ACKNOWLEDGEMENT ……… ii
CURRICULUM VITAE ……….. iv
ABSTRACT ……….. v
TABLE OF CONTENTS ………. vi
LIST OF TABLES .…. ..……….. ix
LIST OF FIGURES .……….……….. …. x
LIST OF APPENDIX ……… xi
I. INTRODUCTION 1.1. Background ….. ………. 1
1.2. Problem Definition .………. 4
1.3. Objective ……….………. 5
1.4. Output ……….. 5
II. LITERATURE REVIEW 2.1. Definition and Scope of Coastal Ecosystem ………. 6
2.1.1. Mangrove Ecosystem ………. 7
2.1.2. Coral Reef Ecosystem ……… 7
2.1.3. Seagrass Ecosystem ……… 8
2.2. Coastal Region Master Zoning and Planning ………. 9
2.3. Development of Marine and Coastal Resources.……….. 11
2.3.1. Marine Cultivation (Fishpond, Seaweed and Keramba Jaring Apung) ……….. 12
2.3.2. Fishing Resources Potencies ……….……….. 14
2.3.3. Tourism Potencies ……….. 15
2.4. Remote Sensing …...…. ……….…………. 15
2.5. Geographic Information System ……….. 18
2.6. The Role of GIS and Remote Sensing for Coastal Management .…… 20
2.7. Land Suitability Analysis ..……… 22
2.8. Multi Criteria Decision Making (MCDM) ……….. 22
2.9. Framework of Decision Making and SMCDM ……… 24
III. METHODOLOGY 3.1. Time and Location ……… 26
3.2. Equipment And Data Requirement ……… 26
3.2.1. Data Collection ……….. 26
3.3. Framework of Research ……..……….. 28
3.3.1.Framework of Coastal Ecosystem Development Decision Making 28 3.3.2. Data Compilation ..……….. 28
3.3.3. Image Preprocessing ……….. 28
3.4. Field Checking ..………. 31
3.5. Data Analysis ……… 31
3.5.1. Physical and Chemical Variables ……….……… 31
3.5.2. Social, Economic and Ecology ……… 32
3.6. Determining Coastal Ecosystem Zones ……… 32
3.7. Coastal Ecosystem Development ..………. 34
3.7.1. Resort Tourism Area ……… 34
3.7.2. Marine or Aqua Cultivation ……… 34
3.7.3. Fishing Activities ………. 37
3.8. Land Suitability Analysis ……….. 37
3.9. Weighting and Scoring /Land Suitability Classes ………. 38
3.10. Framework of Coastal Development Decision Making ……….. 39
3.10.1. Landuse Priority Analysis ………. 39
3.10.2. Areas of Conflict ……….. 40
3.10.3. Formulation of Policy Alternatives .……… 40
3.10.4. Comparison of Alternatives ……….. 42
3.10.5. Selection of the Evaluation Criteria ………. 43
IV. RESULT AND DISCUSSION 4.1. Digital Image Processing ……….…………. 45
4.1.1. Radiometric Correction ……….. 45
4.1.2. Geometric Correction ………. 45
4.2. Characteristic Of Coastal Region ……….. 47
4.2.1. Land Characteristic ………. 47
4.2.1.1. Topography ……… 47
4.2.1.2. Geology ……… 47
4.2.1.3. Landform ……….. 51
4.2.1.4. Soil ……… 51
2.2.1.7. Landuse ……… 52
4.2.2. Hydro-Oceanography Characteristic ……… 53
4.2.2.1. Physical Hydro-Oceanography ……… 53
4.2.2.2. Chemical Hydro-Oceanography ……….. 63
4.3. Coastal Ecosystem .………. 67
4.4. Potencies of Domestic Resources ……… 68
4.5. Coastal Ecosystem Zoning ……… 70
4.6. Land Suitability Analysis .……….. 72
4.6.1. Land Suitability for Tourism .………. 72
4.6.2. Land Suitability for Fishpond …….……….. 73
4.6.3. Land Suitability for Seaweed ……… 76
4.6.4. Land Suitability for Kejapung ……… 77
4.6.5. Land Suitability for Fishing Activities ……….. 80
4.7. Priority of Coastal Development …….……… 81
4.7.1. Land Conflict ………. 81
4.7.3. Formulation of Policy Alternatives ……….. 83 4.7.4. Comparison of Alternatives Using MCA ……….. 89 4.7.5. Recommended Coastal Landuse Planning ……….. 95
V. CONCLUSION AND RECOMMENDATION
5.1. Conclusion ……… 97 5.2. Recommendation……… 98
LIST OF TABLES
2.1. Matrix of suitability for fishpond cultivation …..……….. 13 2.2. Matrix of suitability for seaweed cultivation. ………. 13 2.3. Matrix of suitability for keramba jaring apung cultivation ……… 14 2.4. Landsat TM spectral electromagnetic ………. 16 2.5. Landsat TM electromagnetic for specific application ……… 17 3.1. List of hardware, software and equipment ………. 27 3.2. Parameter, mapping unit and scoring variables .……… 32 3.3. Weighting and scoring of zone classification ……… 34 3.4. Matrix of suitability for resort tourism activities ……….. 35 3.5. Matrix of suitability for keramba jaring apung ……….. 35 3.6. Matrix of suitability for fishpond cultivation .……….. 36 3.7. Matrix of suitability for seaweed cultivation ………. 36 3.8. Matrix of suitability for fishing activities ……….. 37
3.9. Policy alternatives ……… 41
3.10. Assessment criteria ……… 43 4.1. Radiometric correction on digital imagery data ………. 45 4.2. Ground control point for geometric correction ……….. 46 4.3. Coastal ecosystem zone ………. 72 4.4. Land suitability analysis for tourism ………. 72 4.5. Land suitability analysis for fishpond ……….. 73 4.6. Land suitability analysis for seaweed ……… 76 4.7. Land suitability analysis for kejapung ……….. 77 4.8. Conflict matrix for fishpond and tourism suitability ………. 82 4.9. Conflict matrix for seaweed, kejapung and fishing activities suitability ….. 83 4.10. Present landuse in diferent suitability units for resort tourism and fishpond 84 4.11. Area of each land alternatives map ………. 89 4.12. Area of each marine alternatives map ……… 89
4.13. Assessment Criteria ……… 90
LIST OF FIGURES
2.1. Coastal Zone Boundary ………. 6 2.2. System Diagram for GIS Illustration ……….. 19 2.3. Integration of MCDM and GIS into Spatial MCDM ………. 25 3.1. Maros Location . ………. 26 3.2. Flowchart of Research ……… 29 3.3. Image Preprocessing ………. 30 3.4. Land Suitability Processing ………. 38 3.5. Determining Policy Alternative Maps ………. 42 3.6. MCA Flow ………... 44 4.1. Landsat TM of Maros before and after Correction ………. 46 4.2. Maros Topographic Map ……… 47
4.3. Maros Slope Map ……….. 48
4.4. Maros Geology Map ………. 49
4.5. Landform Map ………. 50
4.6. Soil Map ……… 52
4.7. Landuse Map ……… 55
4.8. Sample Point Map ……… 56
4.9. Sechi Disk Depth Map ………. 57
4.10. Sechi Disk Depth Map (%) ………... 58 4.11. Sea Surface Temperature Map ……… 60
4.12. Current Velocity map ………. 61
4.13. Bathymetric Map ……….. 62
4.14. Turbidity Map ………. 64
4.15. Dissolved Oxygen Map ……… 65 4.16. Potential of Hydrogen Map ……….. 66 4.17. Fishing Productivity in South Sulawesi 1998 – 2002 ……….. 70
4.18. Zonation Map ………. 71
LIST OF APPENDIX
Appendix-1: Sample Points ……… 104
I. INTRODUCTION
1.1. Background
Indonesia is the largest archipelagic country in the world, in which two
third of its area is covered by water, and the length of its coastline is
approximately 81,000 km that makes Indonesia becoming one of the longest
coastline countries in the world. Furthermore, coastal region is the center of
biodiversity, which it has resource potencies to be developed. Development of
coastal resources is supported by ecosystems with high biological productivity
such as: coral reef, seagrass, seaweed, mangrove, etc. At least, about 30 % of
total world mangrove forest and 18 % of total world coral reef exist in Indonesia.
The existing coastal resources are very important for Indonesian, because
more than 60 % or about 140 million of them live within 50 km from coastline.
The effect of excessive utilization could disturb the integrity of coastal ecosystem.
Therefore, a good coastal management is needed by considering its carrying
capacity to maintain the sustainability of the existing biological conditions.
The Act (UU) no. 24/1992 of Republic of Indonesian about master
planning, states that master planning should consider synchronization,
harmonization, and balancing of cultivation and protection, time, technology,
socio-culture, and of its defense and security functions. A good coastal
management will benefit both the socio-economic and ecological aspects.
Maros covers an area of approximately 1,613.11 km2 that consists of 14 districts. Referring to administrative boundary, in northern site is Pangkajene
region, in southern side is Makassar region, in eastern side is Bone region and
Based on the master planning that has been compiled by local government,
the southern part of Maros will become a conservation area with mangrove as
priority landuse. While, the northern part (research area) will become tourism
area, which is supported by marine and socio conditions.
The plan of coastal management needs data and information about coastal
natural resources. The information needs to display as numeric or spatial data,
hence it can be used for planning and decision making quickly and accurately.
There are coastal management and master planning that have been
produced by the Ministry of Marine and Fisheries Affairs to fulfill the
requirement of coastal region with protection aspects. This management is
expected to support life system and sustainable biodiversity, which will give some
advantages, such as: (1) sustainable biodiversity productivity, and (2) increasing
job opportunity, economic and region development.
Data inventory for coastal ecosystem master planning may be time
consuming and expensive. One alternative is by using remote sensing (RS)
techniques. This technique offers possibilities to collect information over larger
areas but requiring only few numbers of sample points.
Many kinds of remote sensing imagery can be used for inventory of
coastal resources. One of them is Landsat TM imagery, which has several spectral
combinations that make easier for objects identification. The use of remote
sensing technology is also possible for monitoring coastal ecosystem conditions.
It means that remote sensing imagery (Landsat TM) can be used to detect coastal
ecosystem condition at different time, due to its capability to record a data of same
Geographic Information System (GIS) can support spatial analysis, which
is often combined with remote sensing technique. The integration of remote
sensing and GIS application has long been used in spatial analysis and proven
effective and efficient. GIS has the capability to gather and analyze data that are
derived from remote sensing results with other data including field data and
secondary data as input into GIS spatial analysis, as well as developing coastal
master planning.
Some of spatial analyses have often been used for coastal master planning
such as for determining coastal/marine zones and landuse planning.
Coastal/marine zoning is locating regions that have similar characteristics and
requirements into area suitability zones for specific purpose, which can be used
for controlling and protecting coastal/marine regions. Meanwhile, coastal landuse
planning considers land capability for specific purposes to maintain sustainable
environment.
Generally, master planning is created to determine areas that are suitable
with its land characteristics and capability for specific uses. The process of land
suitability classification is the evaluation and grouping of specific areas of land in
terms of their suitability for a particular use. This is a complex process involving
multiple decisions that may relate to biophysical, socio-economic and
institutional/organizational aspects. Therefore, multi criteria decision-making is
needed to help coastal master planning development. Integration of spatial
analysis and multi-criteria decision-making is expected to provide better coastal
1.2. Problem Definition
Coastal management plan is created to achieve sustainable coastal
resources uses, and coastal ecosystem protection from disturbance including
pollution. It is not easy to maintain sustainable coastal resources, due to many
conflicting interests among stakeholders, population, and government in
appropriate coastal development activities. Hence, recommendation of a master
planning has to consider local government policy, population needs, and aspects
of economic, ecology, and socio-culture. It is a complex process involving
multiple decisions that may relate to biophysical, socio-economic and
institutional/organizational aspects.
Remote sensing and Geographical Information System (GIS) have often
been used in coastal master planning that have related to zoning and land
suitability analysis. Usage of these technologies is one of solutions to answer the
challenge of coastal data base uses.
Integration of remote sensing, GIS and spatial multi criteria decision
making were used to support coastal master planning for a sustainable coastal
management. This thesis will answer the following questions:
a. How to acquire physical and non-physical land characteristic to determine
zonation of coastal ecosystem using remote sensing techniques,
b. How to develop coastal master planning based on coastal ecosystem
zonation and land evaluation (its suitability) using GIS analysis, and
c. How to give the best solution alternatives to coastal master planning
development using spatial multi criteria decision-making for a sustainable
1.3. Objectives
Based on the questions above, research objectives are the following:
a. to classify coastal zone as a first step to create coastal master planning
based on coastal land characteristics,
b. to implement remote sensing and GIS techniques for spatial data building
and to find particularly suitable area for particular uses (aqua/ marine
cultivation, fishing activities, and tourism in Maros) by identifying coastal
resources capacities and its land suitability,
c. to identify conflicting area between its suitability and existing landuse,
d. to develop a coastal master planning using spatial multi criteria decision
making for a sustainable coastal management.
1.4. Output
The expected outputs for this thesis are:
a. Thematic maps of coastal resources such as coral reef distribution, sea
surface temperature, land-use, salinity, water depth, current velocity,
slope, turbidity, and potential of hydrogen.
b. Coastal ecosystem zonation map.
c. Land suitability maps for tourism, marine/aqua culture and fishing
activities by using spatial analysis.
d. Recommended maps that will be used for coastal master planning in
II. LITERATUR REVIEW
2.1. Definition and Scope of Coastal Ecosystem
“The term coastal zone means the coastal waters (including the land
therein and thereunder) and the adjacent shoreland (including the waters therein
and thereunder), strongly influenced by each and in proximity to the shorelines of
the several coastal states, and includes islands, transitional and inter tidal areas,
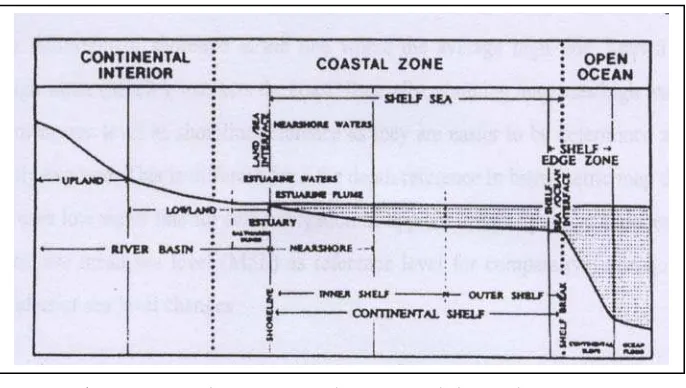
salt marshes, wetlands, and beaches” (Doydee, 2002). Coastal zone boundary is
[image:30.595.144.487.340.534.2]presented in Fig 2.1.
Fig 2.1. Coatal Zone Boundary (Puvadol Doyde, 2002)
The definition of coastal is based on 3 approaches, they are: ecology,
administrative and planning approaches. Based on ecological aspect, coastal
region is area that it is still influenced by marine and land processes. While, based
on administrative aspect, coastal as government administrative where area toward
marine is 12 mile from coastal line for province, and 1/3 from ½ mile from region/
city. Based on the planning aspect, coastal management is planning and arranging
Coastal ecosystem can be divided into 3 main ecosystems, namely:
mangrove, coral reef and seagrass.
2.1.1. Mangrove Ecosystem
Mangrove ecosystem is a peculiar habitat because it is found on the
boundary of land and sea. This ecosystem is important coastal natural resources
because it supports other animal life. Change of mangrove ecosystem will bring
impact on other ecosystem such as coral and seagrass ecosystems. Based on
existing potencies and its protection function, mangrove ecosystem is very
supporting sustainable coastal resources ecosystem.
The complexity of the mangrove ecosystem in Indonesia is different from
one area to another place, depending on the coastal physiography and the tidal on
which along with the straight coastal area, the mangrove growth in relatively
narrow, 25 to 50 m, while in the deltas where the river flows bring some
materials, such as mud and sands, the mangrove can growth very well and spread
out widely throughout the coast. Basically, the zonation in mangrove forest is
grouped naturally based topographical condition, tidal frequency, stability,
sedimentation, water/soil salinity, etc (Moosa et al, 1996)
2.1.2. Coral Reef Ecosystem
Coral reef is specific habitat that provides shelter, food and breeding sites
for numerous plants and animals. Coral reef development occurs only in areas
with specific environmental characteristic: a solid structure for the base; warm and
phosphate and nitrogen nutrients, and moderate wave action to disperse wastes
and bring oxygen and plankton to the reef (Halili, 2001).
Physically, coral reef is important material for protecting an island. In
some conditions, coral reef can protect coastal such as erosion hazard, current and
wave. For biological resources, coral reef ecosystem can generate many kinds of
species such as fish, alga, mollusks, pearl, etc. Meanwhile, the role of coral reef
for aesthetics value, it is can offer beautiful view (Nontji, 1987).
2.1.3. Seagrass Ecosystem
Seagrass is an ecosystem that grows by marine flowering plants species
(called seagrass). This ecosystem is very important component of coastal
ecosystem along tropical, temperate and subartic coasts. It has already been found
on lowest seawater level until light sun penetrate depth. Seagrass ecosystem has a
very important role in coastal ecosystem because of its location between
mangrove and coral reef ecosystems, which has function to export important
nutrients to surrounding ecosystems.
The most important area for seagrass is the lower intertidal and upper
subtidal zone, where the complex vegetation may occur in which 7 – 8 species
grow together (Moosa et al, 1996). Furthermore, seagrass can interact with other ecosystems through several mechanisms. Seagrass beds are important to finfish
communities worldwide on which in the tropics, many nearshore and offshore
fisheries are closely linked to seagrass and to adjacent mangrove and coral reef as
well. And also provide major habitat and food sources for a large variety of
2.2. Coastal Region Master Zoning and Planning
Zone is a region that has similar characteristics of physic, biology,
ecology, and economic, that are determined by criteria selected (Haris, 2003).
Coastal and marine zoning are allocating some of coastal and marine regions that
have similar characteristics and requirements into suitability zones for its purpose,
so protection or uses of coastal and marine regions can be controlled. This zoning
is created to make harmonious space, meaning that coastal and marine regions
should not be for development area only, but also should provide zone for
preservation and conservation.
Coastal and marine zones must focus and consider some aspects;
suitability area to support productivity or behavior of life; government policy
related with land authority and development priority; current land-use pattern,
that means allocating legal land-use or existing of traditional pattern; and local culture. Therefore coastal and marine zoning needs to identify regions that have similar characteristics and requirements of its uses to determine sustainable
natural resources management planning.
The making of coastal and marine zones is one of alternatives to achieve
sustainable coastal and marine management by divided coastal land-uses in to
some zones, such as: preservation zone, there are no exploration activities except research, but still possible to developed by observing sustainable development
requirements (Odum, 1989). Buffer/ cultivation zone, is a zone decided as main function for cultivation of natural resources, human, and artificial resources
potencies. That region part has cultivation function (dominated by settlement and
1993). Uses zone, every activities can be performed by considering of the spatial rules to avoid overlaying between activities and coastal and marine development.
Arranging and management of coastal and marine space that followed by
government rules.
Based on coastal zone classification that has already been done by
Soedharma et al (1992), this research will divide coastal and marine zones into 4 parts, they are: preservation zone, conservation, buffer/ cultivation zone, and uses
zone (related with suitability zone), which distribution of zone based on output
map scale (1 : 50.000).
Master plan is physical environment in one region that has functional
relationship with some space elements that include natural resources, artificial
resources, human with their activities such as: politic, economic, socio-culture and
safety and defense aspects (Kartasasmita, 1996).
Coastal master plan can be performed by classifying land uses into
homogenous units considering similarity of physic, biotic, socio, culture,
economic, defense and safety ascpects (Dahuri et al, 1996). Coastal master planning have been attempted optimally and efficiently for space arrangement for
human life, such as; local sector development, and society to achieve prosperous
collectively (Martopo, 1987).
Master plan on coastal ecosystem is more complex than master plan on the
land, because (a) it should consider all aspects that interact each other both in land
and marine ecosystems, (b) marine and land aspects are unable to be separated
physically, because both ecosystems interact each other, (c) Landform
land ecosystem, as it is a dynamic interaction between land and marine (Dahuri,
1997).
2.3. Developmentof Marine and Coastal Resources
Generally, existing coastal natural resources are divided into renewable resources, un-renewable resources, and environmental resources. Renewable resources consist of fish, plankton, seaweed, seagrass, mangrove, coral reef, etc.
While, unrenewable resources consist of oil, mining material (iron, sand, tin, and
other mining materials). Environmental resources consist of marine transportation
and tourism.
Darmawan (2000) argued that generally, coastal management is focused to
achieve 2 goals. Firstly, development of coastal natural resources optimally gives
contributions for national economic and prosperous marine developer. Secondly,
it is to maintain coastal and marine natural resources and sustainable environment.
Both goals can be achieved by a good coastal development planning as well as
imposing regulation and monitoring.
Integration of coastal planning and management is caused by existing of
(1) some conflicts of land uses, (2) importance conflicts among some government
and private institutions. These conflicts are caused by some factors, such as (a)
competition at coastal spaces, (b) effect from some developing activities toward
another activities (oil waste toward fishing activities), and (c) impact of
2.3.1. Marine Cultivation (Fishpond, Seaweed and Keramba Jaring Apung)
Coastal area can be divided in two main sub area based on its physical
characteristics. They are tidal area, which is usually dominated by mangrove and
fishpond, and beach land, which is located on higher elevation than tidal area.
Beach land is usually used for agriculture field, such as coconut plantation and
rice field (Purnomo 1998). This area has often been used for many kinds of
coastal activities such as marine cultivation, tourism and fishing activities.
One of national incomes comes from fishing subsectors. Recently, the
government has been developing some efforts to increase fish productivity
through fishpond cultivations. In Indonesia, fishpond cultivation have been known
long time ago in Indonesia, and more popular in 1980 – 1990 as marine
cultivation, which can be performed in traditional, semi intensive, and intensive
ways (Buwono, 1993).
There are some aspects that have to be considered in developing an area
for fishpond cultivation, such as its location from coastline as well as from river,
the slope, soil type and landform. Bakosurtanal (National Coordinating Agency
for Surveys and Mapping) has developed some requirement for suitable area for
fishpond cultivation as can be seen in Table 2.1.
In Indonesia, seaweed cultivation has been introduced by the European.
Seaweed is a commercial name of algae species that is harvested from marine,
(Nontji, 1993). There are many uses of this cultivation, such as: organic fertilizer,
standard material of food and cosmetic, and medicine. Seaweed that has high
Table 2.1. Matrix of suitability for Fishpond Cultivation
Categorize and scoring No Variable weighting
S1 (Highly Suitable)
Score S2 (Suitable)
Score S3 (marginally
Suitable)
Score N (Not Suitable)
Score
1. Distance from coastline (km)
4 0 – 5 4 > 5 – 6 3 > 6 – 7 2 > 7 1
2. Distance from river (m)
3 0 – 500 4 > 500 – 800 3 > 800 – 1100 2 > 1100 1
3. Slope (%) 4 0 – 2 4 > 2 – 3 3 - 2 > 3% 1 4. Litho logy 4 Qac 4 Temt 3 Tme 2 Tmet, Tmcv 1 5. Soil type 4 Entisol,
inceptisol 4 Entisol, inceptisol 3 Entisol, inceptisol, Ultisol
2 Oxisol 1
6. Landform 3 F7, F11, M4, M10, M14
4 F5, F12, F13 3 D4, K3 2 D1, D3, D2, D15, S1, S2,
V15 1
7. Land use 3 A 4 B 3 2 C 1
Source: Bakosurtanal, 2004
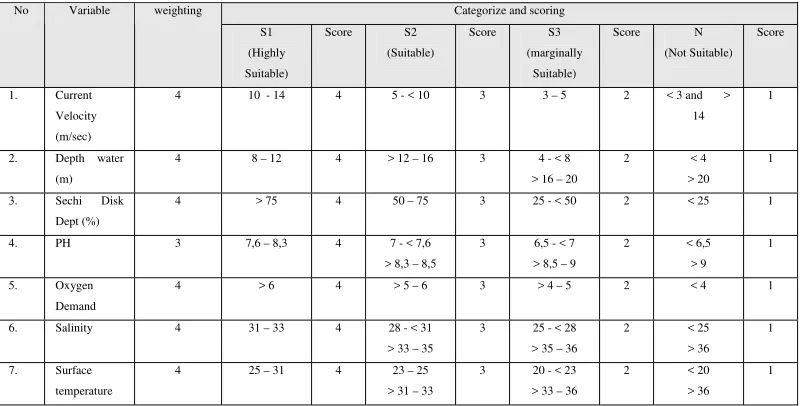
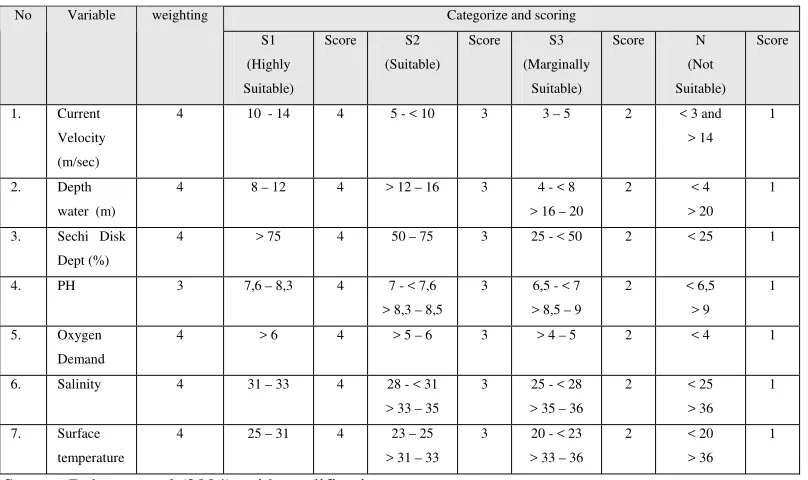
To obtain optimal seaweed productivity location should be selected that is
suitable with its eco-biology (grown requirements). More detail about seaweed
growth requirements can be seen in Table 2.2.
Fish cultivation can be also performed by traditional method, namely
keramba jaring apung, which has been developed long time ago in Indonesia. It is
one of the cultivation techniques being developed to avoid coral reef disturbance
(Subandar, 2003).
Table 2.2. Matrix of suitability for Seaweed Cultivation
Categorize and scoring No Variable weighting
S1 (Highly Suitable)
Score S2 (Suitable)
Score S3 (marginally
Suitable)
Score N (Not Suitable)
Score
1. Current Velocity (m/sec)
4 10 - 14 4 5 - < 10 3 3 – 5 2 < 3 and > 14
1
2. Depth water (m)
4 8 – 12 4 > 12 – 16 3 4 - < 8 > 16 – 20
2 < 4 > 20
1
3. Sechi Disk Dept (%)
4 > 75 4 50 – 75 3 25 - < 50 2 < 25 1
4. PH 3 7,6 – 8,3 4 7 - < 7,6 > 8,3 – 8,5
3 6,5 - < 7 > 8,5 – 9
2 < 6,5 > 9
1
5. Oxygen Demand
4 > 6 4 > 5 – 6 3 > 4 – 5 2 < 4 1
6. Salinity 4 31 – 33 4 28 - < 31 > 33 – 35
3 25 - < 28 > 35 – 36
2 < 25 > 36
1
7. Surface temperature
4 25 – 31 4 23 – 25 > 31 – 33
3 20 - < 23 > 33 – 36
2 < 20 > 36
1
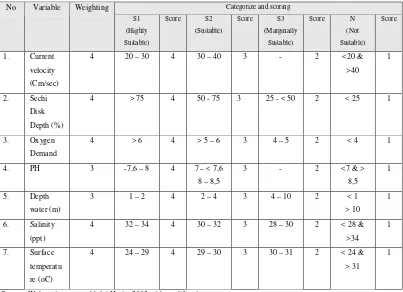
One example for determining appropriate location of “keramba jaring
apung” have been done by MCMA (Marine Coastal of Management Area)
surveys team in South Sulawesi (1995) in which “keramba jarring apung” can be
found both in southern and western of South Sulawesi.
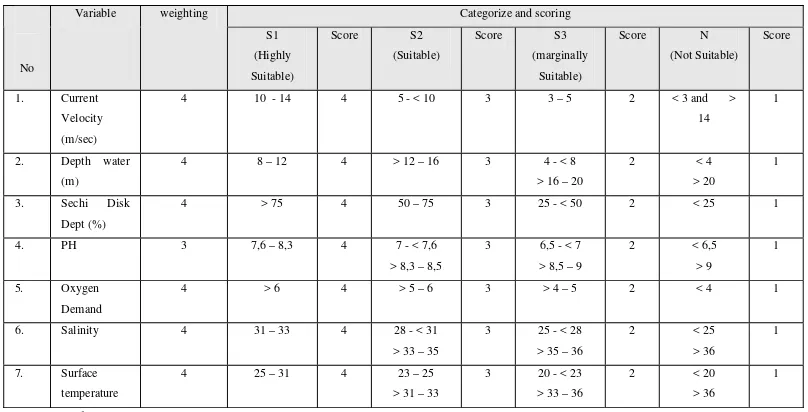
Selected location for “keramba jaring apung” must follow environment
criteria for cultivation, which will determine cultivation successfulness. Some
requirements such as current velocity, depth water, PH, oxygen demand, salinity
and temperature should fulfill the requirements for “keramba jaring apung”. More
details about the requirement for “keramba jaring apung” developed by
[image:38.595.110.514.386.592.2]Bakosurtanal are shown in Table 2.3.
Table 2.3. Matrix for suitability of Keramba Jaring Apung (kajapung)
Categorize and scoring
No
Variable weighting
S1 (Highly Suitable)
Score S2 (Suitable)
Score S3 (marginally
Suitable)
Score N (Not Suitable)
Score
1. Current Velocity (m/sec)
4 10 - 14 4 5 - < 10 3 3 – 5 2 < 3 and > 14
1
2. Depth water (m)
4 8 – 12 4 > 12 – 16 3 4 - < 8 > 16 – 20
2 < 4 > 20
1
3. Sechi Disk Dept (%)
4 > 75 4 50 – 75 3 25 - < 50 2 < 25 1
4. PH 3 7,6 – 8,3 4 7 - < 7,6 > 8,3 – 8,5
3 6,5 - < 7 > 8,5 – 9
2 < 6,5 > 9
1
5. Oxygen Demand
4 > 6 4 > 5 – 6 3 > 4 – 5 2 < 4 1
6. Salinity 4 31 – 33 4 28 - < 31 > 33 – 35
3 25 - < 28 > 35 – 36
2 < 25 > 36
1
7. Surface temperature
4 25 – 31 4 23 – 25 > 31 – 33
3 20 - < 23 > 33 – 36
2 < 20 > 36
1
Source : Bakosurtanal, 2004
2.3.2. Fishing Resources Potencies
The health of fish is affected by variations and extremes in the
characteristics of the water, in which they live, such as PH, salinity, tidal wave,
According to Nybaken (1992), about 90 % of the world’s fisheries
products come from the sea area (2 – 3 %), most of them identified as upwelling
areas. Fishing activities do not require specifically the criteria of determining land
suitability area. In fact, most marine areas can be used for fishing activities area.
This is the last alternative to be done.
2.3.3. Tourism Potencies
Basically, marine tourism development is aimed at using marine objects
such as coastal natural resources, flora and fauna diversity to increase local
advantages. Some of areas in Maros has good coastal landform and high natural
resources potencies. Therefore, this area is able to be a product of marine tourism
development. Kusumastanto (2002) states some of marine tourism products can
be developed in coastal areas such as; beach, business, resort, sport and culture
tourisms.
Tourism development will bring direct effect to local people and
government. The goal of tourism development is to promote an environmental
friendly business and to generate local income. Such development must also
protect cultural values and the rights of local people.
2.4. Remote Sensing
Remote sensing is the science and art to obtain information about object,
area or phenomenon through the analysis of data acquired by a device without
contact with the object, area, or phenomenon under investigation (Lilesand and
interaction between electromagnetic radiation and the objects within various
ranges of spectrum or bands depending on the sensors (Dowreand and
Disbunchong1992).
The reasons for the increase of the use of remote sensing are that remote
sensing image represent objects, phenomenon in surface of the earth with (1)
shape and location of objects similar with earth surface, (2) completely, (3) large
area coverage, (4) permanent (Sutanto, 1986). These reasons may be implemented
in some sectors, such as hydrology, oceanography, geography, biology, forestry
and agriculture, and also for coastal and marine management.
Landsat TM is one type of remote sensing imagery that is often used for
natural resources inventory. Landsat TM have many spectral that makes easier to
identify objects in earth surface, hence this type of images has often been used for
natural resources inventory. More details about Landsat TM spectral
electromagnetic can be seen in Table 2.4
Table 2.4. Landsat TM Spectral electromagnetic
Channel Wave Length (μm) Spatial Resolution (m) Spectrum Name
1 0,45 – 0,52 30 Blue
2 0,52 – 0,60 30 Green
3 0,63 – 0,690 30 Red
4 0,76 – 0,90 30 Near Infrared
5 1,55 – 1,75 30 Middle Infrared I
6 10,40 – 12,50 120 Thermal Infrared
7 2,08 – 2,35 30 Middle Infrared II
For the application of Landsat TM remote sensing algorithms to coastal
parameters and surrounding surface materials. An understanding of the properties
of marine and coastal materials and their interaction to produce a complex signal
on the satellite sensor is required to properly analyze the processed imagery.
Every channel on Landsat TM has particular functions, hence it can be
implemented to some aspects (Mika, 1997). Application of channels is shown in
Table 2.5.
Table 2.5. Landast TM electromagnetic for specific application
Channel Application
1 Vegetation and soil differentiation, clean water bathymetry
2 Indication of vegetation fertility, sedimentation, dirty water bathymetry 3 Vegetation classification, snow and ice mapping
4 Biomass, and water body boundary
5. Vegetation water content, snow and cloud differentiation 6 Thermal, settlement, and non settlement mapping 7 Hydrothermal, geology and soil type differentiation
One way of easier identification process is making composite image to
derive new image. From composite image, object view may produce more
contrast and be easier to be identified. Basically, image- processing principal is
arranging picture on digital image including spatial and spectral aspects.
Therefore, this image is divided into 2 spaces; they are spatial and spectral
aspects. Spatial is three (3) dimentional space that are represented by coordinate
(x, y, and z), while spectral shows spectral value distribution in every channel
inside coordinate (Danoedoro, 1996).
Through spectral space, characteristics of an object can be known and
differentiated from the other objects. Characteristic of identification of object is
called image interpretation. Identification includes the following characteristics
characteristics, spectral is the main identification characteristic; it means that other
characteristics can be known after knowing the spectral characteristic.
2.5. Geographic Information System (GIS)
Geographic Information System (GIS) is a set of tools that are used for
compiling, storing, manipulating, updating, analyze, and present is all data to be
spatial information (ESRI, 1990). Related with this meaning, this system has four
(4) main capabilities to handle geographic reference data, they are: data entry,
data management, data manipulate and analyze, and data output (Arronoff, 1989).
GIS is one information system used to working with spatial reference data
or geographic coordinate (Star and Ester 1990). In other words, GIS is a system of
database with specific capability for spatial reference data with a set of working
operation.
The advantage of GIS if compared with other database processing systems
is its capability to display spatial and non-spatial information at the same time.
For example; land-use data will be able to be presented within polygons boundary
(spatial information) and attributes that contain information of polygon
(non-spatial information). Information with different themes is represented into
different layer. SIG tries to make simple real earth phenomenon, and it is expected
to represent real condition for one particular application. (Haris, 2003).
In GIS, data storage is divided into 2 parts, they are: spatial and attribute
data. For analysis need, spatial and attribute data will be stored separately, and
then both will be integrated (Macguire and Goodchild, 1991). Occasionally, some
for implementation particularly goal.
GIS must follow some rules (Arronoff, 1989): (1) involving concept and
geographic data that have relationship with spatial distribution, (2) information
from data analyzed and related with decision making goal, (3) a system that
include data entry, processing, and data output, (4) three components above are
functioned based on high technology. More details about illustration of data
management processing using GIS is shown in Fig 2.2.
Map
Table Field Survey Digital Data Remote sensing Data
GIS Analysis
INPUT GIS OUTPUT
Textual Report Map Photography
Statistic and Table Data for other GIS Digital Data Base
DATABASE PROCESSING Capture Code Edit Store and finding Display and report Manipulate and analysis
Fig 2.2. System Diagram for GIS illustration (Meaden and Kapetsky, 1991)
Generally, data sources requirement for GIS analysis process can be
divided into 3 categories (Khairul Jamil 2005), they are (1) Field data, (2) Map
data, which information has been recorded on paper or film that are converted into
digital format, and (3) Remote sensing involves airborne photo and satellite
imagery.
The process from data input become data output is a connecting structure
that is started from real world and recorded on image and airborne photo, then by
GIS facility, data are stored and processed to generate output that will be used for
Procedure of GIS working system is organizing hardware, software, and
geographic data to optimize the system of storing, manipulating, analysis and
displaying all geographic information. Attribute and spatial data have relationship
with space aspect-location that is presented as database on a map. To acquire
spatial analysis result overlaying techniques from some thematic maps (vector or
raster) are used. New spatial information is acquired based on new digital value
that constitutes an integration of old digital value.
2.6. The Role of GIS and Remote Sensing for Coastal Management
There are many data that can be used for GIS data input as well as
thematic maps that are available on analog picture, recording imagery from
airborne photo and satellite, field survey data, and map that have already recorded
as digital data. Those data are useful for GIS data input that will be analyzed for
further study such as for suitability area study, land-use changing, and natural
resources distribution.
GIS has been used for land-use management, such as: agriculture, forestry,
and military. Many kinds of spatial analyses have been done using GIS, including
coastal and marine management. For coastal and marine management cases, GIS
can be implemented for arranging coastal master plan, like: predicting tourism and
fishing potencies, and determining and developing aquaculture zones in coastal
ecosystem (Purwadhi, 1993).
Characteristics and potencies data of coastal region can be represented
better by using GIS, it is caused that GIS can integrate some data and maps
used for some interesting in planning and decision-making on coastal master plan.
GIS for coastal resources management can be used to display spatial
databases that are related to some problems: (1) coastal physical database
including bathymetry/topography, morphology, land cover, sedimentation, erosion
and deposition, climate, habitat boundary, etc, and (2) human-social coverage, a
database that includes administrative boundary, population distribution,
transportation, and any other human-social characteristics. GIS database is used
for coastal and marine resources management for (a) knowing natural resources
exploitation level (b) meeting variation human needs, and (c) keep existing coastal
ecosystem (Gunawan, 2000).
Generally, the advantages of using GIS for natural resources planning and
management are (1) integration data from any other data format (graphic, text,
analog and digital) (2) good data exchange from any knowledge (3) efficient and
effective processing and analyzing (4) modeling and comparing some alternative
of activities before being applied in field (5) efficient in data updating, especially
graphical model, (6) accommodate large data volume (Dahuri, 1997)
GIS has great contribution for coastal ecosystem management (1) it is
helpful to facility some sectors, private and local government that plan something
to mapping and integration of optimal options management and alternative
planning. Planning sectors are expected to be able to select what activities
reasonable to perform. (2) As a tool that is used to support coastal resources
management with environmental knowledge. Using GIS, it is easy and faster to
perform spatial analysis and monitoring toward coastal ecosystem changing
2.7. Land Suitability Analysis
Land suitability analysis is an interdisciplinary approach by including the
information from different domains like soil science, crop science, meteorology,
social science, economics and management. Being interdisciplinary, land
suitability analysis deals with information, which is measured in different scales
like ordinal, nominal, and ratio scale.
The process of land suitability classification is the evaluation and grouping
of specific areas of land in terms of their suitability for a defined use. The main
objective of the land suitability is the prediction//evaluation of the inherent
capacity of a land unit to support a specific land use for a long period of time
without deterioration, in order to minimize the socio-economic and environmental
costs (Prakash T.N 2003).
As mentioned earlier, determining suitable land for a particular use is a
complex process involving multiple decisions that may relate to biophysical,
socio-economic and institutional/organizational aspects. Therefore, a structured
and consistent approach to Land Suitability Analysis (LSA) is essential to decide
the success of coastal development planning.
2.8. Multi Criteria Decision Making (MCDM)
There are many criteria upon which land suitability depends. The
suitability analysis evaluates many alternative land use types under the light of
various criteria from various streams. Alternatives here are competing with one
another; criteria are both qualitative and quantitative.
Evaluation/Analysis) and GIS can be integrated (Jankowski 1995). MCE seems to be applicable in GIS-based land suitability analysis (Pereira and Duckstein 1993)
for different coastal land uses.
MCDM methods deal with real world problems that are multi dimensional
in nature. When it comes to environmental issue the methods have to deal with
heterogeneous criteria that are both qualitative and quantitative in nature. In order
to incorporate heterogeneous information with different measurement scales, one
has to bring them into a common domain of measurement. This process is called
Standardization, a basic operation in MCE. Criteria should be standardized keeping in mind the goal and alternatives that are under evaluation.
Standardization can change the outputs entirely if proper attention is not paid. For
environmental criteria, there is a lack of valid and reliable standardization
processes.
Decision-making is a subjective process, as the perception regarding a
problem can diverge from person to person. One cannot expect a decision maker
or an expert to be highly consistent while dealing with such a subjective process.
The real world problems are influenced by many natural factors and processes that
are difficult to measure and model precisely. After the problem is evaluated for
optimum conditions, sensitivity analysis assesses different conditions near the
optimum values to check for the sensitivity of the criteria. Many decision-making
methods lack a valid approach towards sensitivity analysis. Sensitivity analysis
also aids in understanding the interaction between the criteria, dominant criterion
and its effect, i.e. the variation in the final results when the weight of that criterion
2.9. Framework of Decision-Making and SMCDM
In the early time the use of remote sensing and GIS was confined only for
the process of mapping. In time progress the information technology develops
tools to use these maps in the process of planning and decision-making.
Sustainable management means the utilization of the available land resources in
such a way that the occupation, which is conducted over a piece of land, is
without or with least impact over the resources. For the sustainable use of the
land, the area needs to be used for a specific purpose, which suits the local
conditions best.
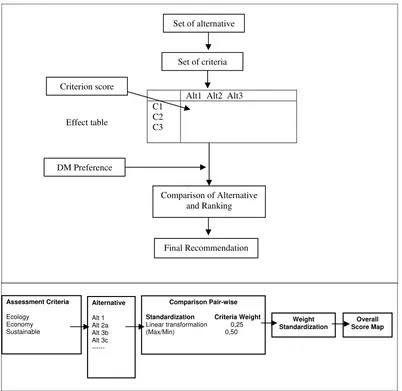
Spatial multi-criteria decision-making (MCDM) is a process where
geographical data are combined and transformed into a decision. Multi-criteria
decision-making involves input data, the decision maker’s preferences and
manipulation of both information using specified decision rules. In spatial
MCDM, the input data are geographical data. Spatial MCDM is more complex
and difficult in contrast to conventional MCDM, as large numbers of factors need
to be identified and considered, with high correlated relationships among the
factors a spatial decision problem is the difference between the desired state in a
geographical system and an existing state in real world (Malczewski 1999).
Spatial MCDM aims at achieving solutions for spatial decision problems,
derived from multiple criteria. These criteria, also called attribute, must be
identified carefully to arrive at the objectives and final goal. The performance of
an objective is measured with the help of these attributes. These evaluation criteria
should be comprehensive and measurable.
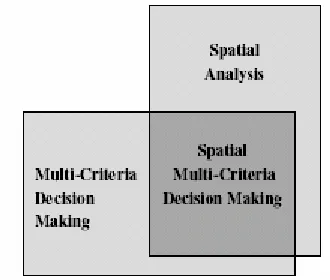
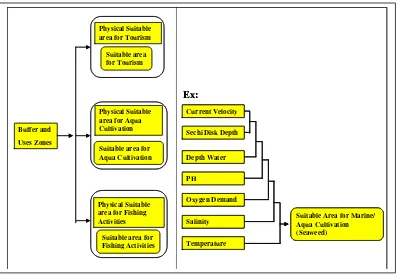
suitability evaluation demands for visualization of the impact of the alternatives
and criteria in the form of maps. This demands for visualization in the form of
maps. This demand can be accomplished effectively by the integration of spatial
analysis and conventional multi-criteria evaluation techniques, as shown in Fig
2.3. Moreover, environmental decision problems are characterized of having
multiple and often conflicting objectives. When evaluating such a complex
phenomenon, the spatial dimension seems to be the big hurdle. Here, the
[image:49.595.227.392.334.474.2]integration of GIS and MCDM techniques becomes useful (Prakash, 2003).
III. METHODOLOGY
3.1. Time and Location
This research was conducted from January until May 2006 in Maros. The
study area is located in South Sulawesi, Indonesia, approximately between 4° 45’
- 5° South and 119° 21’ - 119° 42’ 30’’ East.
Research Area
Fig3.1. Maros Location
3.2. Equipment And Data Requirement 3.2.1. Data Collection
The types of data needed for this research were:
a. Primary Data
Landsat TM is to extraction of land physical characteristic data and coastal
identification to determining of coastal zones.
b. Secondary Data
Physical Social/ Economic
- Topographic Map - Salinity
- Brightness of water - Current Velocity - Depth of Sea - Population - Sechi Disk Depth - Sea Surface Temperature - DO, PH
Demography (Agriculture and fishing productivity)
c. Other Data
Necessary data as well as map related with this study is needed, such as:
- Topographic map (1 : 50.000 scale, Maros region) as base map to plotting
criteria and data.
- Administrative map for determining administrative boundary.
3.2.2. Hardware, Software and Equipment Used
The following application software, hardware were used for the overall processes
in this study.
Table 3.1. List of hardware, software and equipment. PC Pentium IV 1,8 GHZ, 256
MB
For software running and reporting Hardware
Canon I - 255 For printing
Arc/View 3.3 version For spatial data processing and analyzing
PC Arc/Info 3.5 version For spatial data processing and analyzing
ER Mapper 6.4 version For raster data processing
Ilwiss For raster and tabular data processing Definite Multi criteria analyzing
Excel Tabular data analyzing Software
MS Word Report
3.3. Framework of Research
3.3.1. Framework of Coastal Ecosystem Development Decision Making
The decision-making problem of land suitability analysis for coastal
ecosystem development/ coastal land use planning is analyzed using integration of
remote sensing, GIS and MCDM. Fig 3.2 depicts the conceptual flow of the
research approach completely.
3.3.2. DataCompilation
Data used for this research are primary and secondary data. Primary data
was derived from remote sensing imagery (Landsat TM), while secondary data
was derived from field check and some institutions. Compiling data is needed to
recognize research location and to build model of coastal landuse development
planning.
3.3.3. Image Preprocessing
For acquiring better geometric and radiometric aspects from Landsat TM
imagery, geometric and radiometric corrections should be accomplished. It is the
first step prior to analysis of the remotely sensed data that is to remove errors.
Geometric correction is a replacing pixel position as truly condition.
Geometric correction that is commonly used to make digital remote sensor data
truly useful is geometric rectification. It is a process using Ground Control Point
(GCPs), which are selected transf