Australian Journal of Basic and Applied Sciences
ISSN:1991-8178Journal home page: www.ajbasweb.com
Corresponding Author: Mohamad FaniSulaima, UniversitiTeknikal Malaysia Melaka, Faculty of Electrical
Engineering,76100, Hang Tuah Jaya, Malacca, Malaysia. Ph: (+606) 5552218. E-mail: [email protected]
A Feasibility Study of Internal and External Based System for Pipeline Leak Detection
in Upstream Petroleum Industry
1Mohamad FaniSulaima,2Faizal Abdullah,1Mohd Hafiz Jali, 1W.M. Bukhari, 1M.N.M. Nasir, 1M.F. Baharom
1
UniversitiTeknikal Malaysia Melaka, Faculty of Electrical Engineering, Hang Tuah Jaya, Malacca, Malaysia 2Exxonmobil Exploration & Production Malaysia, Kuala Lumpur, Malaysia
A R T I C L E I N F O A B S T R A C T Article history:
Received 25 January 2014 Received in revised form 8 March 2014
Accepted 10 March 2014 Available online 2 April 2014 Keywords:
pipeline leak detection system;external based system;internal based system
Offshore underwater pipelines leaks begin at poor joints, corrosions and cracks and slowly progress to a major leakage. Accidents, terror, sabotage, or theft are some of human factor of pipeline leak. The primary purpose of Pipeline Leak Detection Systems (PLDS) is to assist pipeline managers in detecting and locating leaks earlier. PLDS provides an alarm and display other related data to the pipeline engineers for their decision-making. It is also beneficial because of PLDS can enhance their productivity by reduced downtime and inspection time. PLDS can be divided into internally base PLDS and external hardware base PLDS. The purpose of this paper is to study the various types of leak detection systems based on internal and externally system simultaneously.Meanwhile to define a set of key criteria for evaluating the characteristics of this system and provide an evaluation method of leak detection technology as a guideline of choosing the appropriate system in the future.
© 2014 AENSI Publisher All rights reserved. ToCite ThisArticle:Mohamad FaniSulaima, Faizal Abdullah, Mohd Hafiz Jali, W.M. Bukhari, M.N.M. Nasir,M.F. Baharom., A Feasibility Study of Internal and External Based System for Pipeline Leak Detection in Upstream Petroleum Industry. Aust. J. Basic & Appl. Sci., 8(3): 204-210, 2014
INTRODUCTION
Most of the fluids transported by pipelines are hazardous. This will impact on the human safety, pollution on the environment and the production lost. Recent pipeline leak incidents have shown that the cost is much more than the associated downtime and clean-up expenses led to increasing awareness and concern for the environment. An effective and proper implementation of pipeline leak detection system will reduced spill volume and increased public confidence (Sandberg, C., 1989). There are a numbers of oil spills issue that cause significant damage to the environment ecosystems, property, human life and very high financial loses. Leaks may occur because of many reasons; fatigue cracks, stress corrosion, hydrogen induction and ruptures (Harrold, D., 1998).
Pipeline leak detection technologies can be categorized based on a variety of criteria. They vary from human visual inspections to hardware based sensors and the control systems based to real-time monitoring. Each approach has its strengths and weaknesses. The operational principle, data and equipment requirements, strengths, weaknesses, and the realistic performance limits (size, response time, location, false alarm, etc.) for the leak detection methods are addressed in this paper. Pipeline leak detection systems are varied and uniquely designed for each pipeline application. However, for discussion purposes, leak detection technologies can be classified according to the physical principles involved in the leak detection. Using this type of classification, general categories of leak detection technologies can be divided into the following two groups: Internally Based System (IBS) and Externally Based System (EBS) based on (API 1130, 2007) and (PTS 31.40.60.1). In this paper, categorize of Computational Pipeline Monitoring (CPM) and review of EBS for PLDS method will be discussed in the next topic accordingly. The results of the study for IBS and EBS will be presented in results and discussion section. Meanwhile the conclusion will be in the last section of this paper.
Internal Based System:
collected from the field instruments, which are continuously input into a computer program that mathematically or statistically analyses the information. Analysis results are produced in the form of parameter estimates, which in turn are subjected to some decision criteria to determine if a leak is present (API, 1130). The classes of (CPM) are differentiated by the types of instruments and programs (or algorithms) used.
Based on (Geiger, G., 2002), the Mass Balance Method is based on equation of conservation of mass. This technique identifies an imbalance between the incoming (receipt) and outgoing (delivery) volumes of mass. The volumes of product entering and leaving a pipeline are measured over a specified time period. The measurement results are expressed in terms of standardized volumes. The outgoing mass is subtracted from the incoming mass over the time period. A leak is suspected if the difference exceeds a threshold value. According to (Diane J. Hovey, 2002), the Pressure Point-Analysis (PPA) leak detection method is part of the pressure/flow monitoring method, which is based upon the statistical properties of a series of pressure or velocity pipeline measurements at one point being different before and after a leak occurs. The PPA method detects leaks by monitoring pipeline pressure at a single point along the line and comparing it against a running statistical trend constructed from previous pressure measurements contains evidence of a leak.
A sudden leak causes pipeline damage due to carelessly use of equipment, leads to negative pressure wave propagating at the speed of sound to both direction through the pipeline. Such a wave can be recognized using installed high-sensitivity pressure transmitter, giving a leak alarm. It is also possible to calculate the leak location by timing interval of the pressure wave at two or more points on the pipeline. The technique called Wave Propagation method as reported in (Lijing Dong, 2011). The leak position can be located if the moment T Downstream and T Upstream, when this negative wave passes the transmitter is measured.
In (Zhang, X.J., 1993), an optimum sequential analysis technique (Sequential Probability Ratio Test) is applied to detect changes in the overall behavior of the inlet and outlet flow and pressure. It works based on the observation that although the control and operation may vary from one pipeline to another, the relationship between the pipeline pressure and flow will always change after a leak develops in a pipeline.
External Based System:
In order to reflect changes in transmitted energy pulses as a result of impedance, liquid sensing cables are clamped to the pipeline and are specifically designed to differentials induced by contact with hydrocarbon liquids. Microprocessor continuously sent safe energy pulses through the cable. The pulses are reflected and returned to the microprocessor. Based on the specific installation of the cable, a baseline reflection map is stored in the memory of the microprocessor. When a leak occurs, the cable is saturated with fluid. The fluid alters the impedance of the sensing cable, which in turn alters the reflection pattern returning to the microprocessor. The change in signal pattern causes the microprocessor to register a leak alarm at the location of the altered impedance. Controller interface software is available to provide real-time information on leak detection and record keeping. Specific cable types are chosen for each application based on the specific fluid being monitored. Sensornet Technology UK (Information on www.sensornet.co.uk) and (Großwig, S., et al., 2001) introduced distributed fiber optic sensing technique. Fiber optic is one of the promising leak detection technologies. Fiber optic sensors can be installed as distributed sensor. The cables will be attached and clamped to the pipeline, and utilize Distributed Temperature Sensor (DTS) method to detect the leaks. The DTS illuminates the glass core of the optical fiber with a laser pulse of 10 nanosecond duration (this corresponds to a 1m pulse.) As the optical pulse propagates down the fiber, it undergoes scattering even in the absence of impurities and structural defects. Fiber optic is covered by a coating or cladding that is chemically reactive to hydrocarbons. When the coating or cladding contacts with hydrocarbon, the DTS refractive index is altered and affects the transmission of light through the fiber optic cable. The DTS System measures the changes in reflected light against time. Therefore in order to define the performance of the system, temperature resolution, spatial resolution, range and measurement time should also be calculated.
The vapor sensing tube leak detection method involves the installation of a secondary conduit along the entire length of the pipeline. The conduit may be a small-diameter perforated tube or sensor tube attached to the pipeline. Air gas samples are drawn into the tube and analyzed by hydrocarbon vapor sensors to determine the presence of a leak. The vapor sensing detection system is installed at the base station. Only the sensor tube needs to be installed along the pipeline. Refer to Acoustic SystemInc. (Information on www.wavealert.com) technology information, leak detection in pipelines using acoustic emissions technology is based on the principle that escaping liquid creates an acoustic signal as it passes through a perforation in the pipe. Acoustic sensors affixed to the outside of the pipe monitor internal pipeline noise levels and locations. These data are
used to create a baseline “acoustic map” of the line. When a leak occurs, the resulting low frequency acoustic
Key Consideration of Evaluation:
A leak detection system is unique and depends on the pipeline locations, condition, types of fluids, pipeline size, length, operating parameters and instrumentation design. Key considerations criteria can be divided into two categories which is Primary and Secondary Considerations as shown in Table 1.
Table 1:Primary and Secondary consideration.
Primary Considerations Secondary Considerations
• Sensitivity (Time of Detection)
• Accuracy of Overall PLDS System
• Reliability (False Declaration or False Alarm)
• Robustness (Loss of Signal)
• Leak Location Capability
• Cost
• Leak Size
• Response Time
• Operational Ease of Use /Complexity
• Maintainability
• Maintenance Support
Scoring Matrix for Technology Evaluation:
Data and information for each technology can be quantified by translate to a rating form as shown in the next section. Through concept scoring a more detailed analyses and finer quantitative evaluation of the remaining concepts using the scoring matrix as a guide. Rating for each criteria will be marked as 5-Very High, 4-High, 3-Moderate, 2-Low, 1-Very Low and0-None. For better evaluation result, each criterion is weighted (represent by W. in the table) to different point base on priority and key criteria. This precise, measurable and quantifiable detail will determine the best technology. The best technology shall score highest rating in this technology evaluation.
RESULTS AND DISCUSSION
Internal Based System:
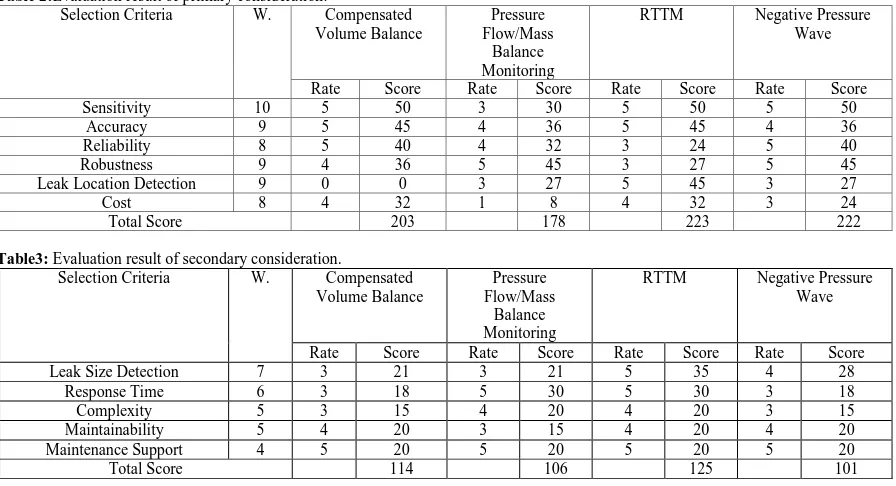
The Table 2 and Table 3 represent the evaluation results of the primary and secondry consideration accordingly. Meanwhile, the Table 4shows how the data point for Table 2 and Table 3 is evaluatedfor theinternally based system. Four systems are being considered which are compensated volume balance, pressure flow or mass balace monitoring, RTTM and negetive pressure wave. The evaluation data is got from the various PLDS„s vendors around the world.
Table 2:Evaluation result of primary consideration.
Selection Criteria W. Compensated Volume Balance
Pressure Flow/Mass
Balance Monitoring
RTTM Negative Pressure Wave
Rate Score Rate Score Rate Score Rate Score
Sensitivity 10 5 50 3 30 5 50 5 50
Accuracy 9 5 45 4 36 5 45 4 36
Reliability 8 5 40 4 32 3 24 5 40
Robustness 9 4 36 5 45 3 27 5 45
Leak Location Detection 9 0 0 3 27 5 45 3 27
Cost 8 4 32 1 8 4 32 3 24
Total Score 203 178 223 222
Table3: Evaluation result of secondary consideration.
Selection Criteria W. Compensated Volume Balance
Pressure Flow/Mass
Balance Monitoring
RTTM Negative Pressure Wave
Rate Score Rate Score Rate Score Rate Score
Leak Size Detection 7 3 21 3 21 5 35 4 28
Response Time 6 3 18 5 30 5 30 3 18
Complexity 5 3 15 4 20 4 20 3 15
Maintainability 5 4 20 3 15 4 20 4 20
Maintenance Support 4 5 20 5 20 5 20 5 20
Total Score 114 106 125 101
External Based System:
consultancy by professional engineer. The key principle that has been considered is based on the real compulsory from the PLDS standard.
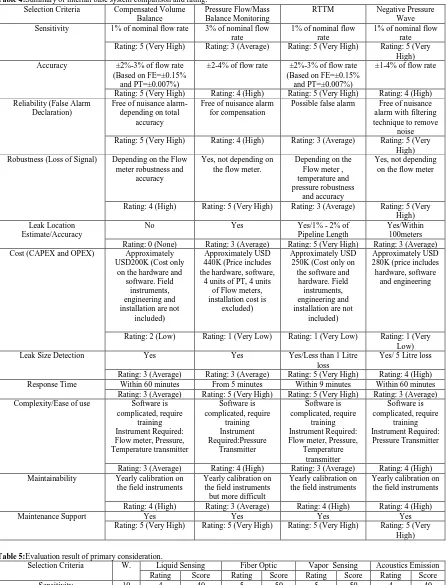
Table 4:Summary of internal base system comparison and rating. Selection Criteria Compensated Volume Sensitivity 1% of nominal flow rate 3% of nominal flow
rate
1% of nominal flow rate
1% of nominal flow rate Rating: 5 (Very High) Rating: 3 (Average) Rating: 5 (Very High) Rating: 5 (Very
High)
Possible false alarm Free of nuisance alarm with filtering technique to remove
noise Rating: 5 (Very High) Rating: 4 (High) Rating: 3 (Average) Rating: 5 (Very
High) Robustness (Loss of Signal) Depending on the Flow
meter robustness and
Rating: 4 (High) Rating: 5 (Very High) Rating: 3 (Average) Rating: 5 (Very High) Rating: 0 (None) Rating: 3 (Average) Rating: 5 (Very High) Rating: 3 (Average) Cost (CAPEX and OPEX) Approximately
USD200K (Cost only
Leak Size Detection Yes Yes Yes/Less than 1 Litre
loss
Yes/ 5 Litre loss Rating: 3 (Average) Rating: 3 (Average) Rating: 5 (Very High) Rating: 4 (High) Response Time Within 60 minutes From 5 minutes Within 9 minutes Within 60 minutes
Rating: 3 (Average) Rating: 5 (Very High) Rating: 5 (Very High) Rating: 3 (Average) Complexity/Ease of use Software is
complicated, require
Rating: 3 (Average) Rating: 4 (High) Rating: 3 (Average) Rating: 4 (High) Maintainability Yearly calibration on
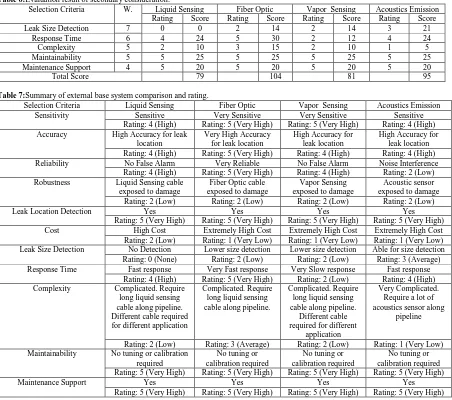
Table 5:Evaluation result of primary consideration.
Table 6:Evaluation result of secondary consideration.
Selection Criteria W. Liquid Sensing Fiber Optic Vapor Sensing Acoustics Emission Rating Score Rating Score Rating Score Rating Score
Table 7:Summary of external base system comparison and rating.
Selection Criteria Liquid Sensing Fiber Optic Vapor Sensing Acoustics Emission
Sensitivity Sensitive Very Sensitive Very Sensitive Sensitive
Rating: 4 (High) Rating: 5 (Very High) Rating: 5 (Very High) Rating: 4 (High) Accuracy High Accuracy for leak
location
Reliability No False Alarm Very Reliable No False Alarm Noise Interference
Rating: 4 (High) Rating: 5 (Very High) Rating: 4 (High) Rating: 2 (Low)
Rating: 5 (Very High) Rating: 5 (Very High) Rating: 5 (Very High) Rating: 5 (Very High) Cost High Cost Extremely High Cost Extremely High Cost Extremely High Cost Rating: 2 (Low) Rating: 1 (Very Low) Rating: 1 (Very Low) Rating: 1 (Very Low) Leak Size Detection No Detection Lower size detection Lower size detection Able for size detection Rating: 0 (None) Rating: 2 (Low) Rating: 2 (Low) Rating: 3 (Average) Response Time Fast response Very Fast response Very Slow response Fast response
Rating: 4 (High) Rating: 5 (Very High) Rating: 2 (Low) Rating: 4 (High) Maintainability No tuning or calibration
required Rating: 5 (Very High) Rating: 5 (Very High) Rating: 5 (Very High) Rating: 5 (Very High)
Maintenance Support Yes Yes Yes Yes
Rating: 5 (Very High) Rating: 5 (Very High) Rating: 5 (Very High) Rating: 5 (Very High)
Discussion:
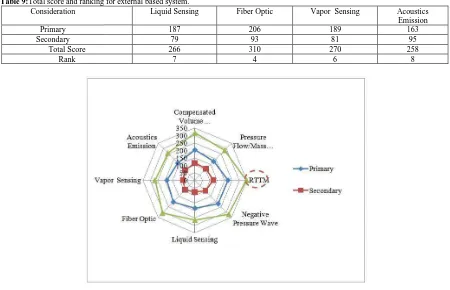
The best score for the external based PLDS technology is by using the RTTM as shown in Fig. 1. The
RTTM‟s score for primary consideration is 223 points and follows by negative pressure wave method is 222 points, fiber optic method is 206 points, compensated volume balance is 203 points, vapor sensing is 189 points, liquid sensing method is 187 points, pressure flow is 178 points and last with acoustics emission method scores 163 points accordingly. Nevertheless, in the secondary consideration, it can be seen that the score for RTTM method is still high if to be compared to others technology which is 125 points. The compensated volume balance method shows the good score in terms of good price in the marker which is total score approximately 114 points while is followed by pressure flow method (114 points) and negative pressure wave method (101 points).The scores for external based system are below than 100 points which is acoustics emission scores 93 points and shadowed by fiber optic method (93 points), vapor sensing (81 points) and liquid sensing (79 points) respectively. The Table 8 and Table 9 summarize the rank for all the consideration method of PLDS while the red doted rectangle shows the superior scores for RTTM internal based method. The details recommended design for RTTM will be discussed in the next sub-topic as well.
Table 9:Total score and ranking for external based system.
Consideration Liquid Sensing Fiber Optic Vapor Sensing Acoustics
Emission
Primary 187 206 189 163
Secondary 79 93 81 95
Total Score 266 310 270 258
Rank 7 4 6 8
Fig.1:Analysis of the total score for primary and secondary consideration.
Recommended Design:
According to the evaluation process, the best rate of PLDS method is RTTM (Real Time Transient Model). This method is widely accepted, provide sensitivity to detect small leaks, detect estimate location and low false alarm (if tuning and calibration is done properly). However, the sensitivity and accuracy of the flow meter
device depends on the characteristics of the fluid to be measured. Thus, this higher value of flow meter‟s
accuracy will decrease the PLDS overall system accuracy.
The architecture for the basic PLDS generally consist of three major elements: field instrumentation, a SCADA or RTU or PLC with associated software and telecommunications links. The sensors required for RTTM technique can be categorized as flow, pressure, and temperature. Flow meters are required at all inlets and outlets of the pipeline. The metering of flow is necessary as the fluid passes from one operator‟s domain to another, thus serves a dual purpose. Pressure and temperature sensors are required. Ideally these sensors should be distributed along the length of the pipe. The effectiveness of most of the PLDS software methods are depend on the sensitivity and accuracy of the field instrumentation especially the flow meter, thus it is critical to select the best performing flow meter. There appears a growing trend to utilize ultrasonic meter and coriolis mass meter for the crude oil metering application within oil and gas and petrochemical plants. Field instrumentation needs control system interface as a medium of data transfer such as PLC or RTU system. This is because RTTM pipeline leak detection system is software base computer station system which extracts and analyzes the field data (flow, pressure and temperature) from control system. The main PLDS system software usually is proposed to be sitting in a dedicated computer, located in control room. In order to transfer field data from a site to another site; for example, Platform Alpha to Platform Beta, telecommunication system is required. There are two types of telecommunication system commonly use for offshore upstream oil and gas industry, which are microwave/radio telecommunication system- microwave and fibre optic cable- fibre-optic communication. Thus, through the technology evaluation above, the conceptual design for pipeline leak detection system has been finalized with the recommendation of the RTTM design.
Conclusions:
reliability in the future. Combination of existing modeling with intelligent algorithm such as neural networks may offers better characteristic and more advantages. For future work, this project can be improve by using simulation and detail calculation for each technology to prove the data given by each manufacturer of the technology.
ACKNOWLEDGEMENT
The authors would like to thank theUniversitiTeknikal Malaysia Melaka andIr. Faizal Abdullah(P.Eng) for all the support given.
REFERENCES
API 1130: “Computational Pipeline Monitoring for Liquid Pipelines”, American Petroleum Institute, 2nd
Edition (September, 2007).
Diane J. Hovey, Edward J. Farmer, 2002. “Pressure Point Analysis Leak Detection Methodology,
Performance and Application”, EFA Technologies on AIChE Spring Meeting.
Feng Jian, Zhang Huaguang, 2004. “Oil Pipeline Leak Detection and Location Using Double Sensors
pressure Gradient Method”, IEEE Proceedings of the 5th World Congress on Intelligent Control and
Automation, 4: 3134-3137.
Geiger, G., D.Matko, Werner, 2002. “Leak Detection and Locating – A Survey”, (Pipeline Simulatrion Interest Group), PSIG 0301.
Großwig, S.,et al., 2001.“Distributed Fiber Optical Temperature Sensing Technique – A Variable Tool for
Monitoring Tasks”, Proceedings of the 8th International Symposium on Temperature and Thermal
Measurements in Industry and Science, June 19-21.
Harrold, D.,1998. “Do you know what's leaking?”, Control Engineering., 45(10): 81-82.
Information on www.sensornet.co.uk:Sensornet Group, Fibre Optic Digital Pipeline Leak Detection - Application Guide.
Information on www.wavealert.com:Acoustic Systems Incorporated: WaveAlert® VII Leak Detection System.
Lijing Dong, Senchun Chai, Baihai Zhang, 2011. “Leak Detection and Localization of Gas Pipeline System
Based on Wavelet Analysis”, IEEE 2nd International Conference on Intelligent Control and Information Processing, 1: 478-483.
PTS 31.40.60.1: “Pipeline Leak Detection System”, PETRONAS Technical Standard, (September, 2002).
Sandberg, C.,J.Holmes, K.McCoy, H.Koppitsch, 1989. “The application of a continuous leakdetectionsystem to pipelines and associated equipment”, IEEE Transactions on Industrial Application, Issue 25(5): 906-909.
Shouxi Wang, John J. Carroll, 2007. „Leak Detection for Gas and Liquid Pipelines by Online Modeling”, Journal on SPE ProjFac&Const, 2(2): 1-9.