MODELLING AND EXPERIMENTAL INVESTIGATION
ON PERFORATED PLATE MOBILITY
CHEAH YEE MUN
SUPERVISOR DECLARATION
“I hereby declare that I have read this thesis and in my opinion this report is sufficient in terms of scope and quality for the award of the degree of
Bachelor of Mechanical engineering (Structure and Materials)”
Signature: ………..
Supervisor: Dr. Azma Putra
MODELLING AND EXPERIMENTAL INVESTIGATION ON PERFORATED PLATE MOBILITY
CHEAH YEE MUN
This report is submitted in fulfillment of the requirements for the award Bachelor of Mechanical Engineering (Structure and Materials)
Faculty of Mechanical Engineering
Universiti Teknikal Malaysia Melaka
DECLARATION
“I hereby declare that the work in this report s my own except for summaries and quotations which have been duly acknowledged.”
Signature: ………..
Author: Cheah Yee Mun
iii
“You have to learn the rules of the game. And then you have to play better than anyone else.”
ACKNOWLEDGEMENT
First and foremost, I would like express my sincere gratitude to my
supervisor, Dr Azma Putra. Without fail, he has provided me detailed guidance and
encourage throughout the project. He has always been enthusiastic in solving,
reflecting, and advising my problems. I appreciate for the countless time he had spent
having discussion with me regarding my final year project and offering numerous
suggestions to improve my work.
Secondly, I would like to acknowledge and give my appreciation to a senior,
Wai Chee Mun, for giving suggestions, sharing knowledge and provided guidance
throughout the modeling analysis using Finite Element method. His knowledge has
helped me completing the first part of analysis of my project successfully. My
appreciate goes to a dedicated lab assistant from Fasa B, Encik Hairul Nizam for his
kindness and patient in giving suggestions and techniques throughout the experiment analysis. With the help from Encik Hairul, the second part of my project’s analysis was done successfully.
My thanks go to my course-mates for their support, patience, encouragement,
and useful suggestion. Lastly, special thanks to my family for their good-natured
v
ABSTRACT
Porous materials are usually applied to noise control. The application of
perforated plate is widely used in sound absorption purposes as it reduces sound
radiation. However, perforation of the plate has a decreasing effect on the plate
stiffness thus increasing its vibration. Therefore, a modeling and experimental investigation on perforation’s effects is performed. This report discusses the effect of the perforation on the plate mobility. The perforation ratio could be affected by the
numbers of holes, diameter of the holes, and arrangement of the perforation. In this
project, Finite Element Analysis – Patran and Nastran was employed to obtain the discrete surface vibration velocity on a single analytical model. The natural
frequency of the Finite Element Analysis solid plate model was compare with the
theoretical calculation to validate the accuracy of the modeling. The result obtained
from the Finite Element Analysis was compared with the solid plate to show the
effect of perforation on plate mobility, which increases as the perforation ratio
increases. An experimental investigation was carried out to validate the results from
ABSTRAK
Bahan berliang biasanya digunakan untuk mengawal tahap bunyi. Aplikasi
plat berlubang digunakan secara meluas dalam tujuan penyerapan bunyi kerana ia
mengurangkan radiasi bunyi. Walaubagaimanapun, perlubangan plat meninggalkan
kesan pengurangan kekakuan plat dan menyebabkan getarannya meningkat. Dengan
itu, satu analisis pemodelan dan eksperimen terhadap kesan perlubangan panel telah
dilaksanakan. Laporan ini membincangkan kesan perlubangan terhadap tahap getaran
plat. Kadar nisbah perlubangan boleh dipengaruhi oleh pelbagai factor, seperti
bilangan lubang, diameter lubang, dan susunan perlubangan. Dalam projek ini, ‘Finite Element Analysis’ - Patran dan Nastran telah digunakan untuk mendapatkan halaju diskret getaran permukaan pada model analisis tunggal. Frekuensi tabii model
plat pepejal FEM telah dibandingkan dengan pengiraan teori untuk mengesahkan
ketepatan model. Hasil yang diperolehi dari FEM akan bandingkan dengan plat yang
tidak berlubang untuk menunjukkan kesan penembusan terhadap pergerakan plat,
yang meningkat apabila nisbah penembusan meningkat. Satu eksperimen telah
vii
CONTENT
CHAPTER CONTENT PAGES
ACKNOWLEDGEMENT iv
LIST OF ABBREVATION xv
LIST OF APPENDICES xvi
CHAPTER 1 INTRODUCTION 1
1.1 BACKGROUND 1
1.2 PROBLEM STATEMENT 3
1.3 OBJECTIVES 3
1.4 SCOPE OF PROJECT 3
CHAPTER 2 LITERATURE REVIEW 5
2.1 INTRODUCTION 5
2.2 MOBILITY 7
2.3 THE EFFECT OF PERFORATIO ON MATERIAL PROPERTIES
9
2.4 DIRECT FREQUENCY ANALYSIS USING FINITE ELEMENT METHOD
12
CHAPTER 3 METHODOLOGY 15
3.1 INTRODUCTION 15
3.2 PROBLEM IDENTIFICATION 15
3.3 LITERATURE REVIEW 16
3.4 MODELLING OF PERFORATED PLATE MOBILITY USING FEA
17
3.4.1 MATERIAL PROPERTY 17
3.4.3 ELEMENT TYPE 20
3.4.4 BOUNDARY CONDITION 20
3.4.5 LOAD CONDITION 21
3.4.6 RESONANCE FREQUENCY VALIDATION 22
3.5 PLATE PARAMETERS 25
3.6 EXPERIMENTAL SETUP 27
CHAPTER 4 RESULT AND DISCUSSION 35
4.1 INTRODUCTION 35
4.2 FEM MOBILITY RESULT 36
4.2.1 VALIDATION OF FE MODEL AND ANALYTICAL CALCULATION
4.2.3 EFFECT OF HOLE ARRAYS AT FIX PERFORATION RATIO
39
4.2.4 EFFECT OF PERFORATION RATIO AT FIX HOLES DIAMETER OR FIX NUMBER OF
4.3 EXPERIMENTAL RESULT 45
4.3.1 VALIDATION OF FE MODEL AND
4.3.4 EFFECT OF PERFORATION RATIO AT FIX HOLES DIAMETER OR FIX NUMBER OF
CHAPTER 5 CONCLUSION AND RECOMMENDATION 54
5.1 CONCLUSION 54
5.2 RECOMMENDAION 55
REFERENCES 56
APPENDIX A 58
ix
LIST OF TABLES
NO TITLE PAGES
2.1 Coefficient for the cubic expression in Eq. (2.28) 12
3.1 Material properties for mild steel plate 17
3.2 Comparison between theoretical result and FEM 22
3.3 Parameters of the perforated panel with fixed hole diameter
and different number of holes and perforation ratio
25
3.4 Parameters of the perforated panel with different hole
diameter and number of holes and fix perforation ratio 10%
25
3.5 Parameters of the perforated panel with different hole
diameter and number of holes and fix perforation ratio 21%
25
3.6 Parameters of the perforated panel with different hole
diameter and number of holes and fix perforation ratio 30%
26
3.7 Parameters of the perforated panel with fix number of holes
and different holes diameter and perforation ratio
26
3.8 Parameters of the perforated panel with fix perforation
ratio 10% and different arrangement of holes
26
3.9 Parameters of the perforated panel with fix perforation
ratio 20% and different arrangement of holes
26
3.10 Parameters of the perforated panel with different arrays and
fix perforation ratio 10%
27
3.11 Parameters of the perforated panel with different arrays and
fix perforation ratio 20%
27
LIST OF FIGURES
FIGURE TITLE PAGES
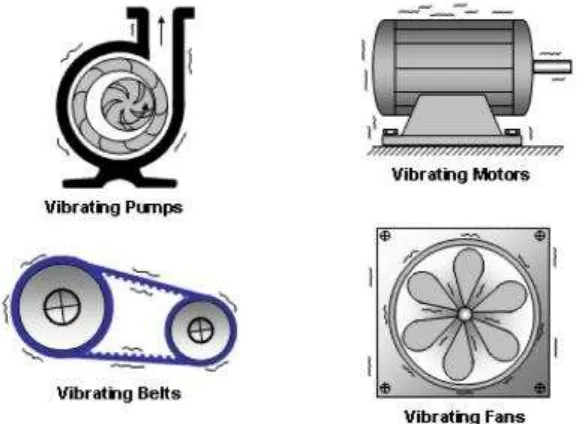
1.1 Example of vibrating System 1
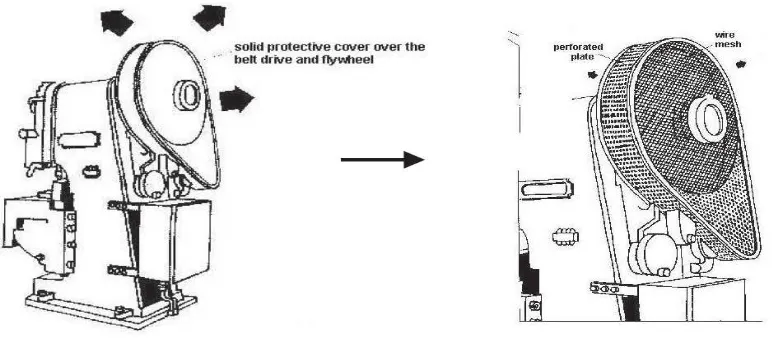
1.2 Example of perforated structure used in machinery 2
2.1 A spring-mass-damper system 6
2.2 Sign convention and coordinate systems for a rectangular
plate excited by a point force
7
2.3 The dimension of the perforated panel 10
2.4 Diagonal and rectangular array geometries 11
2.5 Comparison of surface mobility between theoretical and
FEA model
14
3.1 Flow of problem identification 15
3.2 Methodology flow chart for FYP I and FYP II 16
3.3 Plan view of different perforation patterns: square and
triangular (diagonal)
17
3.4 Finite Element Model of perforated plates with fix diameter
xi
FIGURE TITLE PAGES
3.9 Finite Element Model of perforated plates with fix
perforation ratio 10% and different arrangement of holes
19
3.10 Finite Element Model of perforated plates with fix
perforation ratio 21% and different arrangement of holes
19
3.11 Finite Element Model of perforated plates with fix
perforation ratio 10% and different perforation arrays
20
3.12 Finite Element Model of perforated plates with fix
perforation ratio 21% and different perforation arrays
20
3.13 Coordinate system of the FE model 21
3.14 FEM solid plate boundary condition 21
3.15 Location of the applied load 1N 22
3.16 Validation of the Mode 1 natural frequency for solid plate 23
3.17 Perforated plate at Mode 1 and its resonance frequency 23
3.18 General schemes for plate frequency response analysis 24
3.19 Experimental setup for mobility measurement using impact
hammer
29
3.20 Experimental setup for free-free boundary condition 29
3.21 Solid Plate with the locations of the force excitation 30
3.22 Experiment model of perforated plates with fix diameter
10mm
30
3.23 Experiment model of perforated plates with fix perforation
ratio 10%
30
3.24 Experiment model of perforated plates with fix perforation
ratio 21%
30
3.25 Experiment model of perforated plates with fix perforation
ratio 30%
31
3.26 Experiment model of perforated plates with fix number of
holes – 40holes
31
3.27 Finite Element Model of perforated plates with fix
perforation ratio 10% and different arrangement of holes
FIGURE TITLE PAGES
3.28 Finite Element Model of perforated plates with fix
perforation ratio 21% and different arrangement of holes
31
3.29 Finite Element Model of perforated plates with fix
perforation ratio 10% and different perforation arrays
32
3.30 Finite Element Model of perforated plates with fix
perforation ratio 10% and different perforation arrays
32
3.31 DEWESOFT FRF Analyzer Software Layout 33
3.32 General schemes for plate frequency response experimental
measurement
34
4.1 Comparison of the mobility of a solid panel from FE model
and from analytical calculation
36
4.2 Mobility of the perforated panel with different hole
diameter and number of holes and fix perforation ratio 10%
38
4.3 Mobility of the perforated panel with different hole
diameter and number of holes and fix perforation ratio 21%
38
4.4 Mobility of the perforated panel with different hole
diameter and number of holes and fix perforation ratio 30%
39
and different number of holes and perforation ratio
41
4.8 Mobility of the perforated panels with fix number of holes
and different holes diameter and perforation ratio
42
4.9 Mobility of the perforated panels with different pattern
arrangement at fix perforation ratio 10%
43
4.10 Mobility of the perforated panels with different pattern
arrangement at fix perforation ratio 20%
xiii
plate from FE simulation for the holes aligned the edges of
the plate.
44
4.13 Comparison of the mobility of a solid panel from FE model
and from experiment
45
4.14 Mobility of the perforated panel with different hole
diameter and number of holes and fix perforation ratio 10%
46
4.15 Mobility of the perforated panel with different hole
diameter and number of holes and fix perforation ratio 21%
46
4.16 Mobility of the perforated panel with different hole
diameter and number of holes and fix perforation ratio 30%
47
4.17 Mobility of the perforated panels with different arrays and
fix perforation ratio 10%
48
4.18 Mobility of the perforated panels with different arrays and
fix perforation ratio 21%
48
4.19 Mobility of the perforated panels with fixed hole diameter
and different number of holes and perforation ratio
50
4.20 Mobility of the perforated panels with fix number of holes
and different holes diameter and perforation ratio
50
4.21 Mobility of the perforated panels with different pattern
arrangement at fix perforation ratio 10%
51
4.22 Mobility of the perforated panels with different pattern
arrangement at fix perforation ratio 21%
52
4.23 The first mode of free-free boundary condition plate from
FE simulation for the holes concentrated at the center
52
4.24 The first mode of free-free boundary condition plate from
FE simulation for the holes arranged at the
edges of the plate
xiv
S
Area of plate surfacet
Thickness
Second derivatives ofx
n
LIST OF ABBREVATION
DAQ Data Acquisition System
FE Finite Element
FEA Finite Element Analysis
FEM Finite Element Method
FRF Frequency Response Function
FYP Final Year Project
XLE Perpendicular ligament efficiencies
xvi
LIST OF APPENDICES
NO TITLE PAGES
A Gantt Chart Final Year Project II 58
CHAPTER 1
INTRODUCTION
1.1 Background
Sound is an audible sense that perceived by human brain through ears. Sound
travels through matter by wave. Wave is an oscillation of pressure that can be
reflected, refracted or attenuated. The difference between sound and noise is the
desired and undesired waveform respectively. Noise is mean by any unwarranted
disturbance within a useful frequency band (NIOSH, 1991). Despite that, noise can
be varies according to the human ears’ sensitivity. Noise is generated from vibrating structures as show in Figure 1.1.
2
Noise can be present in any human activity, e.g., occupational noise and
environmental noise. In the United States, occupational hearing loss is the most
common work-related injury where there is approximately 22 million U.S. workers
exposed to hazardous noise level at work (WHO, 2004). It is recommends that all
work expose to noise should be controlled below a level equivalent to 85 dBA for
eight hours to minimize the risk of hearing loss (NIOSH, 2012). Therefore, in order
to prevent hearing loss, noise control technology is introduced to aim to reduce noise
to an acceptable level.
Prior to the design of noise control, the noise sources must be identified and
evaluated. Occupational noises are usually generated from sources that associated
with structural vibration. Mechanical vibration noise occurs when the components
resonating at their natural frequencies. Thin-plate like structure is one of the
significant sources of noise in structural vibration.
One of the common noise control technique is to introduce holes into the
structure. Perforated plates can be seen in industrial applications, for example, the
solid protective cover over the belt drive and flywheel is replaced with a wire mesh
cover as seen in Figure 1.2. Porous material applies the sound absorption principal,
where it is used to absorb the sound by reducing its intensity. The holes allow the
sound waves to pass right through it. The potential for using these alternative
structures allows the ability to blend into different situation to ensure adequate
performance.
1.2 Problem Statement
Noise characteristic of structures are determined by mass, stiffness and
damping. Perforated panels are commonly used in sound absorption purposes. It is
important in reducing the noise level in order to create an adequate working
environment. However, the introduction of perforation into the solid panels
significantly reduces the stiffness of the plate. Stiffness is defined as the rigidity of a
structure. Now consider the area of the plate significantly decreases due to the
investigated using the result obtained from Finite Element Method (FEM). FEM will
be employed to obtain the discrete surface vibration velocity. Direct frequency
response analysis is used as the solution. Different holes geometries are stimulated to
investigate their effect on the plate mobility. The perforation ratio can be affected by
the number of the holes, diameter of the holes and arrangement of the perforation
patterns. The mobility of the perforated panel is then compared against that of the
solid plate in one-third octave band frequency. Experimental work will be conducted
4
The effect of perforation into a solid panel will change the dynamic properties of the panel. Many had discussed the effective Young’s modulus, the Poisson’s ratio, and the density after the perforation effect. However, this project will not concentrate on these dynamic properties. This project aims to investigate the
CHAPTER 2
LITERATURE REVIEW
2.1 Introduction
Stiffness is the measurement of rigidity of an object. Stiffness arises from any
structural component that deforms elastically under action of forces. For an elastic
structure with a single degree of freedom, stiffness is
x F
k (2.11)
Equation (2.11) shows the relationship between stiffness of the structure and
the displacement response of the structure. Hooke’s Law define that stiffness is the deflection that proportional to the load applied. A decrease in the stiffness, result an
increases in the displacement response, if the force applied on the structure remain
constant.
Introduction of perforation into the panel significantly reduces the cross
section area. The material property Young’s modulus and length of the panel remained constant; stiffness of the plate is directly proportional to the cross-section
area. A reduction in cross-section results in a decreases in stiffness. This is lead to a
higher amplitude as the panel has a lower resistant to the applied load.
When a structure is excited with force, the result of the motion of the