O R I G I N A L P A P E R
Rainfall infiltration: infinite slope model for landslides
triggering by rainstorm
Agus Setyo Muntohar•Hung-Jiun Liao
Received: 22 October 2008 / Accepted: 2 March 2010 / Published online: 28 March 2010 Springer Science+Business Media B.V. 2010
Abstract Shallow slope failure due to heavy rainfall during rainstorm and typhoon is common in mountain areas. Among the models used for analyzing the slope stability, the rainwater infiltration model integrated with slope stability model can be an effective way to evaluate the stability of slopes during rainstorm. This paper will propose an integrated Green–Ampt infiltration model and infinite slope stability model for the analysis of shallow type slope failure. To verify the suitability of the proposed model, seven landslide cases occurred in Italy and Hong Kong are adopted in this paper. The results indicate that the proposed model can be used to distinguish failed and not-yet failed slopes. In addition, the proposed model can be used as the first approximation for estimating the occurrence time of a rainfall-induced shallow landslide and its depth of sliding.
Keywords LandslidesRainwater infiltrationInfinite slope analysis
Green–Ampt infiltrationRainstorm
1 Introduction
Shallow slope failure due to heavy rainfall during rainstorm and typhoon commonly happens in mountain area in Taiwan. Severe damages and losses often accompanied the failure of slopes. The majority of slope instability is a result of rainfall. It is well
Agus Setyo Muntohar was formerly Postdoctoral Fellow at Department of Construction Engineering, College of Engineering, National Taiwan University of Science and Technology, Taipei, Taiwan
A. S. Muntohar (&)
Department of Civil Engineering, Universitas Muhammadiyah Yogyakarta, Jl. Lingkar Selatan, Taman Tirto. D.I., Yogyakarta, Indonesia
e-mail: [email protected]; [email protected] H.-J. Liao
Department of Construction Engineering, College of Engineering, National Taiwan University of Science and Technology, 43 Sec. 4 Keelung Road, Taipei 106, Taiwan
recognized that rainfall-induced landslides are caused by the increase in pore pressures and seepage forces during or shortly after the period of intensive rainfall. Increasing the pore pressure will reduce the effective stress of the soil and thus reduces the soil strength and may trigger the slope failure. Increase in pore water pressure is generally caused by rain water infiltration. Several researches have been done to study the heavy-rainfall infiltra-tion–induced slope failures with various methods such as laboratory or field experiments, numerical method, and field observation (Iverson2000; Rahardjo et al.2002; Chen et al.
2005; Hong et al.2005; Sako et al.2006). Laboratory or field experiments are valuable method to study infiltration mechanism. Finite element method (FEM) is wildly applied for seepage analysis. However, the results of FEM analysis are affected by several factors and much effort is needed for performing calculation (Duncan 1996). Installation of slope monitoring system for failure will help to collect data and analyze the rainfall-induced landslide hazards. On the other hand, hydrological model based on the Richards’ equation (1931) has also been developed successfully to simulate the transient pore water pressure and to assess slope failure. However, this mathematical model is suitable for homogenous slope and site specific (Iverson2000; Cho and Lee2002).
In this paper, a deterministic model is presented to estimate the occurrence time of landslide for shallow slip type. The model proposed in this paper is developed based on the Green and Ampt infiltration and infinite slope stability principles. To verify the reliability of the proposed model, some worldwide landslide cases histories was re-analyzed using the proposed model.
2 Infiltration and slope stability models
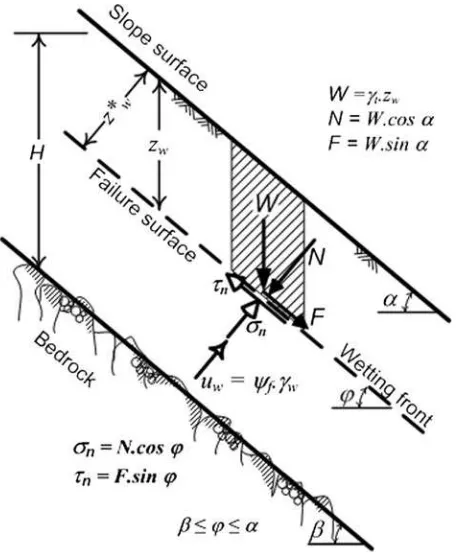
Rainfall infiltration is commonly simulated in slope stability analysis as one-dimensional flow. Among them, Green and Ampt infiltration model is the most used one in practice for one-dimensional infiltration (Cho and Lee2002; Xie et al.2004). The Green and Ampt infiltration model for one-dimensional rainwater infiltration is originally developed for the ponding water infiltration on horizontal surface. So, it needs some modification to be applied to sloping ground surface (as shown in Fig.1). Usually, the ponding depth on a
sloping surface is small compared to the wetting front matric suction, wf. Therefore, a
small ponding water head was assumed for the theoretical analysis in this study. Assuming that the ponding water will become runoff, whichh0=0 (Fig.1a). This assumption was also applied by Gavin and Xue (2008).
Chen and Young (2006) modified the basic Green and Ampt equation for sloping ground as illustrated in Fig.2b. The equation was derived from the h-based Richard’s equation (Richards1931). In thex* andz* direction, wherex* andz* are defined as the down slope and normal directions, respectively (Fig.1a), an equation to express Richards’ equation can be written as
As indicated by Philip (1991), the solution to Eq.1on a planar slope is independent of x* except for a small region from the crest to the point of the slope change. Therefore, Eq.1can be simplified to
pressure, respectively,z andtare the elevation above a vertical datum and time, respec-tively,kis hydraulic conductivity of soil, andais slope surface angle.
The equations indicates that except for the difference in coordinate definition, the only change needed to use Eq.2for sloping surfaces is to replacekwithkcosa. It means that on sloping surfaces, only gravity normal to the surface direction is changed by cos a(i.e., capillary forces are unchanged). Conversely, the downslope component of gravity does cause flow, but it does not change the water content profile along the normal direction on a planar slope because the flow field is independent ofx*. Therefore, as an approximate solution, the Green and Ampt model can be redefined with this same modification (Chen and Young2006). The basic Green–Ampt equations of cumulative and infiltration rate are written in Eq.3a, b, respectively. For sloping ground, as an approximate solution, the cumulative infiltration and infiltration rate in the direction normal to slope surface can be rewritten as in Eq.4a,4b.
• Basic Green–Ampt equation for horizontal ground surface:
FðtÞ wfDhln 1þ FðtÞ
• Modified Green–Ampt equation for sloping ground surface:
FðtÞ
wheref(t)=infiltration rate at timet,F(t)=cumulative infiltration at timet,wf=suction
head at wetting front,Dh=volumetric water content deficit (hs-hi),hsandhiare saturated initial volumetric water content,a=slope angle, andk=coefficient of hydraulic conduc-tivity. For horizontal surface,a=0 and cosa=1, the Eq.4aand4bwas the same form of cumulative infiltration of the Green–Ampt equation for horizontal surface (Chow et al.1988).
The Green–Ampt infiltration model is assumed to meet the following conditions:
1. the suction head at wetting front is constant,
2. the deficit of volumetric water content is uniform before and after wetting,
3. the coefficient of hydraulic conductivity is constant and equal to saturated hydraulic conductivity (ks).
Muntohar and Liao (2009) stated that the rainwater infiltrates through surface to sub-surface layer with three possible mechanisms:
1. Case (1): rainfall intensity is larger than infiltration rate. Ground surface becomes saturated in the entire time interval (Dt). Hence, the amount of infiltrated rainfall, at t=t?Dt, can be calculated using the following equation:
Case (2): rainfall intensity is smaller than the infiltration rate at the beginning of the time interval but becomes larger than the infiltration rate later. So the ground surface changes from unsaturated to saturated condition in this time interval (Dt).
Case (3): rainfall intensity is smaller than infiltration rate during the time interval. Under this condition, surface is not saturated and all the rainfall infiltrates into soil. Then, the rate and accumulation of infiltration are equal to the rainfall intensity [I(t)] and the accumulated rainfall [R(t)], respectively.
The Green–Ampt model assumed that soil from the surface to the depth of wetting front is saturated; but the soil below the wetting front still remains in its initial degree of saturation. The depth of wetting front perpendicular to slope surface at time t can be estimated based on the continuity equation as:
zwðtÞ ¼FðtÞ
Dh ð6Þ
The deficit water content of a soil (Dh) is a measurement of the maximum amount of water that can be absorbed or desorbed by capillary action. It is somewhat different from the soil– water retention ability. Generally, the value of (hs-hr) increases with pore sizes (Vanapalli et al.1998). To some extent, it is also related to the void ratio. A larger value of (hs-hr) represents a higher water storage capacity, which results in a lower advance rate of the wetting front as indicated by Green and Ampt’s model (1911). In addition, the effect ofDhappears to be not so great as the effects ofkson the pore water pressure profile (Zhan and Ng2004).
When raining, rainwater infiltrates into the subsurface soil through the unsaturated zone on the top. It results in wetted zone at shallow depth near the slope surface and may lead to slope failure during a prolonged rainfall event. This type of slope failure usually occurs in the form of shallow slip that develops parallel to the slope surface. So it can be analyzed as the infinite slope case. Figure2illustrates the infinite slope model used in this study. The model assumes a presence of the bedrock below the covering soil layer. By combining with pore water pressure model, lower safety factor can be obtained when meet two possible condition, that is, (1) the wetting front is advanced or (2) a perched groundwater table is formed. The infiltration flow is assumed to be parallel to the slope surface (Rahardjo et al.
1995; Crosta1998). The critical slip surface is assumed to occur at the wetting front or the interface of soil and bedrock or impervious layer. Thus, by considering the unsaturated soil behavior, the factor of safety (FS) against an infinite slope sliding can be calculated asfollows:
where c0 and /0 are soil cohesion (kPa) and internal friction angle of soil (degree), respectively,ctis the saturated unit weight of soil (kN/m3),cwis the unit weight of water
(=9.81 kN/m3), a is the slope angle (degree), uw is the pore water pressure (kPa),
zw=zw*.cosarepresents gravity head at the wetting front (m), andH is the bedrock or
impervious layer depth (m). Crosta (1998) suggested that, for zw\H, the pore water
be assumed to be 0.5 of the air entry value (wa) as proposed by Wang and Benson (1995).
When an advancing wet front from rainfall infiltration saturates the upper soil layer (zwCH) and rainfall intensity was greater than the infiltration rate, a rise in the groundwater table may occur. But, the water table is still below the bedrock. In the Green– Ampt model under unsteady flux, the soil is continuously supplied with water. After the front reaches the bottom of the soil column, the water does not redistribute but the water content keeps reducing as water leaves the soil column at the bottom (Essig et al.2009). The calculated depth of wetting front (z*w) is possible advancing to bedrock. For this case, perched water table may be occured. In this scenario, the pore water pressure is assumed positive. In this case, the failure plane is assumed to occur at adjacent surface between soil and bedrock. The rise in the ground water table induces the condition of a flow parallel to the slope and hydrostatic state, as a result the pore pressure at a depth ofzwfrom the water table can be expressed asuw=cwzwcosa, wherez*w.cosais the gravity head of wetting front suction (Rahardjo et al.1995).
When the effective cohesion of soil is zero (c0=0), and the slope angle (a) is greater than or equal to the effective internal friction angle of the soil (/0), the unsaturated soil slope fails from a loss of apparent cohesion upon saturation of the soil by the infiltrating wetting front. In this case, failure from a reduction in the shear strength because of a rise in the ground water table or the occurrence of a perched water table is unlikely since the slope can only be stable with the shear strength due to the matric suction that fully disappears before saturation is achieved. However, if the slope angle does not exceed the effective friction angle of the soil, slopes are not susceptible to failure from the loss of matric suction since the slopes remain stable without the additional shear strength due to the matric suction; yet the slopes will fail from a reduction in the effective stress in the saturated condition that results in the reduction in the shear strength of soil. When a slope possess an effective cohesion component (c0), and the effective cohesion of the soil is adequate, even a partially saturated slope with a slope angle that is greater than the effective friction angle can remain stable in spite of a complete loss of apparent cohesion. However, even these types of slopes would fail in the saturated condition if an increase in pore pressure reduces the effective stress (Sudhakar1996).
3 Application of the model
To verify the suitability of proposed model, seven landslide case histories selected from literatures were evaluated. The landslide cases were located in Northern Tuscany, Italy (Casagli et al.2005; Tofani et al.2006) and Tung Chung East, Hong Kong (Lan et al.2003; Evans and Lam2002). The parameters listed in Table1are collected from the literatures and input in the analysis Green–Ampt and infinite slope model.
Landslide cases in Italy were also analyzed using computer programs SEEP/W and SLOPE/W (Casagli et al.2005) and TRIGRS (Lan et al.2003) was adopted for Hong Kong cases to investigate the slope stability during rainstorm. SEEP/W and SLOPE/W was a finite element method to simulate seepage and infiltration and slope stability calculation (Krahn 2004a, b). SEPP/W model was based upon the equation of motion and mass conservation. The governing equation of mass conservation was extended to incorporate saturated–unsaturated conditions as written in Eq.8(Fredlund and Rahardjo1993).
whereH=total head;kxandky=hydraulic conductivity in thex-direction and
y-direc-tion, respectively; Q=applied boundary flux; h=volumetric water content; and t=time. Conceptually, Eq.8 affirms that the difference between the flow entering and leaving an elemental volume at a point in time is equal to the change in the volumetric water content. Furthermore, the sum of the rates of change of flows in thex- andy-direction plus the external applied flux is equal to the rate of change of the volumetric water content with respect to time. SEEP/W runs by solving simultaneous equations for each node resulting pore water distribution. Then, the results were linked into the slope stability analysis by importing into SLOPE/W. The output of SLOPE/W define factor of safety of the slope with respect to elapsed time.
TRIGRS used Richard’s equation for infiltration modeling (Iverson2000; Baum et al.
2002) was incorporated in an infinite slope-stability analysis. The Richard’s equation was written in the following form:
and achieved the following solution in terms of slope-normal pore water distribution by an analogous heat conduction solution under certain initial boundary conditions:
wðZ;tTÞ ¼Zbð1d=ZÞ þZIz
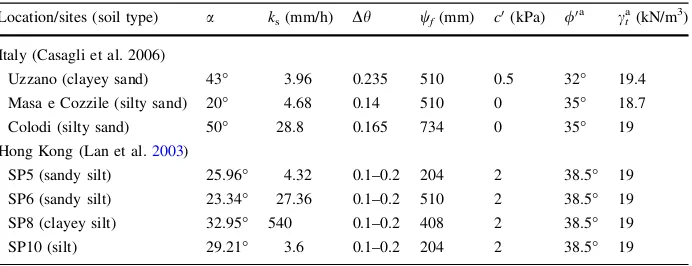
Table 1 Parameters used for Tuscany and Tung Chung East landslide cases
Location/sites (soil type) a ks(mm/h) Dh wf(mm) c0(kPa) /0a cta(kN/m3)
a, slope angle;ks, saturated hydraulic conductivity;Dh, deficit volumetric water content;wf, suction head at
wetting front;c0, cohesion;/0, friction angle;ct, saturated unit weight a
R tð Þ ¼ ffiffiffiffiffiffiffiffiffi t=p
p
expð1=tÞ erfc 1 .ptffiffiffiffi ð10eÞ
where h=volumetric water content; w=water pressure head, t=time; t* and T*=normalized time;D0=initial hydraulic diffusivity; kz=hydraulic conductivity in
z-direction;R(t*)=pressure head response function;Z=depth;d=initial steady state water table depth; Iz=infiltration rate; and erfc=error function. Once the slope
hydraulic response w(Z, t) was obtained, the slope stability coupled model can be estab-lished usingw(Z, t) as groundwater table data in general limit equilibrium equation for slop stability assessment (Iverson2000).
3.1 Description of the Northern Tuscany Landslides, Italy
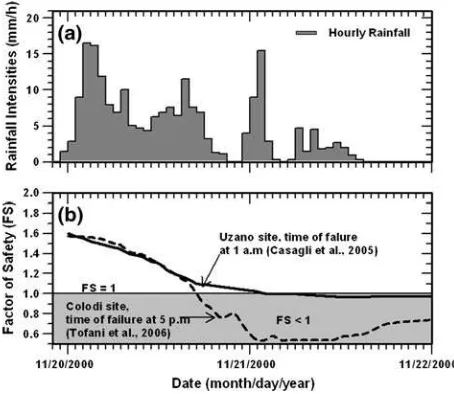
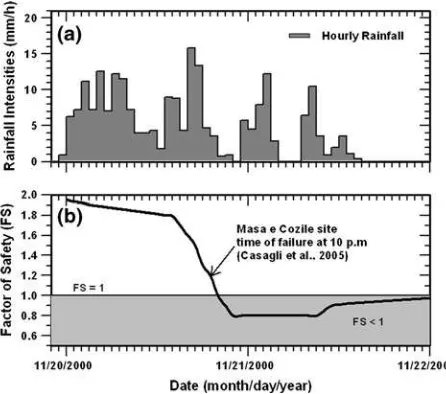
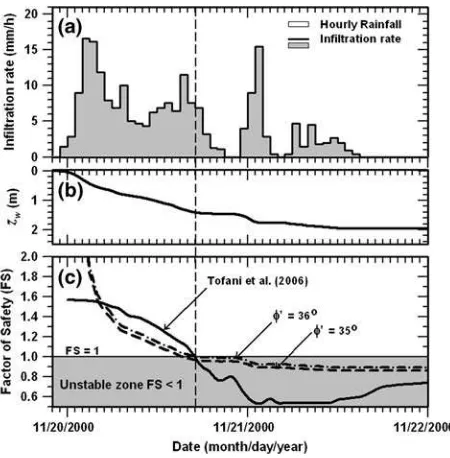
Casagli et al. (2005) and Tofani et al. (2006) investigated landslide events in Northern Tuscany area, Italy. During November 20–21, 2001, rainstorm triggered several landslides in Uzzano, Masa e Cozzile, and Colodi sites. Figures3a and4a show the rainfall record during the rainstorm. Landslide at Masa e Cozzile site was a reactivation of a small part of a larger inactive landslide. On the other hand, landslides at Uzzano and Colodi sites were the first time failure. In the mid and upper sections of the valley, where most landslides occurred, the geologic condition consisted of a 1.5- to 5-m-thick colluvial soil layer overlying the bedrock. SEEP/W and SLOPE/W programs were used to analyze these rainwater infiltration triggered landslides. Figures3b and4b show the fluctuation of the computed factor of safety. Slope instabilities were estimated to occur at 6:00 AM on 21 November 2000 at Uzzano site and at 10:30 PM and 4:30 PM on 20 November, 2000, at Massa e Cozzile site and Colodi site, respectively.
3.2 Description of the Tung Chung East landslide, Hong Kong
Lan et al. (2003) investigated the rainfall-induced landslide in Tung Chung East, Lantau Island. The slope stability was analyzed based on the rainfall event on 11 June 2001. Figure5shows the rainfall record of the rainfall event. Four sites, namely: SP5, SP6, SP8, and SP10 sites, were analyzed using the TRIGRS program. Among the sites, different geologic settings were observed, such as the completely deposited volcanic rock (CDV) at SP5 and SP6 sites, colluvium (Col) at SP8 site, and residual soil (Res) at SP10 site. A rainfall event on 11 June 2001 (Fig.5) was used for the analysis. The maximum 24-h rainfall recorded was 209 mm. Pore pressure measured per hour was ranging from?65 to
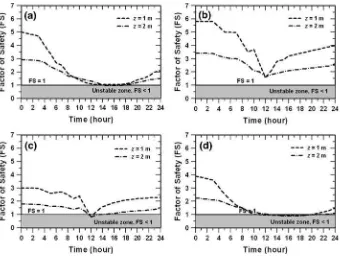
-100 kPa. The computed factor of safety using TRIGRS are shown in Fig.6. The figure shows variation of the slopes stability with elapsed time of rainstorm (t) and slip-surface depth (z).
Fig. 4 aRainfall intensities andbcomputed factor of safety at Masa e Cozzile site
4 Results and discussion
4.1 Northern Tuscany Landslides, Italy
By inputting the information of slopes listed in Table1and the recorded rainfall data to the proposed model, the infiltration and slope stability response to rainfall are shown in Figs.7,8, and9for Uzzano, Masa e Cozzile, and Colodi sites, respectively.
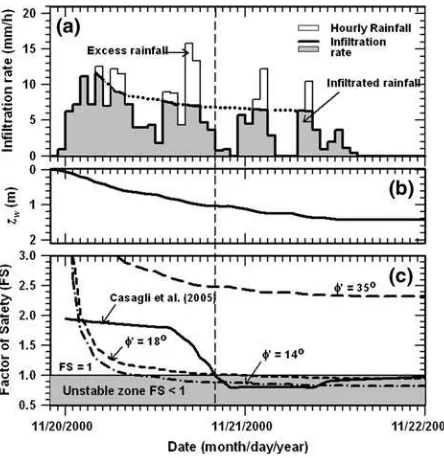
During the rainstorm, all the rainwater infiltrated into the slope at the Colodi site since its saturated hydraulic conductivity (ks=28.8 mm/h) was higher than the rainfall intensity
(Fig.9a). At Uzzano and Massa e Cozzile sites, the slopes were covered by lower per-meability soils. At the beginning of the storm, the infiltration rate was about equal to the rainfall rate, then after the ponding on the slope surface started, the infiltration rate was lower than the rainfall intensity (Figs.7a,8a). Four ponding times were observed during the raining period for both sites. Ponding means that rainfall exceeds infiltration. As a consequence, surface runoff was expected to occur at Uzzano and Masa e Cozzile sites as shown in Figs.7a and 8a. At the end of the rainstorm, the rainwater had infiltrated to a depth of 1.1 m, 1.5, and 2.0 m for Uzzano, Massa e Cozzile, and Colodi sites, respectively, as shown in Figs.7b,8b and9b. At the time of landslide occurrence, the depth of wetting front reached 1.0, 1.1, and 1.4 m below ground surface for Uzzano, Massa e Cozzile, and Colodi sites, respectively. An investigation done by Tofani et al. (2006) found that the depth of sliding zone was found to be ranging from 1 to 1.5 m. Hence, the estimated depth of failure by the proposed model in this paper was in agreement with Tofani et al. (2006).
Fig. 8 Calculated factors of safety for slope at Massa e Cozzile site, Italy;ainfiltration rate,bwetting front depth,cchange of factor of safety
Fig. 7 Calculated factors of safety for slope at Uzzano site, Italy;ainfiltration rate,bwetting front depth,
The variations in slope stability are presented in Figs.7c,8c, and9c. In general, the computed factor of safety decreases with the elapsed time of rainfall. It can be shown that the computed factor of safety from the proposed model has a different response pattern to the rainfall from that reported in the reference. Such a difference is resulted from the assumption made in the proposed model that pore water pressure is a constant, but in finite element method SEEP/W, the change of pore water pressure was not constant and was fluctuated in nature. However, the time of landslide occurrence is in good agreement between the computed using the proposed model and the finite element method using SEEP/W and SLOPE/W. In other words, the proposed model can be applied to distinguish a slope which will fail during certain time of a rainfall event from those will not fail. The calculated factors of safety in Fig.7c show that the slopes are prone to slip at the end of rainstorm (at 3 PM on 21 November 2000) for Uzzano site. While the Colodi slope tends to fail around 16 h (at 3 PM on 20 November 2000) after the beginning of the rainstorm (Fig.9c). However, at Massa e Cozzile site, the slope stays stable with the minimum factor of safety equal to 2.3 (Fig.8c). The changes in the factor of safety are not quite the same compared to those recorded by Casagli et al. (2005) and Tofani et al. (2006). The friction angle used in Casagli et al. (2005) and Tofani et al. (2006) was the mean value. It is widely recognized that slope stability analysis is characterized by numerous uncertainties due to limited sampling, discrepancy between different methods of laboratory and in situ strength testing, and uncertainties in soil models (Whitman 2000). However, if the soil strength parameter, such as friction angle, is adjusted to/0=30and 36for Uzzano and Colodi
sites, respectively, and /0=18(residual friction angle, /0r), for Massa e Cozzile site,
then the calculated time of failure will become close to that recorded by Casagli et al. (2005) and Tofani et al. (2006). Since the landslide case at Masa e Cozzile site was reactivated landslide, hence, based on the computation using the proposed model, the shear
Fig. 9 Calculated factors of safety for slope at Colodi site, Italy;ainfiltration rate,bwetting front depth,
strength parameter is suitable if using the residual friction angle. These results indicated that uncertainties of the soil parameter should be taken into account for calculation in the proposed model for better results. Simons et al. (2005), for reactivated slides, it is possible to apply residual shearing resistance instead of peak or mean shear strength.
4.2 Tung Chung East Landslides, Hong Kong
By inputting the slope and rainfall data of the Hong Kong cases to the proposed model, the potential infiltration rate, variation of the wetting front depth, and the change of safety factor can be calculated and shown in Figs.10, 11, 12, and 13. It can be found that different patterns of factor of safety during the rainstorm were obtained between computed using TRIGRS and the proposed model. The computed factor of safety by Lan et al. (2003) using TRIGRS program can simulate the change of pore water pressure as a function of rainfall intensity and depth. Based on the Equations10a and 10b, when the rainfall intensity increased, then, the pore water pressure would increase and resulted in decreasing of safety factor. On the contrary, if the rainfall intensities decreased, the pore water pressure decreased and the factor of safety increased.
According to the proposed model, different infiltration responses were exhibited between a slope with lower permeability and slope with higher permeability. For slopes with lower permeability (SP5 and SP10 sites), rainwater started to pond on surface 4 h
Fig. 10 Calculated factors of safety for colluvium slope at SP5 site, Tung Chung East, Hong Kong;
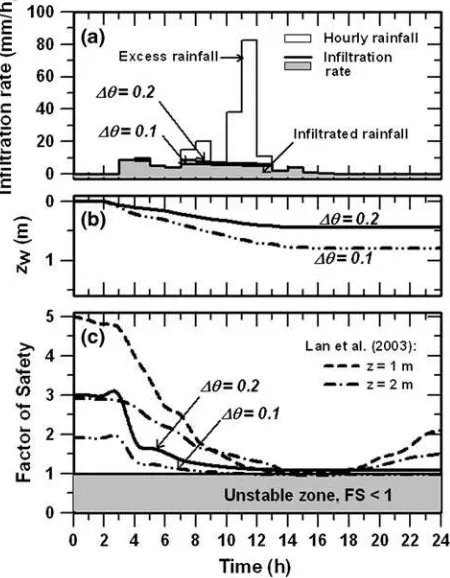
after the beginning of rainfall as shown in Figs.10a and 13a. For slopes with higher permeability (SP6 and SP 8 sites), all the rainfall infiltrates to the subsoil as shown in Figs.11a and 12a. A ponding only occur within 1 h at SP6 sites. It was observed in Figs.10b,11b,12b, and13b that the rainwater infiltrates deeper into the slope with higher permeability (Figs.11b,12b) than the slope with lower permeability (Figs. 10b,13b). The depths of wetting front (zw) vary also with the deficit volumetric water content value (Dh).
The infiltration response can explain that failure at the slope with lower permeability was attributed by rain infiltration in combination with rainwater runoff within the ponding period.
In general, from the TRIGRS simulation, the depths of failure were 1 m for SP5 and SP10 slopes, and 2 m at SP8 site (Figs.10c,12c,13c). The estimated depth of failure using the proposed model, when the slopes were prone to slip, were 0.85 m (Fig.10b), 2.3 m (Fig.12b), and 0.6 m (Fig.13b) for SP5, SP8, and SP10 sites, respectively. The estimated depth of sliding surface from the proposed model only differed by 0.15–0.4 m compared to the recorded landslides cases.
At SP5 site (Fig.10c), the time of failure was estimated 14 h after beginning of rainfall. It is close to the failure time estimated by Lan et al. (2003) whenDh=0.1. The SP6 slope is stable in that rainfall event. IncreasingDhto 0.2, the minimum factor of safety on SP6 site is still as high as 1.59 at 11 h after the beginning of rainfall (Fig.11c). It is close to the
Fig. 11 Calculated factors of safety for colluvium slope at SP6 site, Tung Chung East, Hong Kong;
minimum factor of safety of 1.62 calculated by Lan et al. (2003). In comparison, slope at SP8 site is likely to fail 11 h after the beginning of rainfall whenDh=0.1 (Fig.12c). It is close to the computed failure time (i.e., 12 h after the onset of rainfall) using TRIGRS. Figure13c shows that the slope at SP10 site is likely to fail 9 and 14 h after the rainfall initiation if theDhis equal to 0.1 and 0.2, respectively. This result is slightly different from the TRIGRS’ results which estimate slopes failed 11–14 h after onset of rainfall. In summary, the proposed model can generate similar results to those reported by Lan et al. (2003) for the Hong Kong slopes.
Based on the analysis, overall results indicated that the proposed model can simulate the rain infiltration response. The model was shown that the landslides were triggered by a down going wetting front. However, the analysis is limited by the assumptions of an infinite slope model for stability and a one-dimensional infiltration analysis for a constant suction, volumetric water content, hydraulic conductivity, and soil strength parameter. Separate analysis of the effect of those parameters on the estimation of landslide is desirable and further studies are in progress in this regard. Nevertheless, the results pre-sented serve to point out the importance of landslide triggering by rain infiltration within a simple framework.
5 Conclusions
By integrating the Green–Ampt infiltration model and the infinite slope stability model, a model has been proposed in this study for studying the rainfall infiltration–induced shallow landslide. The suitability of the proposed model in estimating the occurrence time of landslide has been confirmed by the deterministic analysis based on the landslide cases in Italy and Hong Kong. The estimated time of landslide from the proposed model is about 1–2 h different from the reported time of landslides on both landslides cases. The proposed model can also be used to estimate the depth of sliding surface. The estimated depth of sliding surface from the proposed model only differed by 0.15–0.4 m compared to the recorded landslides cases. In general, the proposed model can be used as the first approximation to estimate the occurrence time of shallow landslide and the depth of sliding surface. The proposed model can be also applied to analysis rain infiltration response on a slope.
Acknowledgments The authors wish to thank the National Taiwan University of Science and Technology and also the Universitas Muhammadiyah Yogyakarta for jointly providing grants and scholarship to financially support this research.
Fig. 13 Calculated factor of safety for residual soil slope at SP10 site, Tung Chung East, Hong Kong;
References
Baum RL, Savage WZ, Godt JW (2002) TRIGRS-A fortran program for transient rainfall infiltration and grid-based regional slope-stability analysis. U.S. Geological Survey Open-File Report 02-0424, 27 p
Casagli N, Dapporto D, Ibsen ML, Tofani V, Vannocci P (2005) Analysis of triggering mechanism during the storm of 20–21 November 2000 in northern Tuscany. Landslides 3(1):13–21
Chen L, Young MH (2006) Green-Ampt infiltration model for sloping surface. Water Resour Res 42:1–9 Chen CY, Chen TC, Yu WH, Lin SC (2005) Analysis of time-varying rainfall infiltration induced landslide.
Environ Geol 48:466–479
Cho E, Lee SR (2002) Evaluation of surficial stability for homogenous slopes considering rainfall char-acteristics. J Geotech Geoenviron Eng 128(9):756–763
Chow VT, Maidment DR, Mays LW (1988) Subsurface water. Ch. 4 in Applied hydrology. McGraw-Hill, New York
Crosta G (1998) Regionalization of rainfall threshold: an aid to landslide hazard evaluation. Env Geol 35(2– 3):131–145
Duncan JM (1996) State of the art limit equilibrium and finite-element analysis of slopes. J Geotech Eng 122(7):577–596
Essig ET, Corradini C, Morbidelli R, Govindaraju RS (2009) Infiltration and deep flow over sloping surfaces: comparison of numerical and experimental results. J Hydrol 374:30–42
Evans NC, Lam JS (2002) Tung Chung East natural terrain study area ground movement and groundwater monitoring equipment and preliminary results. Geotechnical Engineering Office, Hong Kong, GEO Technical Note TN 4/2002: 105 p
Fredlund DG, Rahardjo H (1993) Soil mechanics for unsaturated soils. Wiley, New York
Gavin K, Xue J (2008) A simple method to analyze infiltration into unsaturated soil slopes. Comput Geotech 35:223–230
Hong Y, Hiura H, Shino K, Sassa K, Fukuoka H (2005) Quantitative assessment on the influence of heavy rainfall on the crystalline schist landslide by monitoring system-case study on Zentoku landslide Japan. Landslides 2:31–41
Iverson RM (2000) Landslide triggering by rain infiltration. Water Resour Res 36(7):1897–1910 Krahn J (2004a) Seepage modeling with SEEP/W. Geo Slope International Ltd., Canada Krahn J (2004b) Stability modeling with SLOPE/W. Geo Slope International Ltd., Canada
Lan HX, Zhou CH, Lee CF, Wang SJ, Wu FQ (2003) Rainfall-induced landslide stability analysis in response to transient pore pressure: a case study of natural terrain landslide in Hong Kong. Sci China Ser E Technol Sci 46:52–68
Muntohar AS, Liao H-J (2009) Analysis of rainfall-induced infinite slope failure during typhoon using a hydrological—geotechnical model. Environ Geol 56(6):1145–1159
Philip JR (1991) Hillslope infiltration: planar slopes. Water Resour Res 27(1):109–117
Rahardjo H, Lim TT, Chang MF (1995) Shear-strength characteristics of residual soils. Can Geotech J 32:60–77
Rahardjo H, Leong EC, Rezaur RB (2002) Studies of rainfall-induced slope failures. Proceeding of the National Seminar Slope 2002, April 27, 2002, Bandung, Indonesia, pp 15–29
Richards LA (1931) Capillary conduction of liquids in porous mediums. Physics 1:318–333
Sako K, Kitamura R, Fukagawa R (2006) Study of slope failure due to rainfall: a comparison between experiment and simulation. Proceeding of the 4th International Conference on Unsaturated Soil, April 2–6, 2006, Carefree, Arizona, USA, pp 2324–2335
Simons N, Menzies B, Matthwes M (2005) Soil and rock slope engineering, Thomas Telford, London, Ch. 5 Sudhakar MR (1996) Role of apparent cohesion in the stability of Dominican allophone soil slopes. Eng
Geol 43:265–279
Tofani V, Dapporto S, Vannocci P, Casagli N (2006) Infiltration, seepage and slope instability mechanisms during the 20–21 November 2000 rainstorm in Tuscany, Central Italy. Nat Hazards Earth Syst Sci 6:1025–1033
Vanapalli SK, Sillers WS, Fredlund MD (1998) The meaning and relevance of residual water content to unsaturated soils. Proceeding of the 51st Canadian geotechnical conference, 4–7 October, Edmonton, Alberta, pp 101–108
Wang XD, Benson CH (1995) Infiltration and saturated hydraulic conductivity of compacted clay. J Geotech Eng 121(10):713–722
Xie MW, Esaki T, Cai MF (2004) A time-space based approach for mapping rainfall-induced shallow landslide hazard. Env Geol 46:840–850