Joint FDA / Health Canada
Quantitative Assessment
of the Risk of Listeriosis from
Soft-Ripened Cheese Consumption in
the United States and Canada:
Report.
Food Directorate / Direction des aliments
Health Canada / Santé Canada
Center for Food Safety and Applied Nutrition
Food and Drug Administration
U.S. Department of Health and Human Services
Contributors
Risk Assessment Team
Canada United States
Mark Smith Régis Pouillot
William Ross Sherri Dennis
Loan Nguyen Steve Gendel
- Clarence Murray III
Risk Management Team
Canada United States
Hélène Couture Vincent Bunning
Jeff Farber Ted Elkin
André Jean Kathy Gombas
- John Sheehan
- Donald Zink
Risk Communication, United States
Susan Cahill
Acknowledgments
The following organizations and individuals are acknowledged for their contributions to this project:
- Former FDA/CFSAN risk assessors and risk managers David Carlson, Richard C. Whiting and Robert L. Buchanan for their participation in the early stage of the project; - Greg Paoli for the organization of an applied training in Analytica®;
- The International Dairy Foods Association (Carry Frye) for the organization of a field trip in a cheese processing facility;
- Versar, Inc (David Bottimore, Kathy Coon, Stephanie Sarraino) for their organization of the peer review;
- József Baranyi, James S. Dickson, Cary Frye and Ralph L. Kodell for their peer review of the draft report document and the draft model;
- Angela Catford for her review and suggestions for the final draft report; - Karin Hoelzer for her help on the update of Table 4.
- Sofia Santillana and Steven Duret for their help on editing the final report.
- This work was supported in part by an appointment to the Research Participation Program at the Center for Food Safety and Applied Nutrition administered by the Oak Ridge Institute for Science and Education through an interagency agreement between the U.S. Department of Energy and the U.S. Food and Drug Administration.
An Interpretative Summary of this Risk Assessment, Appendixes, Answers to public
comments and the Analytica® model are available at
Table of Contents
Contributors ... 3
Acknowledgments... 4
Table of Contents ... 5
List of Tables ... 7
List of Figures ... 12
Abbreviations and Acronyms ... 14
Mathematical / Statistical Notations ... 15
Summary... 1
1. Introduction ... 17
2. Background ... 18
2.1. Recalls, Outbreaks and Sporadic Cases Associated with L. monocytogenes in Soft-Ripened Cheese ... 18
2.2. Overview of Cheese Regulation ... 20
2.3. Overview of Cheese Production ... 22
2.4. Overview of the Cheese Industry ... 23
2.5. Quantitative Microbial Risk Assessment... 25
2.6. Previous Listeria Risk Assessments ... 26
3. Risk Assessment Modeling ... 28
4. Hazard Identification ... 30
5. Hazard Characterization ... 35
6. Basic Processes ... 40
6.1. Growth ... 41
6.1.1. Growth in Milk and Growth in Cheese after Ripening ... 43
6.1.2. Growth in Cheese During Processing ... 55
6.2. Inactivation ... 58
6.2.1. General Inactivation ... 59
6.2.2. Inactivation During Initial Ripening ... 59
6.2.3. Inactivation During Mitigation using a Defined Log Reduction ... 59
6.3. Partitioning and Mixing ... 60
6.3.1. Partition Model ... 61
6.3.2. Mixing Model ... 62
6.4. Contamination ... 62
6.4.1. Method ... 65
6.4.2. Results ... 67
6.4.3. Assumptions and Discussion ... 69
6.5. Removal ... 70
6.5.1. Generality ... 71
6.5.2. Testing Bulk Milk ... 71
7. Exposure Assessment ... 72
7.1. On Farm ... 73
7.1.1. Data and Methods ... 74
7.1.2. Dairy Silo Prevalence and Concentration for the Raw-Milk Cheese Baseline Model ... 78
7.2. Cheese Processing ... 82
7.2.1. Mitigation ... 83
7.2.2. Cheese Formation ... 84
7.2.3. Ripening ... 85
7.2.4. Aging ... 88
7.3. Transport, Marketing, and Retail ... 89
7.3.1. Transport and Marketing Step ... 89
7.3.2. Retail ... 90
7.4. Home ... 92
7.4.1. Serving Size ... 92
7.4.2. Home Storage ... 94
7.5. L. monocytogenes Ingested in a Serving ... 98
8. Risk Characterization (Method) ... 99
8.1. Output of the Risk Characterization ... 99
8.2. Estimator for the Risk Outputs ... 100
8.3. Variability / Uncertainty ... 101
8.3.1. Contrasting Variability and Uncertainty ... 101
8.3.2. Implementing Variability and Uncertainty Separation ... 103
8.3.3. Relative Sizes of Variability and Uncertainty in modeled Risk Outputs ... 104
8.4. Sensitivity Analysis ... 105
8.4.1. Changing one Factor at a Time ... 106
8.4.2. Rank Correlation ... 106
9. Results of the Model Application Examples ... 107
9.1. Results of the Pasteurized-Milk Cheese Baseline Model ... 107
9.1.1. Organization ... 108
9.1.2. No Uncertainty Considered... 109
9.1.3. Uncertainty Considered ... 119
9.2. Sensitivity Analysis: Changing one Parameter at a Time ... 122
9.2.1. Environmental Contamination Prevalence and Levels ... 123
9.2.2. Growth Characteristics ... 124
9.3. Sensitivity Analysis: Other Methods ... 127
9.3.1. Model Components’ Variability ... 127
9.3.2. Model Components’ Uncertainty ... 129
10. Results of the Model Application Alternatives ... 131
10.1. Raw-milk Cheese Baseline and Alternatives for Raw-milk Cheese ... 131
10.1.1. Baseline for Raw-Milk Cheese ... 134
10.1.2. Artisanal-scale Operations ... 138
10.1.3. Mitigations for Raw-Milk Cheese ... 142
10.2. Testing Bulk Milk and Cheese Lots ... 147
10.2.1. Bulk Milk Testing ... 149
10.2.2. Cheese Lot Testing... 151
10.2.3. Testing Considerations ... 152
11. Limitations, Caveats and Data Gaps ... 157
List of Tables
Table 1: Level of variability considered in terms of process, data and estimates, according to
subpopulations and country. ... 7
Table 2: Impact of various alternatives on the predicted mean risk of invasive listeriosis per soft-ripened cheese serving relative to the risk per serving of baseline cases for Elderly population in Canada and in the U.S. ... 14
Table 3: U.S. and Canadian L. monocytogenes related cheese recalls. ... 19
Table 4: Cheese associated Listeria outbreaks. ... 19
Table 5: Time temperature combinations for milk pasteurization as defined in 21 CFR 133.3(d). ... 21
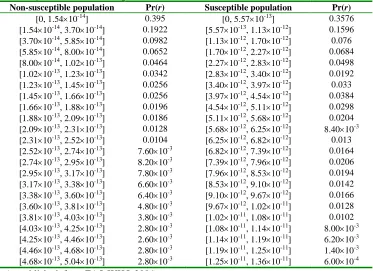
Table 6: Uncertainty distributions for r parameter values. ... 39
Table 7: Basic processes and their qualitative effects. ... 41
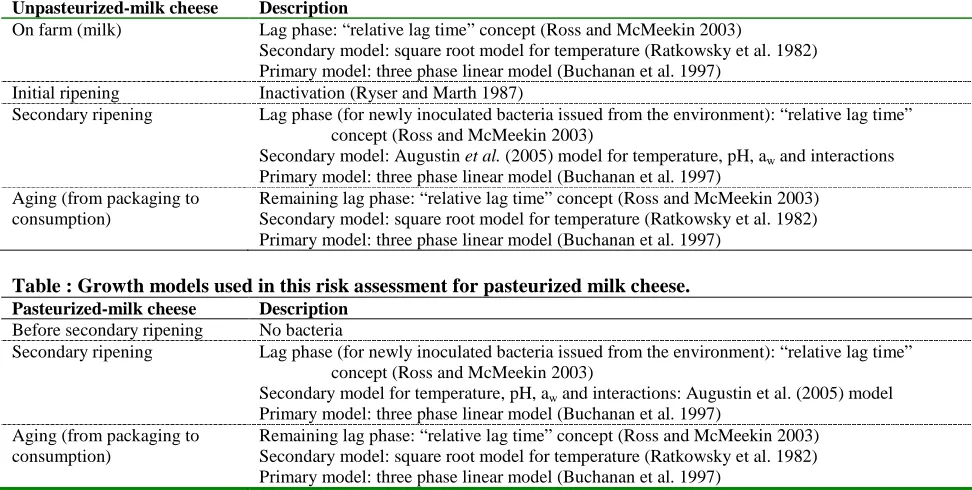
Table 8: Growth models used in this risk assessment... 42
Table 9: Maximum likelihood estimates for minimum growth temperature. ... 48
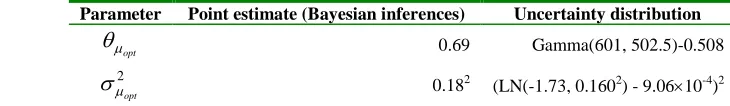
Table 10: Estimates for optimal growth rate in milk distribution. ... 48
Table 11: Data for Camembert aging and holding growth rates. ... 49
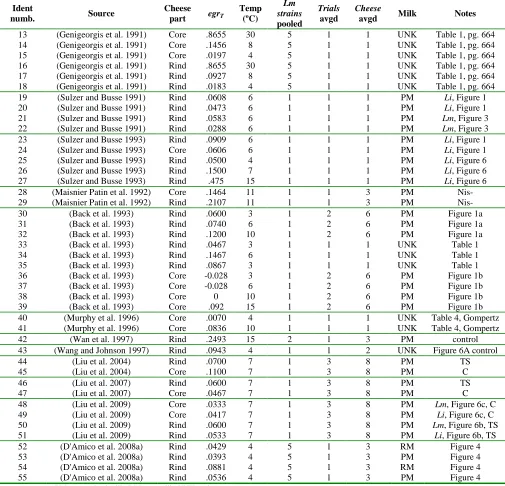
Table 12: Maximum likelihood estimates, for Camembert rind and core EGR20. ... 53
Table 13: Correlations among parameters' maximum likelihood estimates. ... 53
Table 14: Maximum population density (log(cfu)/g) as a function of temperature and medium. 54 Table 15: Results reported in Gombas et al. (2003) for soft-ripened cheeses. ... 64
Table 16: Raw results, as available on the FoodRisk.org website. ... 64
Table 17: Example of the process used to derive the distribution of the number of L. monocytogenes in a 250g cheese before aging. ... 67
Table 18: Parameters α and β used to model the frequency of cheeses with in plant contamination. ... 68
Table 19: Maximum likelihood estimates, level of contamination at retail. ... 68
Table 20: Probability distribution of the number of L. monocytogenes that contaminate a 250g cheese in the plant. ... 69
Table 22: Point estimates of the prevalence of positive collections and the L. monocytogenes concentration in positive collections. Baseline model, farmstead-scale operations. ... 80 Table 23: Point estimates of the prevalence of positive collections and the L. monocytogenes concentration in positive collections. Raw-milk cheese, artisanal-scale operations. ... 80 Table 24: Prevalence of positive collections and the L. monocytogenes concentration in positive
collections. Baseline farmstead-scale case, uncertainty considered. ... 81 Table 25: Estimates for the prevalence of positive collections and the L. monocytogenes concentration in positive collections. Raw-milk cheese, artisanal-scale case, uncertainty considered. ... 82 Table 26: Number of generations done at the end of the ripening phase according to the time of contamination. ... 86 Table 27 Summary statistics for storage temperature (°F) for retail semi-solid cottage cheese
dairy product, supermarket. ... 90 Table 28: Specification of the temperature TrF (ºF) at retail. ... 91 Table 29: Brie and Camembert serving size distributions for Canadian population. ... 93 Table 30: Parameters of the empirical cumulative distribution used to describe the serving size,
U.S. ... 93 Table 31: Serving size (g) distribution summary statistics, soft-ripened cheese, Canada and U.S.
... 94 Table 32: Soft cheese storage attributes, fraction of cheeses consumed with listed characteristic.
... 95 Table 33: Weibull distribution for time the product is unopened until the 1st consumption (d). m.l.e. (±se) [95% ci] (Wald-type) ... 96 Table 34: Consumption occasions (Poisson λ) and time (d) between successive occasions from
opened package (Exponential θ). m.l.e. (±se) [95% ci] (Wald-type) ... 96 Table 35: Time (d) to serving at random. ... 96 Table 36: Parameter estimates for fitted Laplace distributions for refrigerator storage temperature (ºC). ... 97 Table 37: Temperature (ºC), serving at random. ... 98 Table 38: Number of L. monocytogenes cells per contaminated serving pasteurized-milk
Table 39: L. monocytogenes cells per g at process pathway steps, for contaminated cheeses made from pasteurized-milk, no uncertainty considered. ... 113 Table 40: Prevalence of contaminated servings of cheeses made from pasteurized-milk, no
uncertainty considered. ... 115 Table 41: Risk of invasive listeriosis per contaminated serving, of cheeses made from
pasteurized-milk, no uncertainty considered. ... 117 Table 42: Risk of invasive listeriosis per serving pasteurized-milk soft-ripened cheeses, no
uncertainty considered. ... 119 Table 43: Relative mean risk of invasive listeriosis per serving of cheese made from pasteurized milk, at random, no uncertainty considered. ... 119 Table 44: Risk of invasive listeriosis per serving at random, of cheese made from pasteurized
milk, among subpopulations in Canada. ... 121 Table 45: Risk of invasive listeriosis per serving at random, for cheese made from pasteurized
milk, among subpopulations in the U.S. ... 121 Table 46: Sensitivity of the risk per contaminated serving, Canadian Elderly population, to the
level of environmental contamination, relative to the pasteurized-milk cheese (PMC) baseline. ... 124 Table 47: Sensitivity of the risk per contaminated serving to growth characteristics relative to the pasteurized-milk cheese baseline. ... 126 Table 48: Sensitivity of the risk per contaminated serving to the storage time and temperature
relative to the pasteurized-milk cheese (PMC) baseline. ... 127 Table 49: Spearman’s rank correlations between various inputs and the risk per serving of
soft-ripened cheese at random, made from pasteurized-milk, for the Elderly population, Canada... 129 Table 50: Spearman’s rank correlation between the mean or the 97.5th percentile of the risk per serving of soft-ripened cheese at random and some uncertain parameters. ... 130 Table 51: Risk of invasive listeriosis per serving at random of soft-ripened cheese made from
raw milk , from farmstead-scale operations under the current 60-day aging regulation. 135 Table 52: Risk of invasive listeriosis per serving: soft-ripened cheese made from raw milk
Table 53: Risk of invasive listeriosis per serving at random of soft-ripened cheese made from raw-milk, farmstead-scale operations, under the current 60-day aging regulation, among subpopulations in Canada. ... 138 Table 54: Risk of invasive listeriosis per serving at random of soft-ripened cheese made from
ra-milk, farmstead-scale operations, under the current 60-day aging regulation, among subpopulations in the U.S. ... 138 Table 55: Risk of invasive listeriosis per serving at random of soft-ripened cheese made from raw milk, artisanal-scale operations, under the current 60-day aging regulation, no uncertainty considered. ... 139 Table 56: Relative risk of invasive listeriosis per serving at random of soft-ripened cheese made from raw milk, artisanal-scale operations, under current 60 day aging regulation vs. soft-ripened cheese made from pasteurized milk baseline and vs. soft-soft-ripened cheese made from raw milk baseline (farmstead-scale operations, under current 60 day aging regulation). ... 140 Table 57: Risk of invasive listeriosis per serving at random of soft-ripened cheese made from
raw milk, artisanal-scale operations, under the current 60-day aging regulation, among subpopulations in Canada. ... 141 Table 58: Risk of invasive listeriosis per serving at random of soft-ripened cheese made from
Table 62: Risk of invasive listeriosis per serving of soft-ripened cheese made from raw milk. Baseline for soft-ripened cheese made from raw milk (report) vs. addition of a substance that reduces the surface contamination by 2 log10. ... 147 Table 63: Impact of testing bulk milk or soft-ripend cheese lots on the risk per serving, relative to the risk per serving of baseline cases for Elderly population in Canada. ... 149 Table 64: Impact of testing bulk milk or soft-ripened cheese lots on the risk per serving, relative to the risk per serving of baseline cases for Elderly population in the U.S. ... 150 Table 65: Risk of invasive listeriosis per serving of soft-ripened cheese made from pasteurized
milk: relative risk when cheese lot testing is implemented. ... 151 Table 66: Impact of parameters of testing bulk milk or soft-ripened cheese lots on the risk per serving, relative to the risk per serving of baseline testing or pasteurized-milk soft-ripened cheese for Elderly population in Canada and the U.S. ... 154 Table 67: Level of variability distinguished for process, data and estimates, according to
List of Figures
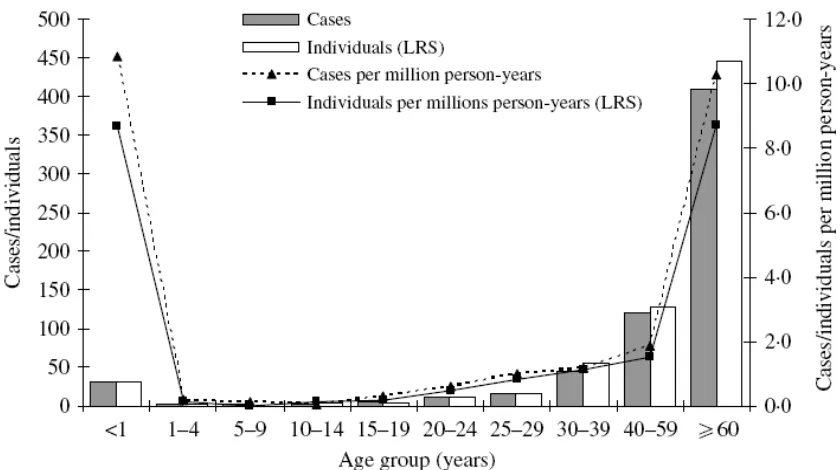
Figure 1: General flow chart for commercial production of Camembert. ... 23 Figure 2: The 3 modules of the model. ... 29 Figure 3: The 5 stages of the exposure assessment... 30 Figure 4: CDC FoodNet data on the incidence of listeriosis by age and gender in the U.S. (CDC 2006). ... 32 Figure 5: Canadian data on the incidence of listeriosis from the National Listeriosis Reference
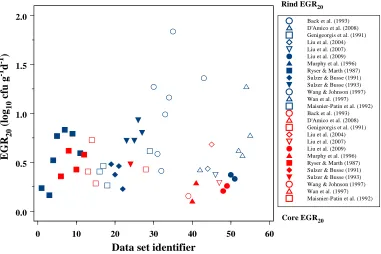
Service and the National Notifiable Diseases system (Clark et al. 2010). ... 33 Figure 6: The product pathway and the corresponding basic processes. ... 41 Figure 7: The three-phase linear primary growth model. ... 43 Figure 8: Study EGR20 (study-temperature EGRT-transformed) in Camembert rind (blue
symbols) and core (red symbols). ... 52 Figure 9: Marginal density functions for single Camembert cheese rind EGR20 (blue) and single
Camembert cheese core EGR20 (black), when EGR20 greater than 0. ... 54 Figure 10: Modeled number of generations during Camembert cheese ripening and
manufacturing. ... 58 Figure 11: Mixing and partitioning process in the exposure assessment model... 61 Figure 12: Schematic view of the inference process used to estimate the contamination of
cheeses in plant. ... 64 Figure 13: On farm process and data used. ... 74 Figure 14: Distribution of the concentration (log cfu/ml) of L. monocytogenes in positive milk
collection and change in concentration distribution as Pr(Lm mastitis | Lm+ environment) increases over range 0 (0.025) 0.15. ... 79 Figure 15: Schematic view of cheese processing and associated basic processes. ... 83 Figure 16: Example growth of L. monocytogenes in Camembert. ... 85 Figure 17: Schematic view of the transport, marketing and retail steps and associated basic
Figure 21: Distribution for risk of invasive listeriosis per soft-ripened cheese serving at random, Elderly population, Canada. ... Figure 22: Log10(median) (♦) and log10(mean) (■) risk per serving at random for the Elderly population, Canada, comparing soft-ripened cheese made from pasteurized milk baseline, soft-ripened cheese made from raw milk baseline, farmstead raw-milk cheese without 60-day aging regulation, farmstead raw-milk cheese with a 3-log reduction of
L. monocytogenes concentration in milk, farmstead raw-milk cheese with milk testing,
farmstead raw-milk cheese with cheese lot testing. See text for details. ... 152 Figure 23: Log10(median) (♦) and log10(mean) (■) risk per serving at random for the Elderly
Abbreviations and Acronyms
aw Water activity
CDC Centers for Disease Control and Prevention
CFR Code of Federal Regulations
CFSAN Center for Food Safety and Applied Nutrition
CRC Consolidated Regulations of Canada
cfu Colony Forming Unit
d Day
EGR Exponential growth rate
FAO Food and Agriculture Organization of the United Nations
FDA U.S. DHHS Food and Drug Administration
FoodNet Foodborne Diseases Active Surveillance Network FSIS USDA Food Safety Inspection Service
GT Generation Time
HC – SC Health Canada – Santé Canada
IC Immunocompromised
IDFA International Dairy Food Association
Lm Listeria monocytogenes
MC Monte-Carlo
m.l.e. maximum likelihood estimator
MPN Most Probable Number
PMC Pasteurized-Milk Cheese
RMC Raw-Milk Cheese
RTE Ready-to-Eat or Ready-to-Eat food
UPC Universal Product Code
USDA United States Department of Agriculture
U.S. DHHS United States Department of Health and Human Services
WHO World Health Organization
Mathematical / Statistical Notations
Beta(a, b) Beta distribution with shape parameters a and b
Bernoulli(p) Bernoulli distribution with parameter p. Equivalent to Binomial(1, p)
Binomial(n, p) Binomial distribution with number of trials n and probability p
CI95% 95% Confidence Interval or 95% Credible Interval
E[x] Expected value of the random variable x
ex or exp(x) Exponential of x
Exponential(a) Exponential distribution with scale parameter a
Gamma(a, s) Gamma distribution with shape parameter a and scale parameter s
Laplace(a, b) Laplace distribution with location a and scale b
Pr(x) Probability of x
Pr(x|y) Conditional probability of x given y
Normal(µ, σ) or N(µ, σ) Normal (Gaussian) distribution with mean µ and standard deviation σ
ln(x) Natural (base e) logarithm of x
logNormal(µ, σ) or LN(µ, σ) Log normal distribution. x ~ LN(µ, σ) if ln(x) ~ N(µ, σ) log(x) or log10(x) Logarithm of x to base 10
logb(x) Logarithm of x to base b
logit(p) ln(p/(1-p))
Poisson(λ) Poisson distribution with mean λ
ρ(x, y) Spearman rank correlation coefficient between x and y (Spearman’s rho)
se Standard error
Triangular(a, b, c) Triangular distribution with minimum a, mode b and maximum c
TruncatedNormal(µ, σ; a, b) Truncated normal distribution i.e. N(µ, σ) restricted to the domain [a, b]
Uniform(a, b) Uniform distribution from a to b
Beta-Pert(a, b, c) Beta-Pert distribution with minimum a, most likely value b and maximum value c
Summary
Background
Listeria monocytogenes is a widely occurring pathogen that can be found in agricultural and food
processing environments. Ingestion of L. monocytogenes can lead to the development of listeriosis, which may affect only in the gastrointestinal tract, but can invade other parts of the body (referred to as “invasive listeriosis”), with consequences that may include septicemia, meningitis, encephalitis, spontaneous abortion, and stillbirth. Epidemiological data show that listeriosis has one of the highest hospitalization rates and one of the highest case fatality rates among foodborne diseases in the United States (Mead et al. 1999; Scallan et al. 2011). Serious illness occurs preferentially in people considered as more susceptible, such as the elderly and those who have a pre-existing illness that reduces the effectiveness of their immune system, and in pregnant women (Rocourt 1996; Goulet et al. 2012).
The U.S. and Canada have experienced sporadic illnesses and outbreaks of listeriosis associated with the consumption of cheeses, including soft-ripened cheese. Both the U.S. Department of Health and Human Services / Food and Drug Administration (FDA) and Health Canada – Santé Canada (HC-SC) / Food Directorate continue to evaluate the safety of soft cheese, particularly soft cheese made from unpasteurized milk.
The Listeria monocytogenes in soft-ripened cheese risk assessment evaluates the effect of factors such as the microbiological status of milk, the impact of cheese manufacturing steps on
L. monocytogenes levels, and conditions during distribution and storage on the overall risk of
invasive listeriosis to the consumer, following the consumption of soft-ripened cheese in Canada and in the U.S. The risk assessment makes it possible to evaluate the effectiveness of some process changes and intervention strategies in reducing risk of illness.
considered the comments that pertained directly to the risk assessment and have responded to them in a separate document.1 Some of the revisions to the draft of the full risk assessment report were made in response to these comments.
Scope and General Approach
The Listeria monocytogenes soft-ripened cheese risk assessment focuses on the source(s) of
L. monocytogenes contamination, the effects of individual manufacturing and/or processing
steps, and the effectiveness of various intervention strategies on the levels of L. monocytogenes in the product as consumed and the associated risk of invasive listeriosis. The scope of this quantitative microbial risk assessment is:
• Pathogen of Concern: Listeria monocytogenes.
• Food(s) of Concern: Soft-ripened cheese.
• Populations of Interest: The general populations of the U.S. and Canada, and subpopulations identified as at-risk in both countries (i.e., pregnant women, immunocompromised individuals and the elderly population).
• Endpoint(s) of concern: Invasive listeriosis.
• Risk metric: The probability of invasive listeriosis per soft-ripened cheese serving.
The risk assessment follows Codex alimentarius, U.S. and Canadian recommendations (Codex
alimentarius Commission 1999; Health Canada Decision Making Framework 2000; CFSAN
Risk Analysis Working Group 2002). It comprises hazard identification, hazard
characterization, exposure assessment and risk characterization components (Codex alimentarius Commission 1999).
The primary metric used in this report is the risk per serving of soft-ripened cheese. A fully quantitative approach is taken and mathematical / probabilistic modeling is employed to estimate
1 Joint FDA / Health Canada Quantitative Assessment of the Risk of Listeriosis from Soft-Ripened Cheese
Consumption in the United States and Canada: Replies to Public Comments available at
the risk per serving of soft-ripened cheese in both countries, as well as to test the effects of some alternatives on those risks, as requested in the management charge (see Appendix,2 section “Charge developed by the Risk Manager Team”). A second-order (or two dimensional) Monte-Carlo simulation is used (Frey 1992). This framework lets one evaluate separately the variability (from serving to serving, from subpopulation to subpopulation, from country to country) in the risk estimates and the uncertainty about those estimates of variability in the risk that accrues from, particularly, data uncertainty.
The model structure is based on literature data, previous risk assessments (Bemrah et al. 1998; FDA/FSIS 2003; FAO/WHO 2004; Sanaa et al. 2004) and expert sources (Health Canada, Bureau Microbial Hazards; FDA CFSAN). Data were obtained from the literature (see section “References”), from government nutrition surveys (National Center for Health Statistics 2003-2004; Statistics Canada 2004), from a specific survey on home storage time and temperature practices (RTI International et al. 2005) and from specific expert elicitations (CFSAN 2008; IDFA 2008).
This summary provides an overview of the methods used and the main results of this risk assessment. The major reference remains the body of this report and its appendices. The reader should refer to the specific sections for details on the model, the results of the risk assessment and limitations on interpretations.
Risk Assessment
Hazard Identification
The biology, pathology, and ecology of L. monocytogenes and the epidemiology of
L. monocytogenes as a foodborne hazard have been extensively described in previous risk
assessments (FDA/FSIS 2003; FSIS 2003; FAO/WHO 2004) and in the microbiological literature (e.g. Swaminathan and Gerner-Smidt 2007). Only a summary of this information is presented in the report (see section 4, “Hazard Identification”).
Hazard Characterization
In this risk assessment, the “Elderly” population, the “Pregnant women” population, and the “Immunocompromised” population are considered as “susceptible,” following FAO/WHO (2004). The “Immunocompromised” population is deemed to include individuals like those in the “General” population except for a medical condition that makes the individuals more susceptible to invasive listeriosis.
The FAO/WHO (2004) models are used as dose-response models to evaluate the probability of invasive listeriosis following the ingestion of a given dose of L. monocytogenes. These models are exponential models (Haas et al. 1999, p. 264-266) and their parameterization uses the FAO/WHO (2004) inferences from epidemiological data (Mead et al. 1999) and the detailed exposure assessment developed in the U.S. (FDA/FSIS 2001). These models have a single parameter, r, which one commonly interprets as the probability that a single cell will cause invasive listeriosis in an individual at random. In this risk assessment, one value of the parameter
r, point estimate 1.06 × 10⁻¹², is used for the Elderly, Immunocompromised and Pregnant women populations (i.e. the “susceptible population” (FAO/WHO 2004)), and another value of the parameter r, point estimate 2.37 × 10⁻¹⁴, is used for the remaining “General” (“non-susceptible” (FAO/WHO 2004)) population (see Table 2.17, p. 56 and Table 2.20, p.58, FAO/WHO 2004). An uncertainty distribution is associated with the r parameters when uncertainty is considered in the model (see section 5, “Hazard Characterization”).
Exposure Assessment
Pasteurized-Milk Cheese Baseline Model
The pasteurized-milk cheese baseline model considers the manufacture of a Camembert-like soft-ripened cheese, as a representative example of soft-ripened cheese, made from pasteurized milk, using the stabilized cheese process (Kosikowski and Mistry 1987; Lawrence et al. 1987). From this point onwards, if a reference is made in this report to “pasteurized-milk cheese” or PMC in the context of the risk assessment model structure or its outputs, the reference is made to include soft-ripened cheese.
It is assumed that all bacteria present in the milk are definitively inactivated during the pasteurization step. In this baseline scenario, contamination with L. monocytogenes happens from environmental L. monocytogenes in the processing plant and contamination occurs after the ripening phase and before packaging. No other contamination (e.g. at store or at home) is considered in this baseline scenario or in other scenarios. The frequency and level of
L. monocytogenes in-plant contamination is inferred from detection and enumeration data
obtained by Gombas et al. (2003) on soft-ripened cheeses at retail in two U.S. FoodNet sites and a “back-calculation” procedure to derive the distribution of the level of in-plant contamination.
Bacterial growth is modeled from the point of contamination to the point of consumption. The full growth model includes the lag time in the growth when bacterial contamination comes from the environment and includes a specific model for growth in a solid medium such as cheese. Growth parameters –lag time, growth rate and maximum population density- are inferred from meta-analyses of literature data (see section 6.1, “Growth”). Bacterial growth is affected by the temperature and the storage time during aging, during transport and marketing, at retail and at home. Time and temperature profiles are derived from specific studies and from expert elicitation (RTI International et al. 2005; CFSAN 2008; IDFA 2008). Due to a lack of specific national data, cheese processing, time and temperature during aging, transport and marketing and at retail are considered to be the same in both countries.
Table 1 summarizes. In it, we show how much the model specification differentiates among subpopulations and countries:
• Bulk milk prevalence is specific to Canada and U.S.;
• L. monocytogenes levels in contaminated milk, growth in milk and growth in cheese are
common to Canada and U.S.;
• Milk and cheese processing is common to Canada and U.S.;
• Transport and marketing, and retail storage data are from U.S. sources and are extrapolated to Canada;
• Home storage time and temperature data are from U.S. sources and are extrapolated to Canada;
• Serving size distributions are inferred from countries’ national nutrition surveys;
Table 1: Level of variability considered in terms of process, data and estimates, according to subpopulations and country.
The same letter and case indicates that the same data and distribution model are used for the considered subpopulations. Variability specifications also include a full or at least a partial model of data uncertainty.
Process / Data / Estimates Canada: Elderly Canada: Pregnant women Canada: IC* Canada: General United States: Elderly United States: Pregnant women United States: IC* United States: General L. monocytogenes contamination in farm
A A A A B B B B
L. monocytogenes
contamination during processing
C C C C C C C C
Milk and Cheese processing, transport and marketing, from farm to retail (inclusive)
D D D D D D D D
L. monocytogenes
growth model and parameters
E E E E E E E E
Storage time at home
F G H H I J K K
Storage temperature at home
L M N N L M N N
Serving size O P Q Q R R R R
Resulting exposure assessment
S T U U V W X X
Dose Response Y Y Y Z Y Y Y Z
Resulting Risk Assessment
a b c d e f g h
* Immunocompromised.
Raw-Milk Cheese Baseline Model
An alternative baseline deals with the manufacture of a Camembert-like soft-ripened cheese made from raw milk, using the traditional process (Sanaa et al. 2004). From this point onwards, if a reference is made in this report to “raw-milk cheese” or RMC in the context of the risk assessment model structure or it’s outputs, the reference is made to include soft-ripened cheese.
from the scientific literature (see section 7.1, “On Farm”). Growth in milk during farm tank storage, tanker truck transport and dairy silo storage is modeled using growth parameters in milk from the literature. Specific bacterial growth and inactivation during the cheese processing (ripening) are inferred from the literature on that subject (Ryser and Marth 1987; Back et al. 1993; Sanaa et al. 2004; Ryser 2007; Liu and Puri 2008; Liu et al. 2009). Growth in cheese during ripening is modeled using environmental parameters of “traditional process” (Sanaa et al. 2004), in contrast to the “stabilized process” used for industrialized cheeses in the pasteurized-milk cheese baseline (Kosikowski and Mistry 1987; Lawrence et al. 1987). The post-ripening process for raw-milk cheeses is the same as for pasteurized-milk cheeses except that raw-milk cheeses are stored for a minimum of 60 days from the date of the beginning of the manufacturing process at a temperature of at least 2°C (35°F), according to Canadian and U.S. regulations (Food and Drugs Act B.08.030, B.08.043, B.08.0443 and 21 CFR 133.182(a)4, respectively). In the raw-milk cheese baseline, milk is collected for cheese-making from a single herd, on the farm where the cheese-making operation resides (farmstead-scale operations). Artisanal-scale operations, where milk for cheese-making is collected from 2 farms and pooled, is also evaluated, but is not used as a baseline for purposes of this risk assessment.
Alternative Scenarios
For raw-milk cheeses, other alternatives are evaluated and compared to the baseline, pasteurized-milk cheese case and to the baseline raw-pasteurized-milk cheese case. These alternatives are:
• Apply an unspecified procedure that reduces the bacterial load in milk by 3 log10, 4 log10 , 5 log10 or 6 log10 (i.e. an average 1,000-fold; 10,000-fold; 100,000-fold or 1,000,000-fold reduction in the concentration, respectively);
• Apply an unspecified antimicrobial substance that reduces the surface L. monocytogenes contamination by 2 log10 (i.e. an average 100-fold reduction in the concentration);
3 http://laws-lois.justice.gc.ca/eng/regulations/C.R.C.,_c._870/index.html
4
• Remove the 60-day aging regulation in place in Canada and in the U.S. for soft-ripened cheese; in that alternative, raw-milk soft-ripened cheeses are aged for the same lengths of time as pasteurized-milk soft-ripened cheeses;
• Test 25 ml of raw milk from the farm tank, from the tanker truck or from the dairy silo, and remove the detected L. monocytogenes positive units;
• Test a sample of 25 g from 5 cheeses of every cheese lot5, and remove the detected positive lots.
Another evaluated alternative is the implementation of a testing procedure for lots of pasteurized-milk cheeses.
Following Codex alimentarius, U.S. and Canadian recommendations, evaluations of the availability, feasibility and cost of mitigations is done, not as part of the risk assessment (this report), but externally to the risk assessment, as part of the risk management that the risk assessment would inform. For example, the risk assessment does not consider the availability of a specific milk mitigation alternative that achieves a 3-6 log10 reduction in L. monocytogenes concentration in bulk milk, nor the feasibility of testing some or all bulk milk prior to cheese making, nor the availability of an antimicrobial agent, nor the cost of testing some or all cheese lots.
For the baseline models and the alternatives, the exposure assessment outputs are the distribution of the frequency of contaminated servings and the distribution of the number of
L. monocytogenes per contaminated soft-ripened cheese serving. These distributions vary among
5 This protocol is considered for risk assessment purposes as representative of a typical protocol likely to be
used by manufacturers. It is more sensitive (less false negative results) than sampling a single analytical
portion of 25 g from the same lot. Nevertheless, it is different from, and less sensitive than the composite
protocol (i.e. 50 g from each of 5 cheeses for each composite and two composites from the lot)
recommended in the FDA Bacteriological Analytical Manual (BAM) (FDA 2011) for the detection of
subpopulations and between countries, as a result of the propagation of different serving size, home storage time and home storage temperature distributions.
The exposure assessment results suggest very high variability in the number of L. monocytogenes at the time of consumption amongst contaminated servings6:
• the prevalence of contaminated servings is predicted to be about 0.6-0.7% (6-7 per 1000 servings) for pasteurized-milk cheese, all from environmental contamination, and the prevalence of contaminated servings is predicted to be 3.2% for raw-milk cheese made in Canada and 4.7% for raw-milk cheese made in the U.S.;
• for the Canadian Elderly population, 50% of contaminated servings of pasteurized-milk cheese are predicted to have 17 or less cfu/serving; 90% of contaminated servings are predicted to have less than 5,135 cfu/serving;
• for pasteurized-milk cheese and raw-milk cheese, few servings are predicted to be heavily contaminated, for example, at levels that reach the maximum population density of L. monocytogenes.
Risk Characterization
The outputs from the exposure assessment are combined with the dose-response model to develop the risk characterization outputs (see section 8, “Risk Characterization (Method)”). Combined with the dose-response models used for the “susceptible” and the “non susceptible” populations, risk estimates differ among the Elderly, the Pregnant women, the Immunocompromised and the General populations and between the two countries (Table 1, Table 2). The major outputs of the baseline models are expressed as the risk of invasive listeriosis per soft-ripened cheese serving at random, in a specified population (Canada or U.S.; Elderly, Immunocompromised, or Pregnant women population and General population). The risk outputs for alternative scenarios are described also by the ratio of the mean risk of invasive listeriosis per serving for the considered alternative scenario to the mean risk of invasive
6 Results provided in this summary are for the pasteurized-milk cheese and raw milk, farmstead operation scale
only; additional results for the artisanal-scale operation are provided in the report, notably section 7.1 “On farm” and
listeriosis per serving for the baseline, pasteurized-milk cheese case or the baseline, raw-milk cheese case. A sensitivity analysis of the pasteurized-milk cheese baseline model is performed by changing one parameter at a time or using classical Spearman’s rank correlation coefficients.
Pasteurized-milk cheese baseline model (see section 9, “Results of the Model Application Examples”)
If no data uncertainty is considered, the predicted mean risk of invasive listeriosis from consumption of a serving of pasteurized soft-ripened cheese per serving varies as
• 7.2 × 10⁻⁹, 1.8 × 10⁻⁸, 6.1 × 10⁻⁹ among the susceptible populations (Elderly, Pregnant women and Immunocompromised, respectively) in Canada and 1.4 × 10⁻¹⁰ in the non-susceptible population (General) in Canada; and,
• 7.3 × 10⁻⁹, 1.8 × 10⁻⁸, 5.2 × 10⁻⁹ among the susceptible populations (Elderly, Pregnant women and Immunocompromised, respectively) in the U.S. and 1.2 × 10⁻¹⁰ in the non-susceptible population (General) in the U.S.
These mean values correspond to one case of invasive listeriosis per
• 138 million servings in the Elderly population, 56 million servings in the Pregnant women population, 163 Million servings in the Immunocompromised population and 7,290 Million servings in the General population, in Canada; and,
• 136 Million servings for the Elderly population, 55 Million servings for the Pregnant women population, 193 Million servings for the Immunocompromised population and 8,644 Million for the General population, in the U.S.
Differences among subpopulations and between Canada and U.S. come from differences in the characteristics that influence the risk: serving sizes, home storage characteristics and dose-response.
Results from the second-order Monte-Carlo simulation for the pasteurized-milk cheese baseline case suggest that the serving-to-serving variability in the risk largely overwhelms the data
uncertainty, as considered in this report. The sensitivity analysis suggests that the main factors
subpopulation are the prevalence and the level of the initial environmental contamination during cheese manufacture, and the amount of bacterial growth in cheese, particularly during home storage. The main influential factor for our uncertainty about that variability is the dose-response
r parameter.
Alternative Scenarios (see section 10, “Results of the Model Application Alternatives”)
For populations in Canada, predicted mean risk per raw-milk soft-ripened cheese serving at random varies as 3.8 × 10⁻⁷, 9.2 × 10⁻⁷, 4.2 × 10⁻⁷ among the susceptible populations (Elderly, Pregnant women, Immunocompromised, respectively) and 9.5 × 10⁻⁹ in the non-susceptible population (General). These values correspond to one case of invasive listeriosis per 2,600,000 servings eaten by individuals in the Elderly population, 1,100,000 servings in the Pregnant women population, 2,400,000 servings in the Immunocompromised population and 105 Million servings in the General population. For the Elderly population in Canada, the predicted mean risk of invasive listeriosis from consuming a raw-milk soft-ripened cheese serving at random is 53 times higher than the mean risk for pasteurized-milk cheese and the mean risk is 52, 69 and 69 times higher for the Pregnant women, the Immunocompromised and the General populations in Canada, respectively.
Amongst all the evaluated alternatives for raw-milk cheeses, applying a procedure that reduces the bacterial load in raw milk by 6 log10 and testing every raw-milk cheese lot are the only alternatives that lead to a predicted mean risk per raw-milk soft-ripened cheese serving at random lower than the one obtained in the pasteurized-milk cheese baseline scenario (Table 2). The impact of testing raw-milk cheese lots is nevertheless very sensitive to the proportion of cheese lots that are tested. The other alternatives are less efficient. Removing the 60 days regulation reduces the predicted risk of invasive listeriosis following the consumption of raw-milk soft-ripened cheese by a factor of approximately 1.5-2 for Canada and for the U.S. compared to the baseline raw-milk cheese case. A 3 log10, a 4 log10 or a 5 log10 reduction of milk contamination before the cheese processing would reduce the predicted mean risk by a factor of approximately 7.2 (Canada) or 10 (U.S.), 35 or 50, and 56 or 95 compared to the baseline raw-milk cheese scenario, respectively, but would still lead to a higher mean risk than the one estimated in the pasteurized-milk cheese baseline. The impact of a hypothetical substance (an antimicrobial voluntarily added during the manufacture of the raw-milk cheese) that would reduce the L. monocytogenes concentration present at the surface of the cheese by 2 log10 cfu would provide a lower mean risk of invasive listeriosis per serving than estimated in the raw-milk cheese baseline, but this risk would still be 50 and 86 times higher than the mean risk per serving of pasteurized-milk cheese, as estimated in the pasteurized-milk cheese baseline, in Canada and the U.S., respectively. For raw-milk cheeses, testing milk is less efficient than testing cheese lots. Testing milk in the farm tank at every milking reduces the predicted mean risk by a factor of approximately 24 in Canada and 37 in the U.S. compared to the baseline raw-milk cheese scenario, which includes no bulk raw-milk testing, and remains still more risky than the pasteurized-milk cheese baseline case.
Table 2: Impact of various alternatives on the predicted mean risk of invasive listeriosis per soft-ripened cheese serving relative to the risk per serving of baseline cases for Elderly population in Canada and in the U.S.
See table footnotes. See the report for all details and limitations.
Alternative Baseline:
Pasteurized-milk cheese, Canada Baseline: Pasteurized-milk cheese, United States Baseline: Raw-milk cheese, Canada Baseline: Raw-milk cheese, United States
Pasteurized-milk cheese, Baseline 1 (Reference) 1 (Reference) 0.019** = 1/53 0.009 = 1/112
Raw-milk cheese, Baseline 53* 112 1 (Reference) 1 (Reference)
Raw-milk cheese, no 60 day aging condition
36 62 0.67 = 1/1.5 0.56 = 1/1.8
Raw-milk cheese if a process that leads to a 3 log10 reduction of the L. monocytogenes
contamination in incoming milk is applied
7.4 11 0.14 = 1/7.2 0.10 = 1/10
Raw-milk cheese if a process that leads to a 4 log10 reduction of the L. monocytogenes
contamination in incoming milk is applied
1.7 2.0 0.028 = 1/35 0.020 = 1/50
Raw-milk cheese if a process that leads to a 5 log10 reduction of the L. monocytogenes
contamination in incoming milk is applied
1.1 1.2 0.018 = 1/56 0.011 = 1/95
Raw-milk cheese if a process that leads to a 6 log10 reduction of the L. monocytogenes
contamination in incoming milk is applied
0.84 = 1/1.2 0.80 = 1/1.25 0.014 = 1/71 0.008 = 1/125
Raw-milk cheese if a substance that reduces the surface contamination by 2 log10 is
applied
50 86 0.83 = 1/1.2 0.82 = 1/1.2
Raw-milk cheese if the milk is tested in farm bulk tank, at every milking***
2.2 3.0 0.042 = 1/24 0.027 = 1/37
Raw-milk cheese if the cheese lots are tested***
0.080 = 1/12 0.134 = 1/7.4 0.002 = 1/658 0.001 = 1/ 832
* Interpretation: “The mean risk of invasive listeriosis from a serving of soft-ripened cheese made from raw milk is 53 times the mean risk of invasive listeriosis from a serving of soft-ripened cheese made from pasteurized milk for servings consumed by individuals from the Elderly population in Canada”.
** Ratios <1: the mean risk of the alternative is smaller than the reference; this example, which is the same as the preceding one, could read: “The mean risk of invasive listeriosis from a serving of soft-ripened cheese made from pasteurized milk is 0.019 times the mean risk of invasive listeriosis from a serving of soft-ripened cheese made from raw milk for servings consumed by individuals from the Elderly population in Canada”.
*** Volume tested: 25 ml for milk, 25 g made of 5 g from each of 5 cheeses at random for cheese lot; single L. monocytogenes detection probability: 0.75, test frequency: 100% of farms, tankers, dairy silos, cheese lots, respectively. Detected positive units are removed from production.
Limitation, Caveats and Data Gaps (see section 11)
The model and, as a consequence, the results and conclusions are limited to the considered pathogen and the considered type of cheese. These results do not apply to other type of cheese with different growth characteristics, such as hard cheese.
may provide incomplete information about the prevalence of contaminated lots and contaminated cheeses within contaminated lots.7
There is a considerable uncertainty in the dose-response model. The sensitivity analysis shows that, within the small part of the overall uncertainty that is considered here, the uncertainty surrounding the r parameter of the dose-response model dominates all other sources of uncertainty in the risk results. A part of this uncertainty is naturally discarded within this risk assessment, when alternatives are compared to the baseline models. Nevertheless, the absolute values obtained in this risk assessment should not be compared with other results obtained using a different dose-response model without some caution.
Only a small part of the overall uncertainty is considered in this study, while it is recognized that there are many other types of uncertainty in risk assessments. Total uncertainty includes parameter uncertainty (measurement errors, sampling errors, systematic errors), model uncertainty (uncertainty due to necessary simplification of real-world processes, mis-specification of the model structure, model misuse, use of inappropriate surrogate variables), and scenario uncertainty (descriptive errors, aggregation errors, errors in professional judgment, incomplete analysis) (US EPA 1997). While our results suggest that the considered uncertainty is less important than variability, absolute values should be considered with some caution.
Results rely also on extrapolations –over time, for example, from bulk tank surveys carried out in the 1990s to current day farm bulk tank characteristics and from nutrition surveys done in the early 2000s to present day; from a sampling population to the reference population of interest, for example, from U.S. home storage data to Canada, from U.S. retail-level contamination levels and frequency to Canada, from women of child-bearing age to pregnant women; and, from laboratory to production-- from study populations to populations appropriate as a reference for this study. Biases and uncertainty that those extrapolations introduce are unknown.
7 We tested the impact of an (hypothetical) lower environmental contamination prevalence in the response to public
Sensitivity analyses to some key parameters are provided in the body of this document. Despite the limitations identified above, we concluded that no critical data gaps impair the conclusions of this risk assessment. For example, the exact processing may differ from one soft-ripened cheese to another. However, the general conclusions - i.e. that the risk of listeriosis from consumption of ripened cheese made from raw milk is substantially larger than that for consumption of soft-ripened cheese made from pasteurized milk, that the 60-day aging regulation actually increases the risk of listeriosis for consumption of raw-milk cheeses, that a 6 log reduction (or equivalent) of the contamination in milk is necessary to make raw-milk cheeses as safe from listeriosis as pasteurized-milk cheeses, and that most other strategies are not sufficient by themselves - apply to any soft-ripened cheeses in or on which Listeria monocytogenes can grow substantially. That said, as with any risk assessments, additional data would likely decrease the uncertainty in the risk estimates.
1.
Introduction
Listeria monocytogenes is a widely occurring pathogen that is frequently present in soil, sewage,
freshwater sediment and effluents; it can be found in agricultural food processing plants. Ingestion of L. monocytogenes can lead to the development of listeriosis, with consequences that may include septicemia, meningitis, encephalitis, spontaneous abortion, and stillbirth. Epidemiological data show that listeriosis has one of the highest hospitalization rate and case fatality among foodborne diseases (Mead et al. 1999; CDC 2008; Scallan et al. 2011).
The United States and Canada continue to experience sporadic illnesses and outbreaks of listeriosis associated with the consumption of cheese, particularly soft and soft-ripened cheese. Both the U.S. DHHS - Food and Drug Administration (FDA) and Health Canada - Santé Canada (HC) continue to evaluate the safety of these cheeses, particularly cheese made from unpasteurized milk. As part of this effort, FDA and HC carried out a quantitative risk assessment to evaluate the effectiveness of and public health impact of processing and intervention strategies to reduce or prevent L. monocytogenes contamination in soft-ripened cheeses. These cheeses are of interest because of the large number of factors that affect risk (e.g., microbiological quality of the source material, scale of operation, manufacturing practices), interest in international distribution of cheese made under different conditions, and increasing interest in applying alternative risk mitigation technology. In addition, outbreaks and recalls associated with cheese have prompted a need to evaluate current and potential risk management strategies.
Specifically, the risk assessment considered the public health impact of:
• variations in L. monocytogenes levels in the raw materials used to produce cheese;
• changes in L. monocytogenes levels (i.e., growth, inactivation, or contamination) at each step of the manufacturing process, between final packaging and sale at retail, and
between retail sale and consumption; and
The public health issues considered included:
• changes in the level of risk associated with the use of raw milk, pasteurized milk, or milk treated by a process that achieves a 3 log10 reduction in L. monocytogenes in cheese-making;
• changes in the level of risk from modifications of, or deviations from, existing manufacturing processes (including sanitation);
• changes in the level of risk associated with the use of new or additional interventions;
• changes in the level of risk associated with different conditions during transport, distribution, and home storage.
In addition, the level of risk was evaluated for susceptible populations including the Elderly, Pregnant women, and the Immunocompromised.
2.
Background
2.1.Recalls, Outbreaks and Sporadic Cases Associated with L. monocytogenes in Soft-Ripened Cheese
Listeria has been the most common microbial cause of recalls for cheese products in both the
U.S. and Canada. In the U.S. from 1986 to 2008 there were a total of 137 recalls of various types of cheeses, of which 108 (79%) were Listeria-related. In Canada from 2004 through mid-2009 there were 15 cheese recalls, of which 11 (73%) were Listeria-related. A wide variety of cheeses were involved in these recalls (Table 3). The three most common types of cheeses involved in these recalls were fresh soft cheeses, which have previously been shown to be at high risk for
L. monocytogenes contamination (FDA/FSIS 2003), hard cheeses (which represent the largest
Table 3: U.S. and Canadian L. monocytogenes related cheese recalls.
Cheese Type U.S.
(1986-2008)
Canada (2004-2009)
Hard 25 1
Fresh soft 24 5
Soft-ripened 22 1
Unknown / Undefined / Multiple 15 1
Semi-soft 13 2
Soft-unripened 3 0
Processed 6 1
Sources: Canadian Food Inspection Agency, U.S. Food and Drug Administration.
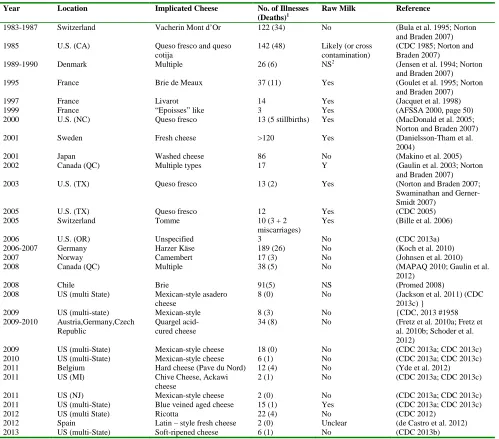
Table 4: Cheese associated Listeria outbreaks.
Year Location Implicated Cheese No. of Illnesses (Deaths)1
Raw Milk Reference
1983-1987 Switzerland Vacherin Mont d’Or 122 (34) No (Bula et al. 1995; Norton
and Braden 2007)
1985 U.S. (CA) Queso fresco and queso
cotija
142 (48) Likely (or cross contamination)
(CDC 1985; Norton and Braden 2007)
1989-1990 Denmark Multiple 26 (6) NS2 (Jensen et al. 1994; Norton
and Braden 2007)
1995 France Brie de Meaux 37 (11) Yes (Goulet et al. 1995; Norton
and Braden 2007)
1997 France Livarot 14 Yes (Jacquet et al. 1998)
1999 France “Epoisses” like 3 Yes (AFSSA 2000, page 50)
2000 U.S. (NC) Queso fresco 13 (5 stillbirths) Yes (MacDonald et al. 2005;
Norton and Braden 2007)
2001 Sweden Fresh cheese >120 Yes (Danielsson-Tham et al.
2004)
2001 Japan Washed cheese 86 No (Makino et al. 2005)
2002 Canada (QC) Multiple types 17 Y (Gaulin et al. 2003; Norton
and Braden 2007)
2003 U.S. (TX) Queso fresco 13 (2) Yes (Norton and Braden 2007;
Swaminathan and Gerner-Smidt 2007)
2005 U.S. (TX) Queso fresco 12 Yes (CDC 2005)
2005 Switzerland Tomme 10 (3 + 2
miscarriages)
Yes (Bille et al. 2006)
2006 U.S. (OR) Unspecified 3 No (CDC 2013a)
2006-2007 Germany Harzer Käse 189 (26) No (Koch et al. 2010)
2007 Norway Camembert 17 (3) No (Johnsen et al. 2010)
2008 Canada (QC) Multiple 38 (5) No (MAPAQ 2010; Gaulin et al.
2012)
2008 Chile Brie 91(5) NS (Promed 2008)
2008 US (multi State) Mexican-style asadero cheese
8 (0) No (Jackson et al. 2011) (CDC
2013c) }
2009 US (multi-state) Mexican-style 8 (3) No {CDC, 2013 #1958
2009-2010 Austria,Germany,Czech Republic
Quargel acid- cured cheese
34 (8) No (Fretz et al. 2010a; Fretz et
al. 2010b; Schoder et al. 2012)
2009 US (multi-State) Mexican-style cheese 18 (0) No (CDC 2013a; CDC 2013c)
2010 US (multi-State) Mexican-style cheese 6 (1) No (CDC 2013a; CDC 2013c)
2011 Belgium Hard cheese (Pave du Nord) 12 (4) No (Yde et al. 2012)
2011 US (MI) Chive Cheese, Ackawi
cheese
2 (1) No (CDC 2013a; CDC 2013c)
2011 US (NJ) Mexican-style cheese 2 (0) No (CDC 2013a; CDC 2013c)
2011 US (multi-State) Blue veined aged cheese 15 (1) Yes (CDC 2013a; CDC 2013c)
2012 US (multi State) Ricotta 22 (4) No (CDC 2012)
2012 Spain Latin – style fresh cheese 2 (0) Unclear (de Castro et al. 2012)
2013 US (multi-State) Soft-ripened cheese 6 (1) No (CDC 2013b)
There have been listeriosis outbreaks linked to cheese consumption worldwide (Table 4). The majority of these outbreaks were associated with fresh-soft or soft-ripened cheeses.
These data show that, while listeriosis may be associated with the consumption of any type of cheese, fresh-soft and soft-ripened cheeses could be of significant public health concern.
Importantly, the majority of listeriosis cases are sporadic cases, i.e. not linked to outbreaks (86% of the listeriosis cases reported to CDC (2013c)). There is very little information about the origin of these sporadic cases (Varma et al. 2007). For multiple reasons (small batches, extreme heterogeneity of individual susceptibility), we expect to see primarily sporadic cases of listeriosis linked to small-scale cheese producers. Note that a French case-control study carried out on 120 sporadic cases of listeriosis observed in 1997 indicated that some cases could be associated with consumption of soft cheeses ((De Walk et al. 1998) cited by (De Buyser et al. 2001)).
2.2.Overview of Cheese Regulation
The overall production process is similar for all cheeses. Changes at specific points in the process lead to production of different types of cheese. In general, the process consists of receiving and holding milk, possible pre-treatment (e.g., pasteurization) of the milk, addition of starter cultures and enzymes, coagulation and cutting of the coagulum, draining and molding of curd, ripening, and packaging. The incoming milk may be from one of more herds or farms depending on the nature and scale of the production facility, and milk from different sources may be combined on the farm, during transport, or at the manufacturer. After production and packaging, the products may follow very different pathways from the manufacturer to consumption depending on the nature of the product and the manufacturer (artisanal or large scale) or if the cheese is intended for further repackaging or processing.
content in the final product. Similarly, Canadian Food and Drug Regulations define the properties of a number of types of cheeses (CRC, c870). U.S. regulations have a standard for soft-ripened cheeses not otherwise standardized that specifies the production process and final milk fat content (21 CFR 133.182). Canadian regulations are not as specific regarding the production processes for cheeses and ripened cheeses in particular, but do define a soft-ripened cheese such as Camembert as having less than 56% moisture and more than 22% milk fat and soft-ripened cheese such as Brie as having less than 54% moisture and more than 23% milk fat (B.08.033).
[image:36.612.98.504.476.543.2]Both U.S. and Canadian regulations also contain provisions related to cheese safety. These include regulatory definitions of the times and temperatures needed for milk pasteurization. U.S. regulations define “pasteurized” to mean that milk has been heated in properly designed and operating equipment to one of several temperatures for defined times (Table 5) as well as other time-temperature combinations that have been “demonstrated to be equivalent thereto in microbial destruction” (21 CFR 133.3(d)). In addition, for soft-ripened cheeses in the U.S., “[m]ilk shall be deemed to have been pasteurized if it has been held at a temperature of not less than 143°F for a period of not less than 30 minutes, or for a time and at a temperature equivalent thereto in phosphatase destruction” (21 CFR 133.182(c)(2)).
Table 5: Time temperature combinations for milk pasteurization as defined in 21 CFR 133.3(d).
Temperature Time
145°F 30 min.
161°F 15 s.
191°F 1 s.
204°F 0.05 s.
212°F 0.01 s.
“stored” as to have been kept or held at a temperature of 2°C (36°F) or more for a period of 60 days or more from the date of the beginning of the manufacturing process.
In both the U.S. and Canada, cheese that is produced and distributed purely intrastate or intraprovince is still subject to regulation at the state or provincial level. In the U.S., there are significant state-to-state differences in the regulations governing the sale of raw milk. In Canada, as of September 2009, the province of Québec allows the manufacture and sale of soft and semi-soft cheeses made from raw milk that have not been aged for 60 days if the manufacturer meets requirements prescribed in the provincial regulation respecting food.
2.3.Overview of Cheese Production
As the baseline models for this risk assessment use a representative example of soft-ripened cheese, the following overview of cheese production refers specifically to Brie and Camembert, in which both microbial and fungal activities (primarily from Penicillium candida and
Penicillium Camemberti) determine the physical characteristics and flavor of the cheese.
Because fungal growth and activity occurs primarily near the surface, both have distinct inner cores and external rinds. The entire production and aging process takes approximately 14 days to 5 weeks. The generic terms Brie and Camembert are used to describe types of soft-ripened cheeses made with generally similar processes. The specific terms “Brie de Meaux”, "Brie de Melun" and “Camembert de Normandie” are controlled French designation of origination ("Appellation d'origine contrôlée") that indicate both the place of production and the specific process used.
cheeses in two reveals a smooth, glistening, plastic-like appearance of the entire cut surfaces without a center curd core.
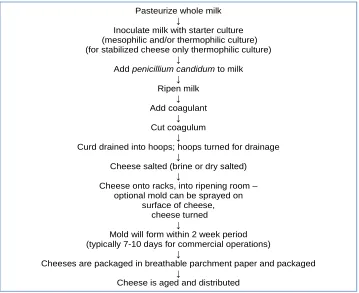
[image:38.612.126.485.257.550.2]Several factors determine whether and at what level L. monocytogenes could become introduced to contaminate the final product. Extrinsic factors include the microflora of the incoming milk, the possible use of a microbial control treatment, potential cross-contamination during manufacturing, and the temperature at each step. The most significant intrinsic factors are the water activity (aw) and pH of the milk and nascent cheese as the process progresses.
Figure 1: General flow chart for commercial production of Camembert.
2.4.Overview of the Cheese Industry
The cheese-making industry in the U.S. and Canada is highly diverse, both in terms of the number and types of products produced and in the diversity of the producers. For example, the September 2007 A.C. Nielsen database of total cheese sales lists over 16,500 Universal Product Codes (UPC) and several hundred brand names used by large retailers in the U.S. The Nielsen
Pasteurize whole milk
↓
Inoculate milk with starter culture (mesophilic and/or thermophilic culture) (for stabilized cheese only thermophilic culture)
↓
Add penicillium candidum to milk
↓
Ripen milk
↓
Add coagulant
↓
Cut coagulum
↓
Curd drained into hoops; hoops turned for drainage
↓
Cheese salted (brine or dry salted)
↓
Cheese onto racks, into ripening room – optional mold can be sprayed on
surface of cheese, cheese turned
↓
Mold will form within 2 week period (typically 7-10 days for commercial operations)
↓
Cheeses are packaged in breathable parchment paper and packaged
↓
database contains scanner data from a set of large retailers and national merchandisers. The data do not include products marketed directly to consumers or through small or specialty retailers. The USDA National Agricultural Statistics Service (NASS) estimates that over 400 million kilograms (900 million pounds) of cheese were manufactured in 2007.
There are few data available on the amount of Brie and Camembert produced yearly in the U.S. and Canada. The USDA NASS does not gather data on domestic production of these cheeses, although USDA import reports show that approximately 12 million kg (26 million pounds) of soft-ripened cheeses of all sorts are imported into the U.S. yearly. The Nielsen database contains over 100 UPCs for Brie and over 50 UPCs for Camembert products (imported and domestically produced). The sales associated with these UPCs total approximately 2 million kg (4.4 million pounds) of Brie and 0.4 million kg (0.9 million pounds) of Camembert yearly through the retail outlets reported in the Nielsen data base.
Brie and Camembert production in the U.S. and Canada generally occurs in facilities that can be characterized as either large producers or as small (artisanal or farmstead) producers. Although the outline of the cheese production process is the same regardless of scale, there are a number of factors that differ between the large and small producers that may have a significant impact on the microbiological safety of the final product. These factors include, for example, the need to pool milk from multiple herds or farms and the time for and conditions experienced during transport and storage of the milk prior to cheese-making.
the public health impact of different practices and production systems, and expressed risk on a per-serving basis for each scenario as compared to the baseline models.
2.5.Quantitative Microbial Risk Assessment
The components of a quantitative microbial risk assessment, and the role of risk assessment within food safety risk analysis, have been described in several publications (Codex alimentarius Commission 1999; CFSAN Risk Analysis Working Group 2002). Food safety microbial risk assessments consist of four components:
• Hazard identification – Identifies the pathogen of concern and describes the health effects associated with consumption of that pathogen.
• Hazard characterization – Characterizes the relationship between the level of exposure to a pathogen and the probability and severity of adverse responses. In a quantitative risk assessment this may include a dose-response relationship.
• Exposure assessment – Describes the frequency and level of exposure to the pathogen by consumers. This may include modeling changes in the presence and level of the hazard in a product pathway.
• Risk characterization – Integrates the hazard characterization and exposure assessment to predict the probability and severity of adverse health effects in a population of consumers.
The end result of a quantitative risk assessment is an estimate of the public health impact of exposure to a particular hazard through a particular pathway and of the uncertainties that accompany the estimate. This impact may be expressed in terms such as the probability of illness per serving of a food, or as the total number of expected cases of illness per year in either the whole population or in defined subpopulations. A quantitative risk assessment can also be used to identify the critical data gaps that are responsible for the uncertainties in the risk estimates.
estimate current levels of risk in situations where the data are not adequate to allow construction of descriptive models of existing production or distribution processes or pathways. For example, as discussed below in greater detail, data describing either the practices used by artisanal cheese makers or the amount of cheese produced by this industry segment were not available for use in this risk assessment. Therefore, the public health impacts of conditions and practices associated with artisanal or farmstead cheese production were assessed using scenarios that were modifications of the basic model.
2.6.Previous Listeria Risk Assessments
Farber et al. (1996) evaluated the risk of listeriosis from consumption of soft cheeses in Canada. They used a Weibull-Gamma dose response model, and derived model parameters for the general and susceptible populations from surveillance data. They assessed exposure by using data on L. monocytogenes incidence in food from Agri-Food and Agriculture Canada together with their previous work on levels of L. monocytogenes in soft cheese, and used market disappearance data from Statistics Canada as a surrogate for consumption data. They used likely values for the percent of annual listeriosis cases attributable to soft cheese, the susceptible fraction of the population, and the level of illness underreporting in the epidemiological data. Using these values, the risk assessment model produced an estimate of risk that was consistent with the surveillance data and demonstrated the importance of identifying and understanding uncertainty in risk assessment.
In November of 2000, the U.S. Department of Health and Human Services issued Healthy
People 2010, which contained a comprehensive set of disease prevention and health promotion
objectives for the nation to achieve over the first de